Volume model Live Test #1Targeting a 20% move to the downside with no leverage as part of trend system live test.
Volatility

November 3 - November 7The market has been showing no signs of slowing down as of late. Every dip is being aggressively bought and fear hedging of SPX puts and Gold is appearing to be providing more liquidity to keep prices moving higher. I posted this in Minds earlier and will add because it sums up my assessment of where the market is currently at and it’s potential achilles’ heel.
“The US will continue to have one of the most stable market environments compared to the rest of the world, making it a safe place to store capital. While the trade deficit gives the US some leverage over China when it comes to trade, the fact that China is the #3 foreign holder of US debt gives them the “trump card” in the trade war.
Rate cuts will continue to be stimulative and help keep the Fed’s interest payments from getting out of control (for now) but things can quickly unravel if yields start rising to the point where it forces the Fed back into QE prematurely.
This is why Trump keeps backing down from the most extreme measures in the trade war. He knows US companies cannot withstand 100%+ tariffs and China could stop buying Treasuries and start pushing yields higher. This is why I keep an eye on TVC:MOVE when there is stock market volatility to make sure there isn’t growing institutional hedging of Treasuries.
I still need to look everything over to determine my bias for this week but with the trade war entering what I think will be a temporary phase of relief, I’m not seeing strong bearish fundamentals at this point in time.”
Here is what I’m seeing for the week ahead.
+-+-+-+-+-+-+-+-+-+-+-+-+-+-+-+-+-+-+-+-+-+-+-+-+-+-+-+-+-+-+-+-+-+-+-+-+-+-+-+-+-+-
1. Macro
The dollar TVC:DXY is reaching the top of its range and the hollow candles have been less than bullish, so I think the index may once again peak around 100 before reverting back to the average. I am keeping this in mind when comparing other assets to the dollar.
The TVC:US03MY / TVC:US10Y yield spread is once again quite wide, which was recently driven by a rise in the 10Y yield while the 3M yield mostly remained flat, as I suspected would happen in my previous post. The overall trend for both is still slanting downward, so while it’s never great to see the 10Y yield rising, the wider spread is healthier to see. On the contrary, FRED:DFII10 (inflation-indexed 10Y bond) went up on the last available date, Thursday 10/30, so it will be important to watch the Forward Inflation Gauge (bottom right) to see if the market starts to send any inflation signals.
I have updated the formula for the inflation gauge as well to broaden the scope. The new formula is
= US03MY*0.25+US10Y*0.50+US30Y*0.25-DFII10
I decided to include the TVC:US30Y bond since its yield is of the biggest concern to policymakers and weight the average to place the most significance on the 10Y yield. As the shutdown continues, the Fed will be placed in an increasingly difficult position without official data. Since PCE was not published on Friday, this is depriving us of a key piece of data that would show if the market is correct in pricing in lower inflation or if the spread between Real/Implied inflation will continue to widen. This is why yields will yields will provide important clues, especially if the shutdown starts nearing an end. If real employment and inflation data will be released soon after, will the market begin to sell bonds due to lack in confidence or continue the course?
Next on commodities, TVC:GOLD is sitting on its average level and could go either way from here. I’d expect a retracement higher but who knows. As I mentioned above, if the dollar TVC:DXY starts to revert lower, it could help Gold move back up a few points. I’m not expecting much out of Gold for at least another week. It will be interesting to see what happens with Oil and Commodities (bottom right) this week in relation to the dollar index. If for whatever reason, the dollar rallies, it could push oil and ag/metal commodities down, but the alternative may be of greater concern: if the Dollar moves lower again, commodities could surge well above the average in correlation which could be perceived as inflationary since the rise in prices (especially when it comes to copper) has more to do with US trade policy rather than pure international demand. I read earlier today in The Economist that Copper is trading at a higher spot price on the New York exchange compared to London, so to summarize, I will be watching the Macro chart very closely this week, as I think important signals are on the horizon.
2. FX
Other currency indices continuing to fall will help bolster the dollar’s relative standing, so it will be important to keep an eye on this as well as the week unfolds for clues on the Dollar, which in turn will have an effect on commodities. I have the bond yields indexed to 100 again here to show the change and as I mentioned in the introduction, the 3M chart (top) shows how investors are much calmer on the US in the short term compared to other countries. 10Y bonds rose across the board at the end of October but seem to be leveling off.
3. Risk
I don’t draw on my charts as much these days but I think there are some interesting points on this layout that I want to illustrate. First, on the corporate bond yield premium spread (high yield - investment grade) the most recent data (Thursday 10/30) shows the spread went up, which could potentially be a higher low. It will be important to watch this and, to a lesser degree, $HYG/LQD (for intraday) for signals of stress in credit markets.
Next, I still believe the $ES1!/GOLD chart shows the spread found a bottom, so even if Gold gains on ES this week, I think gold’s preference over stocks may continue to decline. Another important development last week was how AMEX:SPY broke out of the rising channel over AMEX:RSP (equal weighted ETF) and held on Friday. As you can see on the bottom chart, TVC:NDQ outperformed the other indices quite well, so I take this as a signal of extreme demand for Tech and other mega-cap stocks that are weighted the highest.
Takeaway: Keep an eye on corporate credit but unless there is a significant change, stocks look biased in favor of Tech and other mega caps.
4. Sector Bias
Tech ( AMEX:XLK ) has been moving up against SP:SPX since the end of October, so the risk appetite is continuing to grow. As I mentioned about $SPY/RSP , this supports that the highest weighted stocks will continue to outperform.
5. Futures Bias
There was some bearish intraday activity on Futures at the end of last week, especially on Friday, where Realized Volatility increased and institutions hedged by buying SPX puts ( TVC:VIX ) and VIX calls ( CBOE:VVIX ), USI:PCSPX was quote high, however there was divergence with VIX, so the weighted index so the institutional interest may have been lower than what the weighted index was indicating.
On the right side, you can see the CVD momentum was in a downtrend from Wednesday-Friday which reacted ahead of the ES price and captured a maximum 1.46% decline
Lastly, I have switched back to Renko from Line Break, as I think the ATR calculation provides better noise filtering while being more reactive to fast changes. Here you can see that the price could not reclaim weekly VWAP (dotted line) Thursday or Friday, so sellers were in control those days and dealers bought into the volatility. It also looks like the price tried to form a range and failed, causing it to slide lower. Right now it will be important to see which way the price goes. If it retraces higher, will it make a new ATH or fail to do so? That could be an important signal to gauge how much strength buyers still have.
Conclusion:
Out of all the charts, I would say that if I were to view the ES chart in isolation I would probably have a bearish bias, and beyond the chart there are developing macro signals that could provide support to the bearish fundamental case (commodity rally, rising corporate credit spreads, dealers short gamma) that will be important to watch for signs of continuation. On the flip side, if I were to view every chart excluding ES, I would say this environment could still support continued upside for the indices (ES1!/Gold spread, the weighted index outperforming unweighted, AMEX:XLK pivot, and low Treasury volatility TVC:MOVE ).
I think this juxtaposition illustrates that the market is uncertain as well. Macro indicators are at what may be an inflection point, so the fear hedging after the 10/22 to 10/30 rally is justifiable since stock market performance will likely be greatly influenced by Macro forces if anything changes. It also seems like arguments can be made that the Dollar rising or falling this week (especially if it’s quick) could have negative ripple effects in the markets this week. I believe the worst case for stocks this week would be a dollar sell off.
For these reasons, it would be reckless to be anything but Neutral here. I’d prefer to play the bull side if it seems like volatility will “unwind”, but if the market seems like it’s going to keep buying into Volatility, I will expect to see lower prices across the indices.
Regardless of what happens this week, I do think SPX hitting 7k this year is all but inevitable, so if I do take a bearish bias, it will be for the short term and will be reassessed on a daily basis. Let me know what you think and thanks for reading.

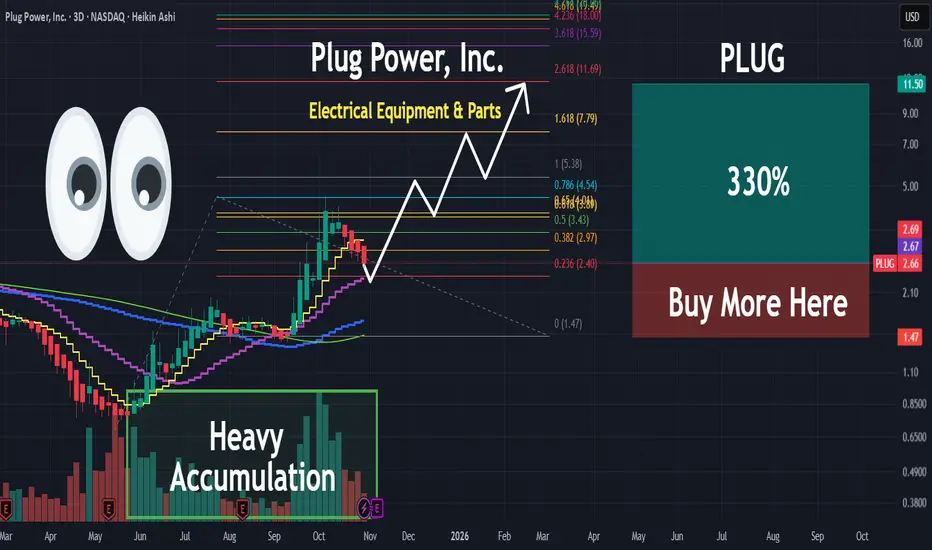
PLUG | An Epic Run Is Incoming | LONGPlug Power, Inc. provides alternative energy technology, which focuses on the design, development, commercialization, and manufacture of hydrogen and fuel cell systems used primarily for the material handling and stationary power markets. Its fuel cell system solution is designed to replace lead-acid batteries in electric material handling vehicles and industrial trucks for some distribution and manufacturing businesses. The company was founded by George C. McNamee and Larry G. Garberding on June 27, 1997, and is headquartered in Slingerlands, NY.
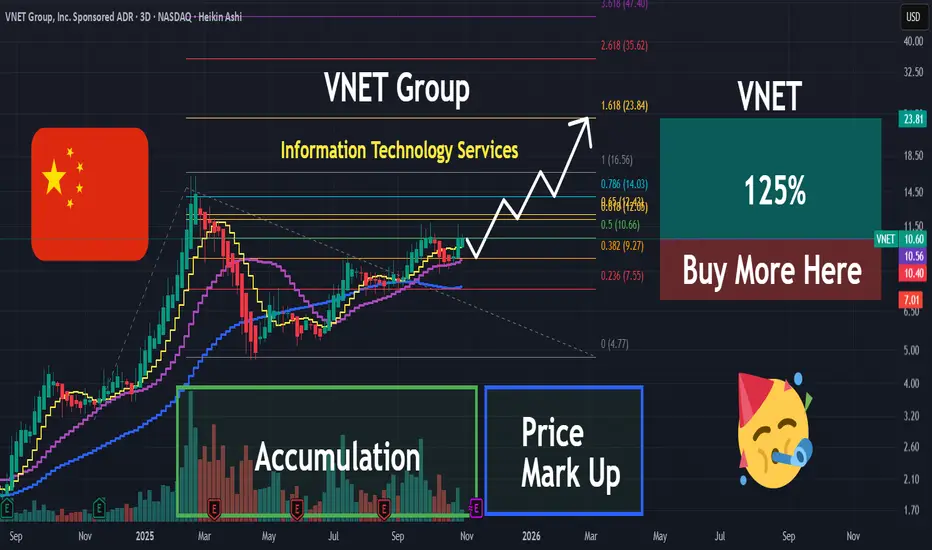
VNET | IT Services in China on the Rise | LONGVNET Group, Inc. operates as a carrier- and cloud-neutral internet data center services provider in China. It provides hosting and related services, including IDC services, cloud services, and business VPN services, to improve the reliability, security, and speed of its customers' internet infrastructure. The firm serves numerous industries, ranging from internet companies to government entities, blue-chip enterprises to small- and mid-sized enterprises. VNET Group was founded by Sheng Chen and Jun Zhang in 1999 and is headquartered in Beijing, China.
Let it continue.Positive news.
OTHERS remained above the 50 line on the RSI.
Volatility is increasing, judging by the SQZMOM.

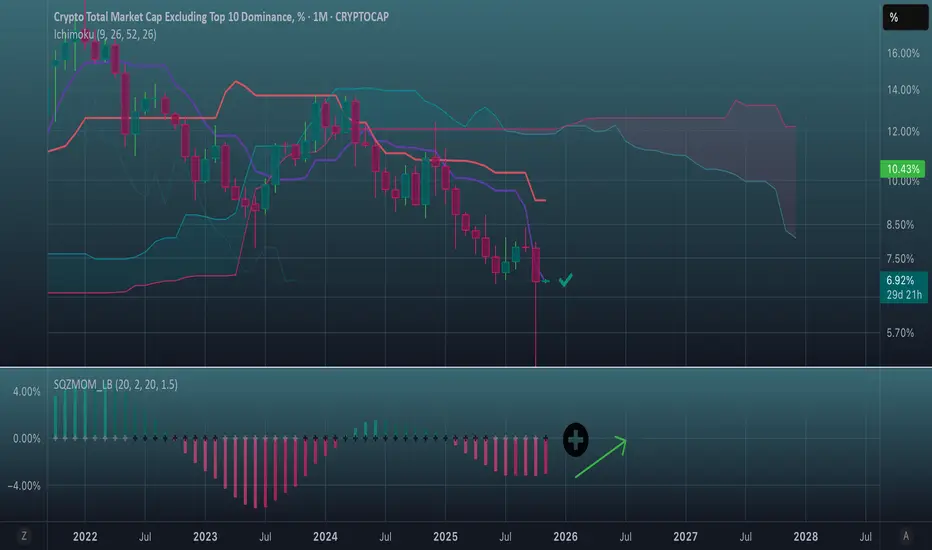
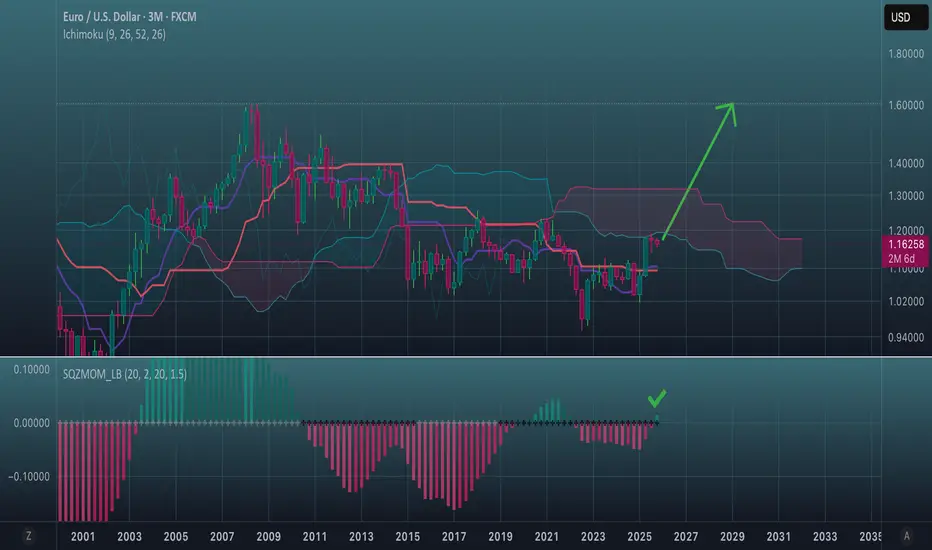
Hello, November.Here, the picture is the opposite of Bitcoin dominance.
The black cross means that a contraction has begun with an exit to the bullish side.
In addition, we note a timid but important sign:
the candle is exactly on the Kijun-sen line and is about to start higher from it.
NVIDIA – A New World First, Where Next?A mere 24 hours after Apple become the third company in history to reach a $4 trillion valuation, NVIDIA set a new benchmark by becoming the first company ever to register a market capitalisation of $5 trillion.
Despite concerns about over extended valuations, the news flow for NVIDIA was initially positive to start this new week as the company attempts to solidify its future at the centre of the potential AI revolution.
CEO Jensen Huang revealed the company had received $500 billion of AI chip orders, including contracts to build supercomputers for the US government and then President Trump commented on Wednesday that NVIDIA’s latest Blackwell chips could be a discussion point when he meets with President Xi at Thursday’s summit in South Korea.
Putting this into numbers, after opening on Monday at 189.25, the stock soared 12% across the first 3 trading days to a high of 212.19 on Wednesday. That move brought its year-to-date rally to 54%, very impressive indeed! Although, it must be said that prices did slip back to close the day at 207.04.
However, overnight the positive sentiment may have stalled slightly, the Federal Reserve cut interest rates 25bps as expected but Chairman Powell provided a more cautious outlook on future cuts than had been anticipated. Also, earnings from Alphabet, Microsoft and Meta released late on Wednesday were mixed, with strong profits offset by rising costs.
Looking forward, the initial updates from the President Trump and President Xi meeting has started to arrive on newswires and traders will be keen to assess the actual details of what was discussed about NVIDIA chip sales between the two countries. A crucial aspect could be whether sales of NVIDIA’s latest Blackwell chip was discussed and if not, what were the reasons why.
Then it’s eyes down for the release of Amazon and Apple earnings after the close tonight which could either confirm the recent bullish moves or throw a sentiment curve ball which could negatively impact in positioning into the weekend.
Technical Update: Acceleration Higher Shifts Focus to Extension Resistance
In just six trading sessions, NVIDIA's share price has rallied over 20%, reaching fresh all-time highs. Such a rapid acceleration can often signal strong momentum but also raises the risk of short-term upside exhaustion, although it's difficult to pinpoint where such moves might slow or even see risks of possible reversal.
In this environment, traders might monitor support and resistance levels, with resistance zones signalling potential for profit-taking, while breaks below support could lead to further price weakness.
[b Potential Resistance Levels:
As price action pushes into uncharted territory with new all-time highs, identifying resistance becomes a challenge. However, traders often turn to Fibonacci extension levels, derived from the most recent correction, to highlight potential areas where upside momentum may slow or even reverse.
As the chart above shows, for NVIDIA, this last correction developed between October 10th and October 22nd and the latest strength appears to be stalling in the short term ahead of 213.23, a level equal to the 100% Fibonacci extension.
There is no guarantee such extension levels will be successful in capping price strength and closing breaks above the 213.23 resistance may shift focus to 220.14, which is the higher 138.2% extension level.
Potential Support Levels:
To maintain NVIDIA’s current price strength, traders may now be focused on Wednesday’s low at 204.78 as near-term support; if price weakness tests this level, its defense will be watched, as a closing break below 204.78 could trigger further downside pressure.
A close below 204.78 could lead to tests of 198.59, the 38.2% Fibonacci retracement of the October 22nd to 29th rally, but if that support gives way, risks may extend toward 194.39, the deeper 50% retracement level.
The material provided here has not been prepared accordance with legal requirements designed to promote the independence of investment research and as such is considered to be a marketing communication. Whilst it is not subject to any prohibition on dealing ahead of the dissemination of investment research, we will not seek to take any advantage before providing it to our clients.
Pepperstone doesn’t represent that the material provided here is accurate, current or complete, and therefore shouldn’t be relied upon as such. The information, whether from a third party or not, isn’t to be considered as a recommendation; or an offer to buy or sell; or the solicitation of an offer to buy or sell any security, financial product or instrument; or to participate in any particular trading strategy. It does not take into account readers’ financial situation or investment objectives. We advise any readers of this content to seek their own advice. Without the approval of Pepperstone, reproduction or redistribution of this information isn’t permitted.

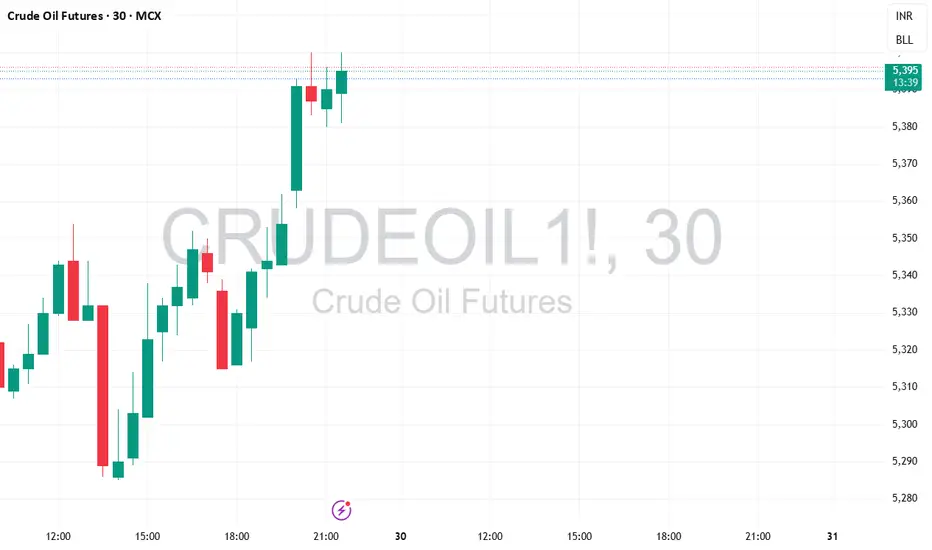
Crude Oil November Contract Breakdown Setup – 5450 PE in PlayMCX Crude Oil – November Contract
CMP: ₹5398
Bearish view
Holding 5450 Put Option (Expiry: 17 Nov 2025)
Avg Price: ₹251.50
Target: ₹320 to ₹325
Target valid till 14 Nov 2025
Tracking price action closely. Will reassess if momentum fades or structure breaks.
#CrudeOilOptions #MCX #OptionsTrading #TradeSetup #PriceAction #TradingViewIndia #DerivativeStrategy #PutOption
20% long play UAMYI have noticed that healthy companies with bull runs tend to have major pullbacks of ~50-60% before short term reversal. I believe UAMY is probably topped out after the recent blow off bull run, but here we are at 56% down after the recent ATH, RSI at a local extreme low. I am buying here and TP around $11.4, unless there are indications for a greater upward move. SL at $8.7. If this fails $8.14 is next support.

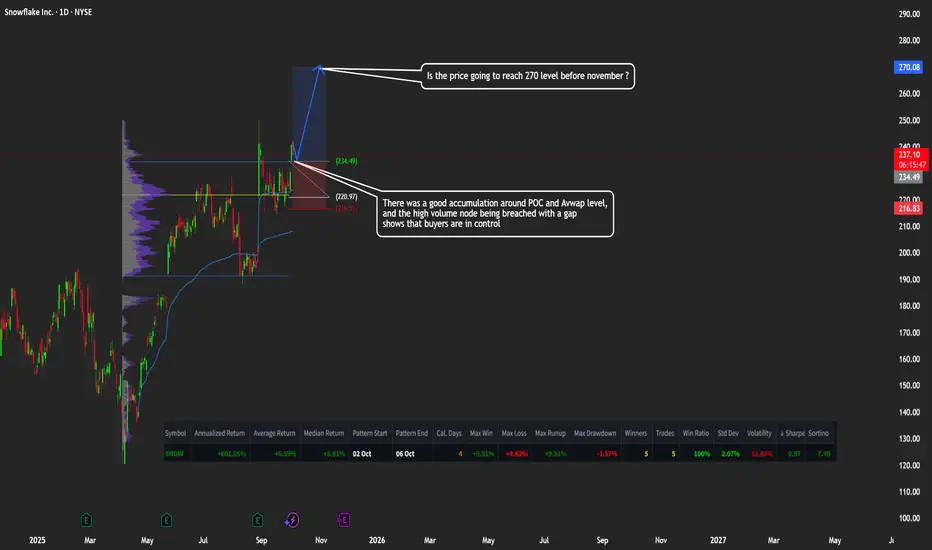
SNOW: Snowflake Headed to $270?🚀 Snowflake Ready for Takeoff? $270 Before November?
Caption:
SNOW has shown strong accumulation around the POC and VWAP levels, with buyers taking control after breaking through the high-volume node with a gap. 📈
Momentum could push the price toward $270 in the coming weeks.
👉 What do you think — is $270 realistic, or will we see a pullback first?
US 100 Index – Yesterday Saw New Record Highs, What Next?Fresh optimism regarding the potential for a US-China trade deal saw the US 100 rise to a new record high of 25889 early this morning, a daily gain of 2% and an unbelievable rise of 58% from its April 6th low at 16324 when trade tensions were at their height.
Now, across the rest of this week, US 100 traders may be focused on several key events to decide the next directional moves for the index. These are, the Federal Reserve (Fed) interest rate decision, earnings from five of the Magnificent Seven corporates, and the face-to-face meeting between US President Trump and Chinese President Xi. Let’s briefly discuss each one.
On Wednesday at 1800 GMT the Fed are fully expected to cut interest rates 25bps (0.25%) when they release the outcome from their 2-day policy meeting (FOMC). What is less certain is what comes next. Markets are still pricing in a high probability of another 25bps cut at the Fed’s next meeting in December, however any indication that this may not be a sure thing could lead to a more negative outcome for the US 100. The comments made by Fed Chairman Powell in the press conference, which starts at 1830 GMT, could be crucial in this regard.
Once the Fed press conference ends on Wednesday, traders may be absorbed by the release of earnings from Alphabet, Microsoft and Meta, which are followed by the updates from Amazon and Apple after the market close on Thursday. Remember, it wasn’t that long ago that worries about an AI bubble negatively impacted the US 100, and so the focus in these results could be on AI spending, future revenue growth and costs.
The final event is the face-to-face meeting between President’s Trump and Xi which takes place in South Korea on Thursday, the first in 6 years. Current expectations are for the heads of the world’s two biggest economies to agree a series of deals on rare earth metals, soybeans, shipping levies and export controls. Whether these agreements match up to expectations could be pivotal to the direction of the US 100 into the weekend.
Technical Update: Mind The Gaps!
CFD price activity typically forms in relatively smooth patterns, rising in uptrends or falling in downtrends. While brief corrections may occur, they’re often limited in scope and duration before the prevailing trend resumes, unless a shift in sentiment triggers a directional reversal.
Occasionally, within an orderly price advance or decline, acceleration phases emerge, which can result in gaps in price activity. These gaps occur when a CFD closes one session and then opens higher in an uptrend or lower in a downtrend the next day, reflecting a surge in trader interest in the direction of the prevailing trend.
Within technical analysis, there are three types of price gaps, each offering insight into trader sentiment and directional risk. Below is a brief overview of each.
Breakaway Gap: Typically seen at the start of a new trend, this gap reflects strong trader conviction, buyers are willing to pay higher prices at the open in an uptrend, or sellers accept lower prices in a downtrend. It can often be seen to complete a reversal pattern and signals a possible shift in sentiment.
Continuation Gap: Forming within an established trend, this gap can confirm ongoing sentiment, buyers continue to pay higher prices in an uptrend, or sellers accept lower prices in a downtrend. It reinforces confidence in the prevailing move.
Exhaustion Gap: Found in mature trends, this gap reflects late-stage trader entry at already overextended levels, reflecting poor timing, as most of the move has already occurred. It may signal panic buying or selling, with positioning then heavily skewed in the direction of the prevailing trend.
When positioning becomes overly one-sided, with no buyers left in an uptrend or sellers in a downtrend, price can be most vulnerable to a sentiment reversal, often triggering corrective moves.
US 100 Index: Watching the Gaps
The eagle-eyed among you will have noticed that the charts used to illustrate gap concepts above feature the activity of the US 100 Index, which since the April 7th low, is possibly a good example of these gaps in price action.
The latest gap, formed between last Friday’s close and Monday’s open, is labelled as both a possible continuation and exhaustion gap, as it’s unclear at present what this move currently represents. It could signal a continuation of the uptrend from the April lows, or mark an exhaustion point, raising the risk of a sentiment reversal.
Monitoring future price action may help determine whether the latest gap reflects continuation of the uptrend or signals exhaustion, suggesting the risk of price weakness.
If Latest Activity Proves to be a Continuation Gap
If the gap from Friday’s 25374 close is a continuation gap, it could signal a further phase of price strength. This would imply that if price action holds above 23474, upside momentum may still be evident.
If the US 100 Index holds above support at 25374 it may then go on to challenge the next resistance at 25937, which is the 61.8% Fibonacci extension. A break above this level might even open the path toward 26393, which is the 100% extension.
If Latest Activity Proves to be an Exhaustion Gap
If the latest gap activity reflects exhaustion, with positioning skewed too far to the long side, it may lead to a phase of price weakness following the recent advance. A closing break below 25374 could build on these themes and even suggest possibilities of a more extended phase of price weakness.
A move below 25374 could signal fading buying support, suggesting a shift toward lower levels. If evident, downside risks may extend to 25079, which is the 38.2% Fibonacci retracement, potentially even toward 24668, a level marking the 61.8% retracement.
The material provided here has not been prepared accordance with legal requirements designed to promote the independence of investment research and as such is considered to be a marketing communication. Whilst it is not subject to any prohibition on dealing ahead of the dissemination of investment research, we will not seek to take any advantage before providing it to our clients.
Pepperstone doesn’t represent that the material provided here is accurate, current or complete, and therefore shouldn’t be relied upon as such. The information, whether from a third party or not, isn’t to be considered as a recommendation; or an offer to buy or sell; or the solicitation of an offer to buy or sell any security, financial product or instrument; or to participate in any particular trading strategy. It does not take into account readers’ financial situation or investment objectives. We advise any readers of this content to seek their own advice. Without the approval of Pepperstone, reproduction or redistribution of this information isn’t permitted.

MCX Crude Oil: Bearish Setup with 5550 PEMCX Crude Oil – November Contract
CMP: ₹5467
Bearish view
Bought 5550 Put Option (Expiry: 17 Nov 2025)
Target: ₹320 to ₹325
Target valid till 14 Nov 2025
Tracking price action closely. Will reassess if momentum fades or structure breaks.
#CrudeOilOptions #MCX #OptionsTrading #TradeSetup #PriceAction #TradingViewIndia #DerivativeStrategy #PutOption #ExpirySetup

Gold Volatility Over? Maybe Not Yet!Gold volatility hit new heights last week when a push from opening levels at 4243 on Monday (Oct 20th) up to a new record high of 4381 was immediately followed on Tuesday (Oct 21st) by a crash back to lows at 4004 as traders were forced to liquidate weak long positions after key short term technical support levels gave way.
If price moves last week were dominated by positioning, moves in the week ahead could be more events driven providing traders with a lot for to focus on and potentially further excessive volatility to navigate.
Weekend news has so far provided positive soundbites on progress towards de-escalating trade tensions between the US and China. President Trump has stated he is confident of a deal after US and Chinese trade representatives concluded a 2-day meeting in Malaysia (Reuters), while US Treasury Secretary Scott Bessant commented that he believes the two negotiating teams have agreed on a successful framework for President Trump and President Xi to discuss when they meet on Thursday (Oct 30th), their first face to face meeting in 6 years. This has already led to a sell-off in Gold prices from Friday’s closing level at 4112 to a low of 4053 this morning.
Geo-politics remains in focus as Ukrainian and Russian forces trade drone strikes in Ukraine, while a Kremlin spokesperson said it was too early to talk about the cancellation of a meeting between President’s Putin and Trump, despite the White House’s blacklisting of Russia’s main 2 oil producers, Rosneft and Lukoil last Wednesday complicating the issue.
Also on Wednesday evening, the Federal Reserve announce their next interest rate decision at 1800 GMT, with the press conference led by Chairman Jerome Powell commencing at 1830 GMT. While a 25bps (0.25%) rate cut is expected from Fed policymakers, the press conference could be the main volatility driver for Gold prices, as Chairman Powell provides traders with an update on whether a further rate cut is likely in December as anticipated, or if an on-going US government shutdown, which has stopped key US economic growth and labour market data releases, has clouded the issue.
Technical trends may also have a significant impact on where Gold moves next.
Technical Update: Is the Bollinger Mid-Average Key?
Gold’s sharp 8.60% sell-off from the October 20th all-time high at 4381 prompted speculation over a possible sentiment shift that could mean an end to the recent strong advance. However, the rising Bollinger mid-average has so far contained the decline as can be seen on the chart below.
This rising Bollinger mid-average, currently at 4069, held the latest Gold decline, suggesting it might be a key support focus again this week. How the Gold price behaves around this level on a closing basis may offer clues to the next directional bias, either marking stabilisation or opening the risk of a deeper phase of weakness.
If the Bollinger Mid-Average Holds Price Weakness:
If the support at 4069 continues to hold on a closing basis, Gold may see renewed attempts at strength. Traders could then be focused on how potential resistance at 4150, which is the 38% Fibonacci retracement of the latest decline, is defended.
While the mid-average support remains intact, a closing break above 4150, could lead to further upside possibilities, shifting focus to 4239, the 61.8% retracement of the recent decline, or even extending toward 4381 the October 20th all-time high again.
If the Bollinger Mid-Average Support is Broken:
While 4069 has so far contained Gold’s recent selling pressure, it may not hold indefinitely. A closing break below this level might raise the risk of a more extended phase of weakness, opening deeper corrective themes.
Closes below 4069 in Gold could shift trader focus to 3957, which is the 38.2% Fibonacci retracement of the July 30th to October 20th rally. If this support gives way, downside risks may in turn extend toward 3825, a level which marks the deeper 50% retracement level.
The material provided here has not been prepared accordance with legal requirements designed to promote the independence of investment research and as such is considered to be a marketing communication. Whilst it is not subject to any prohibition on dealing ahead of the dissemination of investment research, we will not seek to take any advantage before providing it to our clients.
Pepperstone doesn’t represent that the material provided here is accurate, current or complete, and therefore shouldn’t be relied upon as such. The information, whether from a third party or not, isn’t to be considered as a recommendation; or an offer to buy or sell; or the solicitation of an offer to buy or sell any security, financial product or instrument; or to participate in any particular trading strategy. It does not take into account readers’ financial situation or investment objectives. We advise any readers of this content to seek their own advice. Without the approval of Pepperstone, reproduction or redistribution of this information isn’t permitted.

October 27 - October 31 2025Last week of the month and the market is back at ATH - but is this a true breakout or a final shakeout of buyers? I think the market is showing some important clues and will run through my charts again but plan on keeping this brief so I can move on to other things on this beautiful Sunday.
1. Macro
As I mentioned in last week’s post, the $GOLD/GVZ spread was showing signs of trend exhaustion (gold puts were being hedged heavily compared to the underlying) which provided to be an early signal of the Gold pullback. Here we are seeing the Dollar’s continued flat movement, which may result in a move below the average this week.
Yields continue to slide and are now diverging, with the 3M yield possibly showing signs of outpacing the 10Y yield to the downside, which may suggest that the market is expecting speedier intervention from the Fed.
On the bottom left, I have overlaid ECONOMICS:USCCPI on my forward inflation gauge chart to illustrate that the market has been pricing in lower inflation expectations, and we are now seeing the initial tariff-bump to inflation flatten out, which is in line with the market’s expectation. Bottom line - the market should now be more sensitive to news that could indicate higher inflation since it is currently pricing for lower rather than before when the market was pricing higher inflation that ended up being slightly higher than the real data.
On the commodities side, we’re seeing more of the same. I’ll touch more on gold on my Risk layout and it looks like Oil NYMEX:CL1! is still in a flat range and may be making a lower high after a lower low. This week I have expanded my commodity index (bottom right) to add Cotton ICEUS:CT1! and Aluminum COMEX:ALI1! to broaden the scope. My thinking is that corn CBOT_MINI:MZC1! is one of the most versatile crops in the world: a staple food, biofuel, and industrial crop, while Cotton is unique in that it is a non-food crop that is essential to the manufacturing of clothing and other consumer & industrial products. This pairing covers all the bases when it comes to demand for crops for various uses. Similarly, my thinking for metals is that Copper COMEX:HG1! is widely used in electrical infrastructure and consumer/industrial electronics while Aluminum COMEX:ALI1! is used in consumer products, construction, auto manufacturing, and so on.
The takeaway is that the gauge here has been in an uptrend in April while real inflation and forward inflation expectations have cooled, so the market is likely absorbing these higher prices/not passing them to consumers. Conclusion: the macro environment is looking more stable, however with China tariffs in focus it will be highly important to watch the commodity gauge and TVC:US03MY . Commodity gauge rising sharply could force the market to reprice inflation expectations, which would benefit Gold, hurt the dollar TVC:DXY and possibly lead to higher bond yields. I’m cautiously optimistic here.
2. FX
Using a date range of the last Fed rate decision to today, the dollar TVC:DXY has outperformed other currency baskets (while still being the worst performer for the year). When looking at global 3M and 10Y yields on indexed charts, outside of Japan there was 10Y buying during mid-October that is now showing signs of flattening out. On the 3M side, treasuries have slid while Eurozone (EU, France, Italy, Germany) are showing some divergence, likely due to a troubling combination of slow growth, high debt, and political instability. The takeaway here is that I expect the dollar’s flat range to continue, and may outperform other currency baskets as a result. This chart also indicates that the US bond market is currently providing a safe haven, especially when relatively attractive Real Yields are considered as well.
3. Risk
This chart shows indexes appeared to have recovered from the period of volatility and the line chart appears to show upward momentum, rather than a top forming. This is bolstered by the High Yield-Investment Grade bond Option Adjusted Spread (top left) showing signs of consolidation or moving back down. Investment Grade bonds currently have a very low premium vs treasuries, so downside resistance should be expected. Keeping it around this level would be ideal, as the OAS moving too low could make the market sensitive to a shock and moving higher could indicate an adverse sentiment towards risk.
Other signs are promising though. $ES1!/GOLD looks like it is going to move higher, further supporting the bias that the gold rally will continue to stall or pull back further. On the top right, $SPY/RSP (SPY vs the equal-weight ETF) shows the weighted index will continue in its uptrend, benefiting the companies with the most weight such as Tech.
One last comment on gold: on the $GOLD/GVZ chart we can see that Gold found support near a familiar level and will either see further reversion or a new upward trend form. This could suggest that the gold downside risk is fading, so it will be important to watch if Gold catches a bid and if so, whether or not it is accompanied by strong hedging. Since I’m mostly leaning towards Gold being flat, I think the more likely scenario is that the gold rally stalling will be temporary and will probably not be accompanied by strong hedging of puts.
4. Sector Analysis
Now that we have seen what is likely a volatility peak, it’s a good time to assess where the market is positioned. Good news is that even though the market pulled back and chopped around in October, Tech (XLK) is still outperforming the market and is on track to continue rising while defensive sectors underperform. Since I have already outlined other reasons why Tech and mega caps are likely to continue outperforming the broader market ( $NQ1!/YM1! and $SPY/RSP ), this is just further confirmation of what I’m already seeing.
5. Bias
As I mentioned last week, I’m currently taking a shorter-term trading approach and as a result, this Bias chart is now focused more on assessing and capturing volatility than determining market bias.
With that being said, the important notes I have are that VIX and VVIX look to have peaked and CVD saw some action last week with strong effort from sellers that did not really move the price down. Futures just opened higher so the session may have lower volatility on Monday (mean reversion) but overall the bullish case here is solid.
Conclusion:
Most signs I’m seeing here point to continued upside for stocks, as fear is being priced out and greed is being priced back in. As I mentioned above, I will watch the macro indicators and sectors for signs that the trend is changing but since we are likely seeing a true breakout, more upside should be expected unless something major changes.
It's a pretty recognizable structure. The assault on the historic peak of $1.60 begins.
Given the monetary situation in the US, this seems logical.
The candles will enter the red cloud and begin to break through this resistance.
CRUDE OIL 17th November ExpiryCMP: ₹5062
Bullish view
Bought 5150 Call Option (Expiry: 17 Nov 2025)
Entry: ₹160.80
Target: ₹240 to ₹245
Target valid till 14 Nov 2025
Tracking price action closely. Will reassess if momentum fades or structure breaks.
#CrudeOilOptions #MCX #OptionsTrading #TradeSetup #PriceAction #LynqverseResearch #TradingViewIndia #DerivativeStrategy #CallOption #ExpirySetup

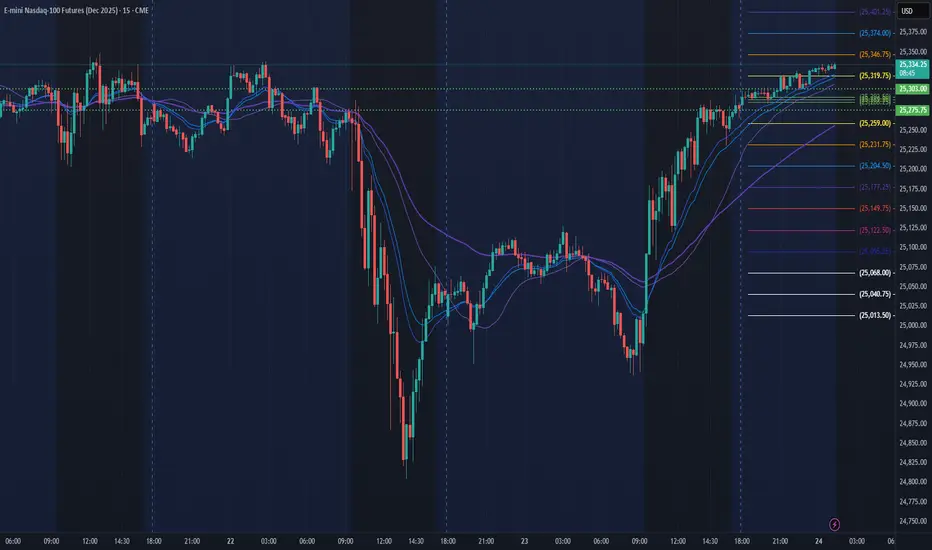
NQ Power Range Report with FIB Ext - 10/24/2025 SessionCME_MINI:NQZ2025
- PR High: 25303.00
- PR Low: 25276.00
- NZ Spread: 60.5
Key scheduled economic events:
08:30 | CPI (Core|MoM|YoY)
09:45 | S&P Global Manufacturing PMI
- S&P Global Services PMI
10:00 | New Home Sales
AMP Futures temporarily setting US Equity Indices Margins to 25% for expected volatility spike for U.S. Economic News Releases
Session Open Stats (As of 12:55 AM)
- Session Open ATR: 385.77
- Volume: 20K
- Open Int: 284K
- Trend Grade: Long
- From BA ATH: -0.2% (Rounded)
Key Levels (Rounded - Think of these as ranges)
- Long: 26020
- Mid: 23571
- Short: 21939
Keep in mind this is not speculation or a prediction. Only a report of the Power Range with Fib extensions for target hunting. Do your DD! You determine your risk tolerance. You are fully capable of making your own decisions.
BA: Back Adjusted
BuZ/BeZ: Bull Zone / Bear Zone
NZ: Neutral Zone
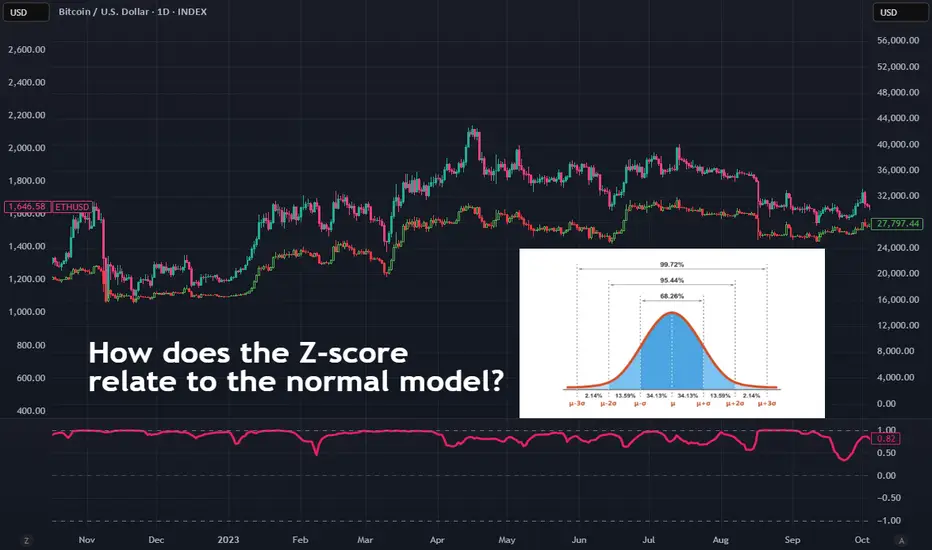
Normal ModelThis idea will cover the Normal Model and why its important to have in your toolbelt while exploring the world of cryptocurrency.
Core of the Normal Model.
Normal Model Build
The normal model or the normal distribution is a symmetric bell-shaped probability curve, its core is to measure the mean, median and mode these are located at the center of the distribution.
Normal Model Calculation
The model shows mean at the center.
-1σ / 1σ - (1 standard deviation) covers 68.2% of data.
-2σ / 2σ covers 95.4% of data.
-3σ / 3σ covers 99.7% of data.
This means that 1σ is 1 standard deviation above the mean, while -1σ is 1 standard deviation below the mean.
This applies to 1σ, 2σ, 3σ and -1σ, 2σ, 3σ.
Normal Model Use case
We will now provide an example using a unimodal normal distribution.
Example delivery time, we have a mean of 30 with a standard deviation of 5.
This tells us that.
68.2% of the times are between 25 - 35 mins. Which is -1σ / 1σ.
95.4% of the times are between 20 - 40 mins.Which is -2σ / 2σ.
99.7% of the times are between 15 - 45 mins. Which is -3σ / 3σ
We can now do a calculation with the formula Z = (X - μ) / σ Where X is the data point, μ is the mean, and σ is the standard deviation.
The formula above is the Z-score formula and its used to measure how far a data point is from its mean in terms of standard deviations.
Z-score
Z-score is very valuable to learn and understand and has several use cases. For example, it’s very useful when it comes to identifying outliers a high or low z-score would be unusual compared to the data. If the data follows a normal distribution, the z-score allows you to calculate the probability, helping you understand whether an outcome or value is rare or not.
Imagine you want to compare different crypto coins: Bitcoin gains a few percent while ETH gains 50%+. The z-score allows you to see which coin is moving more extremely relative to its usual volatility. This can be used to identify trends in the market that normal indicators might not be able to see or adjust your risk.
Normal Model / Correlation between assets.
Now that we understand how the Normal Model and Z-Score work, we can apply this knowledge to the markets. There are many use cases, but we’ll focus on the most reliable one: correlation between assets.
Let’s take BTC and ETH as an example. Your correlation indicator gives you a stream of values (e.g., between -1 and +1). We take the history of this indicator's values and treat this history as our normal distribution.
We then calculate the Z-Score for the current correlation value using the historical average and standard deviation of the indicator itself. This tells us if the current correlation is statistically unusual.
By using Z-Scores, we can spot when the correlation is unusually high or low compared to its historical average.
Use case of new knowledge.
If Z-Score is very high, BTC and ETH are moving together more than usual indicating a strong trend continuation.
If the Z-Score is very low, the coins are moving together less than usual could signal a potential reversal.
You can use the information above to adjust your approach manage risk and entries. Now you have more then just a correlation understanding but also a statistical perspective.
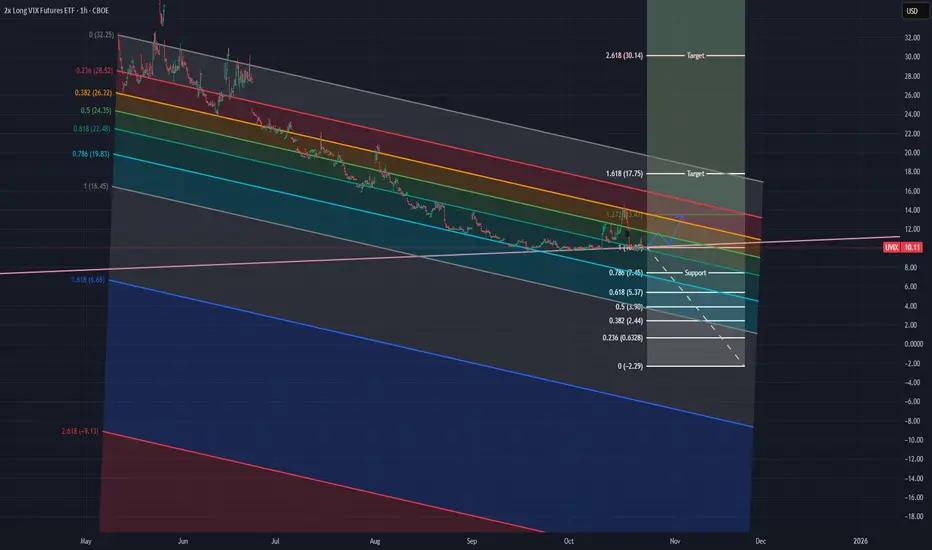
UVIX TargetsHello all,
I cooked up a way to find entries and exits on UVIX in the event of another volatility event, adjusted for decay. Let me know how I could improve the chart, I'm new to drawing diagonal fibs but thought I'd give it a shot.
x
Happy Trading!
NQ Power Range Report with FIB Ext - 10/23/2025 SessionCME_MINI:NQZ2025
- PR High: 25059.50
- PR Low: 25000.25
- NZ Spread: 132.25
Key scheduled economic events:
08:30 | Initial Jobless Claims
10:00 | Existing Home Sales
Session Open Stats (As of 12:15 AM)
- Session Open ATR: 396.82
- Volume: 31K
- Open Int: 281K
- Trend Grade: Long
- From BA ATH: -1.1% (Rounded)
Key Levels (Rounded - Think of these as ranges)
- Long: 26020
- Mid: 23571
- Short: 21939
Keep in mind this is not speculation or a prediction. Only a report of the Power Range with Fib extensions for target hunting. Do your DD! You determine your risk tolerance. You are fully capable of making your own decisions.
BA: Back Adjusted
BuZ/BeZ: Bull Zone / Bear Zone
NZ: Neutral Zone

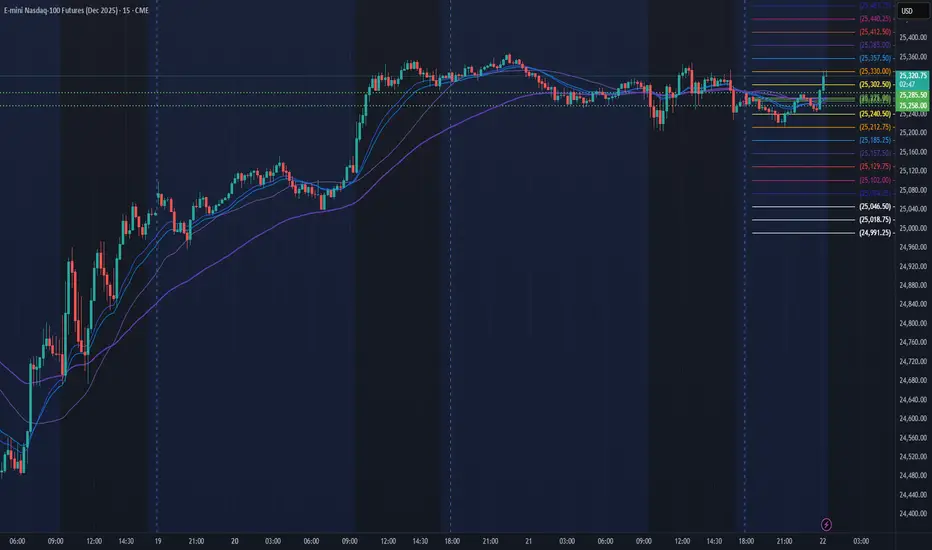
NQ Power Range Report with FIB Ext - 10/22/2025 SessionCME_MINI:NQZ2025
- PR High: 25285.50
- PR Low: 25257.75
- NZ Spread: 62.25
No key scheduled economic events
Quick dip and rotation back towards ATH
Session Open Stats (As of 12:15 AM)
- Session Open ATR: 385.15
- Volume: 24K
- Open Int: 290K
- Trend Grade: Long
- From BA ATH: -0.2% (Rounded)
Key Levels (Rounded - Think of these as ranges)
- Long: 26020
- Mid: 23571
- Short: 21939
Keep in mind this is not speculation or a prediction. Only a report of the Power Range with Fib extensions for target hunting. Do your DD! You determine your risk tolerance. You are fully capable of making your own decisions.
BA: Back Adjusted
BuZ/BeZ: Bull Zone / Bear Zone
NZ: Neutral Zone
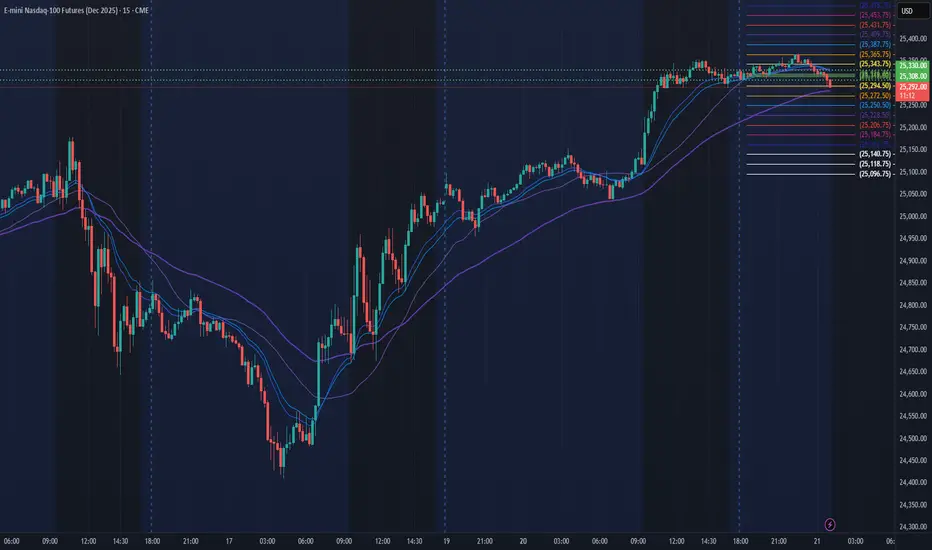
NQ Power Range Report with FIB Ext - 10/21/2025 SessionCME_MINI:NQZ2025
- PR High: 25330.00
- PR Low: 25308.00
- NZ Spread: 49.0
Re-approaching ATH
No key scheduled economic events
Session Open Stats (As of 12:35 AM)
- Session Open ATR: 398.28
- Volume: 21K
- Open Int: 292K
- Trend Grade: Long
- From BA ATH: -0.2% (Rounded)
Key Levels (Rounded - Think of these as ranges)
- Long: 26020
- Mid: 23571
- Short: 21939
Keep in mind this is not speculation or a prediction. Only a report of the Power Range with Fib extensions for target hunting. Do your DD! You determine your risk tolerance. You are fully capable of making your own decisions.
BA: Back Adjusted
BuZ/BeZ: Bull Zone / Bear Zone
NZ: Neutral Zone
Gold – Price Correction, or Price Reversal?Gold volatility picked up dramatically last week as concerns regarding the ability of regional US banks to absorb losses from bad loans jostled for position as the new reason for owning Gold as a safe haven hedge with escalating trade tensions between the US and China.
These drivers joined a growing list of problems supporting why traders and investors could be so focused on adding Gold, and other precious metals, to their portfolios including geo-political risks in Ukraine and the Middle East, unsustainable government debt levels in countries like the US, Japan, France and the UK, as well as the potential for more interest rate cuts from the Federal Reserve.
To showcase how volatility has increased, last week Gold traded from its Monday open at 4012 to a new record high on Friday of 4379, before reversing direction to close the week at 4247. Despite a 1.8% fall on Friday, it still posted a weekly gain of 5.8% and on the way registered its biggest ever weekly price gain in dollar terms (+$235). This type of movement could reflect the increased involvement of speculators in Gold, which can exaggerate price moves as they are quicker to enter and exit positions.
When considering trading Gold in this type of environment it could be worthwhile looking to reduce position sizes to account for bigger price swings and accommodate the need for wider stop loss and take profit parameters.
Keeping apprised of scheduled event risk can also be useful, for example, the release on Friday (1330 BST) of the delayed US CPI reading, which could influence whether Federal Reserve policymakers feel they are able to cut interest rates by 25bps (0.25%) at their meeting on October 29th.
Identifying and monitoring key technical levels and trends can also be important.
Technical Update: Price Correction, or Price Reversal?
From the August 20th low into Friday’s new all-time high, Gold has risen an impressive 32.25%, reflecting a sustained uptrend. As illustrated in the chart below, corrections during this phase of strength have been brief, typically lasting just one session, with only a single instance of a two-day pullback (marked by the red candles). Each dip has consistently attracted fresh support, helping prices post successive highs and reinforcing the strength of the underlying upside momentum.
This recent activity underscores the positive sentiment behind Gold, despite traditional indicators having signalled stretched upside conditions for some time.
Notably, Bollinger bands continue to reflect a positive technical backdrop, with the mid-average rising, price action touching the upper band, and the bands widening, a sign of increasing price volatility and upward momentum.
Friday’s pullback following the new all-time high at 4379 may be sparking fresh debate among traders, whether this is just another brief correction, as seen during the current uptrend, or the start of a more extended phase of weakness.
Historically, similar dips have quickly attracted support, but upcoming sessions may prove pivotal in determining whether upside momentum can resume or if a period of deeper consolidation is on the horizon.
In this type of environment it may be prudent to establish potentially relevant support and resistance levels to monitor that could have an impact on the direction of Gold prices.
Potential Support Levels:
Price corrections following strong advances are a typical market response to short-term upside overextension, and Gold may well be entering such a phase. Traders could now focus on 4165 as the first key support, which is the 38.2% Fibonacci retracement of the October strength. This level holding if price weakness is seen, could stabilise sentiment, while a closing break lower may lead to a deeper pullback.
A closing break below 4165 wouldn’t necessarily signal a shift in downside sentiment, but it could open tests of 4099, the 50% Fibonacci retracement, even towards 4033, a level equal to the deeper 61.8% level.
Potential Resistance Levels:
Having stalled on Friday at the 4379 level it is possible this now marks initial resistance for the coming week. If the uptrend pattern from the August 20th low is to persist, a close above 4379 may lead to a more extended phase of price strength.
While not a guarantee of higher price levels, successful closes above 4379 may open scope toward 4416, the 238.2% Fibonacci extension, and if this gives way on towards 4506, which is equal to the 261.8% extension.
The material provided here has not been prepared accordance with legal requirements designed to promote the independence of investment research and as such is considered to be a marketing communication. Whilst it is not subject to any prohibition on dealing ahead of the dissemination of investment research, we will not seek to take any advantage before providing it to our clients.
Pepperstone doesn’t represent that the material provided here is accurate, current or complete, and therefore shouldn’t be relied upon as such. The information, whether from a third party or not, isn’t to be considered as a recommendation; or an offer to buy or sell; or the solicitation of an offer to buy or sell any security, financial product or instrument; or to participate in any particular trading strategy. It does not take into account readers’ financial situation or investment objectives. We advise any readers of this content to seek their own advice. Without the approval of Pepperstone, reproduction or redistribution of this information isn’t permitted.
