SEAMEC LTD - Weekly Falling Trendline Breakout📊 SEAMEC LTD – Weekly Falling Trendline Breakout Attempt 🚀
📅 Updated: Dec 03, 2025 | ⏱️ Timeframe: 1W
CMP: ₹987.85 (+2.81%)
Ticker: NSE:SEAMECLTD
🔍 Technical Overview
SEAMEC is showing strong bullish momentum on the weekly timeframe, attempting a breakout above a 1.5-year falling trendline drawn from 2024 highs.
A strong base formation is also visible:
🟦 Demand Zone (Support Block): ₹830–₹870
Price has respected this demand zone multiple times, creating a rounded accumulation base.
📈 Current Move:
Breakout candle touching the trendline
Higher lows forming since August 2025
Volume expansion on recent bullish candles indicating accumulation
A confirmed breakout above the falling trendline could mark the beginning of a fresh medium-term uptrend.
🎯 Chart Summary
SEAMEC is showing signs of reversing its prolonged downtrend.
Breakout confirmation above ₹1,030 may open the path toward:
🎯 Targets:
₹1,120 (supply zone)
₹1,210 (swing high)
A close above the trendline with volume would validate the reversal.
⚠️ Disclaimer
This analysis is for educational and chart-study purposes only. Not financial advice. Always do your own research before trading.
Volumeanalysis

BTC Take OFF for a BUYNow at this time we are little late to take buy entry but we have still opperunity for BUY . Price Down at 93518.15 and we find a buy conformation in any 5,3 and 1M time ,other details I share in chart where price gone

RTY: Small Caps Stuck Between Growth Optimism & Macro OutlookRTY Overview and Recent Macro Backdrop
RTY, or Russell 2000 futures, track the performance of the Russell 2000 Index, which represents approximately two thousand U.S. small cap companies. These constituents are drawn from the lower end of the Russell 3000 Index and typically reflect firms with smaller market capitalizations, greater domestic revenue exposure, and higher sensitivity to economic conditions than their large cap peers. The primary deciding factor for inclusion in RTY versus the S&P 500 is market capitalization. The Russell 2000 consists of the smallest two thousand companies within the Russell 3000, while the S&P 500 is a committee selected index composed of roughly five hundred large cap companies that must meet additional criteria such as profitability, liquidity, sector balance, and sustained earnings. Although market cap thresholds shift annually, Russell 2000 constituents generally fall well below the market cap range of S&P 500 companies and are reconstituted mechanically each year based on size rankings.
As the market settles into the new year, RTY has been trading within a more nuanced macro environment shaped by early year repositioning and reassessment of economic expectations. Price action over the past month has been increasingly influenced by evolving views on monetary policy, credit conditions, and the durability of U.S. growth. While recent inflation data has shown signs of moderation, it has remained uneven, keeping rate cut expectations fluid rather than fully priced in. This has limited sustained directional momentum in small caps, as higher borrowing costs continue to pressure balance sheets and earnings visibility. At the same time, resilient employment data and stable consumer demand have helped contain downside risk, allowing buyers to engage at value rather than chase extension. The result has been a rotational and range bound market structure, reflecting cautious positioning and a wait and see approach, with RTY acting as a battleground between early year growth optimism and ongoing policy and financing constraints.
What the Market has done
• Market reversed higher and entered an uptrend after concerns surrounding Trump’s liberation day tariffs eased in April 2025.
• In July 2025, the market consolidated and formed bid block 1, which buyers used as a base to drive price higher toward the 2585 area, a key daily resistance established in 2021 and the 2024 yearly high.
• Sellers responded at the 2585 area and offered prices back down toward the 2440 area, aligning with daily support and the 24 Nov weekly HVN.
• Buyers attempted to defend the 2440 area but failed, resulting in a downside auction to the 2320 area, corresponding to the bid block 1 high.
• Buyers defended and initiated at the 2320 area, bidding prices back up to the 2585 area, where sellers remained active.
• Markets have since rotated between the 2585 and 2490 areas.
What to expect in the coming week
The key level to monitor is the 48650 area, which aligns with the previous week’s VPOC and the 15 December weekly Value Area High
Bullish scenario
• If the market is able to hold above the previous week’s settlement, an initial move toward the 2555 area is expected, which aligns with the 22 Dec weekly VAL, the 3 Dec weekly VAH, and the 0.5 weekly SD high.
• If price is able to accept above the 2555 area, continuation toward the 2585 area becomes likely.
• Sellers are expected to respond around the 2585 area based on prior failed auctions and higher timeframe resistance.
• If sellers fail to gain control, the market could extend higher toward the 2620 area, which marks the 8 Dec weekly high.
Neutral scenario
• In the absence of a major news or data catalyst, the market may continue to auction two ways
• A rotational consolidation between the 2490 and 2555 areas would signal continued balance and acceptance of value within this range.
Bearish scenario
• If buyers are unable to defend and hold the 2490 area, expect a move down toward the 2460 area, which aligns with the 1 weekly SD high.
• Continued selling pressure could cause markets to auction prices further down to the 2440 area, which remains a key daily support and the 24 Nov weekly HVN.
Conclusion
In conclusion, RTY remains in a balanced yet highly responsive state, with higher timeframe reference levels clearly defended and defended by both buyers and sellers. The 2490 area is the line in the sand for the coming week, and traders should remain flexible and responsive to acceptance or rejection around this zone. As always, patience and execution around key levels will matter more than prediction.
If you found this breakdown useful, feel free to give a boost, comment, or share your own levels and scenarios below.
Disclaimer: This is not financial advice. Analysis is for educational purposes only; trade your own plan and manage risk.

ORIENT CERATECH LTD - WEEKLY TRENDLINE BREAKOUT📊 ORIENT CERATECH LTD – Weekly Trendline Breakout Attempt 🔥
📅 Date: Jan 01, 2026
⏱️ Timeframe: 1W
💰 CMP: ₹52.51 (+21.64%)
📌 Exchange: NSE
🔍 Technical Structure Overview
Orient Ceratech has been trading under a long-term descending trendline, forming a broad consolidation / corrective phase after its previous rally.
Recent price action shows strong bullish momentum, with a high-volume bullish candle attempting to break above the falling trendline — a classic early sign of trend reversal.
This move becomes technically significant as it occurs after:
Higher lows formation
Demand stepping in near ₹32–35 zone
Strong weekly close near highs
🎯 Possible Scenarios
✅ Bullish Case:
Weekly close above ₹56
Retest and hold of breakout level
Targets: ₹65 → ₹72 → ₹80
⚠️ Caution Case:
Rejection near trendline
Sideways consolidation between ₹46–56
📌 Chart Summary
Orient Ceratech is at a critical inflection point on the weekly timeframe.
The stock is showing early trend reversal signals, supported by strong volume and price expansion. A confirmed breakout could open doors for a fresh medium-term uptrend.
⚠️ Disclaimer
This analysis is for educational purposes only. Not financial advice.

ICICIPRULI–Short-Term Breakout.Mid & Long-Term Technical OutlookICICIPRULI – Multi-Timeframe Technical View
Daily Timeframe | Long-Term Perspective
ICICIPRULI is trading within a well-defined structure and continues to move inside a clear parallel channel, reflecting a healthy long-term trend.
The stock has a strong long-term support zone near 590–610, where:
Volume expanded significantly
Price showed a clear reversal from support
Historically, the stock has delivered returns of ~60% and ~34% from similar structures.
If price action repeats this nature, a long-term upside toward 780 and 940 remains a strong possibility.
Mid-Term View | Structure & Pattern
On the mid-term timeframe, the stock previously formed a falling wedge near the support zone, indicating accumulation.
Post that, ICICIPRULI appears to be developing an ascending broadening formation, suggesting expanding momentum.
Key Levels:
Support: 620–630
Short- to Mid-term Resistance / Target: 680–700

BTC/USD CHART ANALYSIS I 12/311. Price Structure & Trend
Symmetrical Triangle Pattern: The price is currently compressing tightly within a triangle formed by a descending trendline from above and an ascending trendline from below.
Current State: Trading at 88,428, the price is sitting right at the upper boundary of the triangle and the VAH resistance. This is a high-tension zone, signaling an imminent breakout.
2. Volume Profile Analysis
Liquidity zones are clearly defined on the chart:
VAH Zone (88,506): This is the "Value Area High." The price is currently reacting here. A decisive break above this level would mean BTC has exited its accumulation phase, likely heading toward 90,000+.
POC Zone (87,314): The "Point of Control" (highest volume) sits below current prices. This acts as a primary magnet and support floor; if a correction occurs, buyers are expected to step in here.
VAL Zone (86,933): The "Value Area Low" serves as the final line of defense for the current bullish structure.
3. Potential Scenarios
Bullish Breakout: If an hourly candle closes firmly above 88,500 and the descending trendline, the uptrend is confirmed. Short-term targets would be the previous highs around 90,000 - 90,400.
Rejection/Correction: If the price fails to break the VAH and drops below the ascending trendline, it will likely seek liquidity at the POC (87,314) before making its next move.
💡 Tactical Summary:
The market is in a "Wait for Confirmation" state.
Bulls: Have a slight edge as they continue to maintain higher lows (the rising trendline).
Bears: Are putting up a strong fight to defend the 88,500 psychological level.
Strategy: It is best to wait for a clear candle close outside of the triangle. Entering exactly at the "apex" (the tip) of the triangle carries a high risk of being caught in a "fakeout" or stop-loss hunt.

CLBT | This Software Tech Stock Will Rise | LONGCellebrite DI Ltd. engages in the provision of digital investigative solutions for the public and private sectors, empowering organizations in mastering the complexities of legally sanctioned digital investigations by streamlining intelligence processes. Its services include training and advisory, value realization, advanced services, and technical customer support. The firm also offers software solutions and analytic tools designed to accelerate digital investigations and address the growing complexity of handling crime and security challenges in the digital era. The company was founded on April 13, 1999 and is headquartered in Petach Tikva, Israel.

SLV | Next Leg Higher Is Here | LONGiShares Silver Trust seeks to reflect generally the performance of the price of silver. The Trust seeks to reflect such performance before payment of the Trust's expenses and liabilities. It is not actively managed. The Trust does not engage in any activities designed to obtain a profit from, or to ameliorate losses caused by, changes in the price of silver.

IE | Copper Companies Are Going Parabolic Soon | LONGIvanhoe Electric, Inc. is a minerals exploration and development company which focuses on developing mines from mineral deposits. Its projects include Santa Cruz Copper and Tintic Copper-Gold Projects. It operates through the following segments: Santa Cruz Project, Critical Metals, Data Processing, and Energy Storage. The Santa Cruz Project and Critical Metals segment handles mineral project exploration and development with a focus on identifying and developing mineral projects, and ultimately mines, associated with the metals necessary for electrification. The Data Processing segment provides data analytics, geophysical modeling, and artificial intelligence services for mineral, oil and gas, and water exploration industries. The Energy Storage segment develops, manufactures, and installs vanadium flow batteries for grid-scale energy storage. The company was founded on July 14, 2020 and is headquartered in Tempe, AZ.

EUR/USD: Sellers Defending Value — Breakdown or Continuation HigEUR/USD is showing clear seller presence after a strong rejection at the HVN, confirming that this area remains a key supply zone.
However, price is still holding above the dynamic support, suggesting that the next move will be decided by whether this level breaks or attracts fresh buyers.
📊 What the chart is telling us:
HVN rejection → sellers active at value
A break below the support area could trigger strong momentum toward 1.1540
👉 What’s your take — support breakdown and continuation lower, or buyers step in for another push higher?
Based on:
- Fundamental analysis
- HVN & Volume Profile levels
- Quantitative analysis

EURGBP – Bearish Momentum Approaching Reversal Zone📊 EURGBP – H1 Market Structure, Supply Breakdown & Volume-Based Reversal Setup
🔍 Technical Analysis
EURGBP on the 1-hour timeframe is currently trading in a clear bearish environment. The pair has transitioned from consolidation into a strong impulsive sell-off, signaling increasing dominance from sellers. The chart highlights a key breakdown from supply, followed by aggressive momentum toward a high-interest demand area.
📉 Market Structure & Momentum
Price respected a descending structure, forming lower highs and lower lows.
A previous internal consolidation range failed to hold, confirming bearish continuation.
The sharp bearish candles reflect strong order flow imbalance, suggesting institutional participation rather than retail-driven movement.
🟥 Broken Supply (BR Supply)
The marked BR Supply level acted as a strong resistance in the past.
Once price broke below this level, it confirmed a market structure break (MSB).
After the breakdown, price used this area as a distribution zone, accelerating further downside.
This validates the level as a key decision point in the trend.
🟩 Demand Zone with Volume Burst (Lower Area)
The lower green zone represents a high-probability demand and volume burst area.
Historically, this zone shows strong buying reactions, indicating accumulation.
The presence of a Volume Burst suggests liquidity absorption and potential exhaustion of sellers.
This is a zone where reversal or corrective pullback becomes technically valid.
🔄 Reversal Zone & Pattern Expectation
The highlighted Reversal Zone is not a blind entry area.
A clear bullish pattern must form (e.g., strong rejection wicks, bullish engulfing, or shift in structure).
Without confirmation, price may continue lower due to prevailing bearish pressure.
The annotation “Pattern Must” emphasizes confirmation over anticipation.
🧠 Trading Scenarios
Scenario 1 – Bullish Reaction (Corrective Move):
If buyers step in with volume confirmation, price may react upward toward broken structure.
This move would likely be a pullback within a broader bearish trend, not an immediate trend reversal.
Scenario 2 – Bearish Continuation:
Failure to hold the demand zone could lead to continued downside, targeting deeper liquidity pools.
Strong bearish closes below the zone invalidate reversal expectations.
📌 Key Levels to Watch
Resistance: Broken Supply / Prior Structure
Support: Volume Burst Demand & Reversal Zone
Bias: Bearish overall, cautious bullish reaction only with confirmation
💡 Trading Insight
Trend is bearish; counter-trend trades require patience and confirmation.
Volume behavior at key zones gives better insight than indicators alone.
Trade reaction, not prediction.

Gold (XAUUSD) Bullish Continuation After Demand Zone Retest📊 Gold (XAUUSD) – 30-Minute Chart | Detailed Technical Analysis
This chart shows Gold Spot / U.S. Dollar (XAUUSD) on the 30-minute timeframe, and it highlights a very important phase of post-impulse consolidation and potential continuation.
🔹 Market Structure Overview
Gold has recently shown strong bullish momentum, visible through a sequence of large bullish candles with expanding bodies. This impulsive move suggests strong institutional participation, confirmed by the volume burst marked on the chart.
After this aggressive rally, price entered a corrective phase, forming a short-term pullback with smaller bearish candles. This behavior is healthy and typical after a strong push, indicating profit-taking rather than trend reversal.
🔹 Key Zone: Demand / Support Area
The highlighted green zone represents a demand area, created after the strong bullish expansion. This zone is important because:
It aligns with the origin of the impulsive move
It shows high trading volume, signaling strong buying interest
Price is expected to retest this area before continuation
The chart clearly labels this phase as “Retesting”, which means price may dip into this zone to absorb liquidity and attract buyers.
🔹 Price Action & Pattern Expectations
At the moment, price is hovering above the demand zone, but the idea emphasizes:
Patience is required
A clear bullish pattern (such as bullish engulfing, pin bar, or strong rejection) should form inside or near the zone
Only after confirmation, buy-side opportunities become valid
The note “Need Pattern And Buy Side” reinforces the importance of waiting for price action confirmation, not blindly entering trades.
🔹 Bullish Projection
The upward arrow drawn on the chart represents a bullish continuation scenario:
After a successful retest
Followed by strong bullish confirmation
Price may resume its upward trajectory toward higher resistance levels
This projection aligns with the overall bullish market structure unless the demand zone is clearly broken with strong bearish volume.
🔹 Trading Psychology Insight
This setup favors smart money logic:
Impulse → Pullback → Retest → Continuation
Traders who wait for confirmation inside high-probability zones often achieve better risk-to-reward trades and avoid emotional entries.
🧠 Final Thoughts
Trend bias: Bullish
Key focus: Demand zone retest
Entry style: Confirmation-based buying
Risk management: Essential if demand zone fails
This chart represents a professional, rule-based trading idea, emphasizing patience, structure, and volume rather than aggressive chasing.

How To Plan Trend-Line Breakout TradeThis video explains how a trend-line breakout develops and how to plan a trade around it using market structure and price behavior. The discussion focuses on identifying a valid trend-line, understanding breakout conditions, observing confirmation and follow-through, and planning a structured approach based on logic rather than emotions.
The objective of this video is to help understand the process behind trend-line breakouts and how trade planning can be approached from a price-action perspective, purely for learning and awareness—without providing any trading or investment recommendations.

Structure Holds as LPS Reload LoomsCMW is shaping up well with a clean structural setup. Price action suggests we may be in the process of forming another Last Point of Support or Backup.
Trade Scenario
If price continues to pull back, monitor the highlighted zones for a potential entry. Since we do not yet have a confirmed higher low, the initial stop loss should be placed at the $0.330 low.
Risk management is critical here—avoid overexposure until structure confirms. If a higher low forms as outlined on the chart, the stop can be adjusted to that level.
That said, we are also working with a Gann fourth time breakout. This means price may not pull back immediately. If it breaks above the local high at $0.50, traders can look to the daily timeframe for a clean continuation setup toward the $0.57 zone.
As always, keep it simple and let structure lead. Risk management is the foundation—protect capital first, then let the trade work.

Swing/Posistiong Idea On Coffee(KC1!)Based on :
- Supply zone and VP Key levels
- Seasonality
- overbought conditions
- AVWAP and VP as potential targets

Avanti Feeds Ltd – Breakout Watch
📌 Buy Zone: ₹856
🎯 Target: ₹935
🛑 Stoploss: ₹812
Price action is testing a descending trendline on the daily chart. Volume spike and RSI momentum suggest a potential breakout. Risk-managed entry near ₹856 could offer a favorable reward-to-risk setup.
🔍 Disclaimer: For educational purposes only. Not SEBI registered. Do your own research before investing.

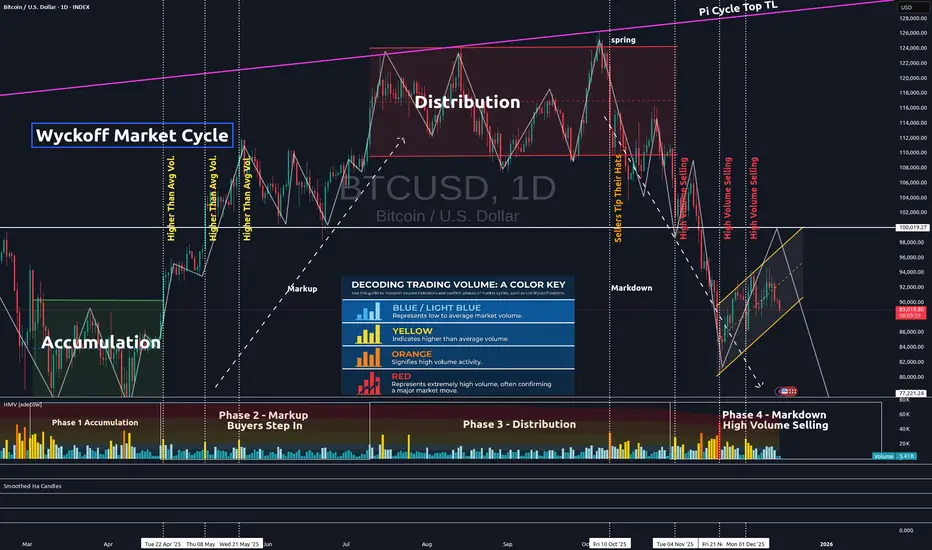
Confirming Chart Patterns With VolumeIn the chart above, one can clearly recognize the Wyckoff Market Cycle pattern. The pattern's legitimacy can be confirmed by volume. The volume is represented in the lower portion of the chart.
Low to average volume candles are blue. Average volume is indicated by light blue candles. Yellow candles represent higher than average volume. Orange is high volume. And red represents extremely high volume.
You will see each phase of the Wyckoff Market Cycle pattern confirmed by this volume on our current Bitcoin chart.
First, the market enters the accumulation phase. Market volume is fairly high, as seen in the accumulation quadrant in the lower left on the chart. However, it is important to note that there is an equal distribution of high-volume selling days as there are high-volume buying days. Thus, price tends to trend sideways within the channel until the true buying power comes into action.
Next, the buyers step in and take the price higher. This is generally indicated by a high-volume day when the price breaks above the accumulation channel. When buyers step in, most of the yellow and orange volume candles are, in fact, buyers in the markup phase. You can verify this is true by lining these higher-than-average volume candles up with the green price candles on the Bitcoin chart. This indicates the markup phase has begun and is underway.
Then, we come to the distribution phase on our chart. Notice the volume in that 3rd quadrant, the distribution quadrant. It is mostly average volume. Institutional sellers are attempting to carefully exit quietly. But you can also see that near the end of the distribution phase, sellers are starting to step in, tipping their hats and indicating that the distribution phase is about to end.
Finally, sellers take back full control, dropping us from the distribution channel altogether. High volume selling confirms this move and the pattern. The final quadrant in the bottom right proves that mostly sellers have control, as the majority of higher volume candles (yellow, orange, and red) are credited to the sellers.
Our Wyckoff Market Cycle pattern is now confirmed, and further selling can be expected until volume is once again taken back by the buyers. One will need to see clearly that high-volume candles are in line with green price candles. In this chart, that is not yet the case. Thus, more selling should be expected until it is clearly evident that buyer command control once again.
Hope you found this brief educational write-up informative and helpful, as volume can often be utilized in many uncertain pattern formations to find pattern legitimacy and confirmation.
✌️Stew
EURAUD 1D Analysis - Demand Zone + Bullish Continuation 📊 EURAUD – Detailed Price Action Analysis (Reversal Context)
This chart highlights EURAUD price behavior around a higher-timeframe demand zone, where selling pressure has slowed and a bullish reaction is already visible. The analysis focuses on market structure, volume reaction, and confirmation-based continuation rather than prediction.
🔍 Higher-Timeframe Context
Price has been trading in a broad range for several months, respecting clear highs and lows.
Recent price action shows a strong bearish leg pushing into a previously respected demand area.
This area has historically acted as support, making it a high-probability reaction zone.
📉 Bearish Push & Exhaustion
The most recent down-move is impulsive, suggesting liquidity targeting below recent swing lows.
Sellers pushed price aggressively into the lower range, triggering:
Stop-losses
Late sellers entering at discount
This behavior often precedes temporary exhaustion.
🟩 Reversal Zone + Volume Burst
The highlighted Reversal Zone marks a high-interest demand area.
A volume burst occurred at this level, signaling:
Absorption of sell orders
Potential smart money participation
Price responded immediately with bullish candles, confirming buyer presence.
📌 Note: The chart clearly shows “Pattern Already Comes”, meaning the initial confirmation has already formed.
🔄 Market Structure Shift (Early Signs)
Short-term structure shows:
Higher low formation
Strong bullish rejection from the zone
While this does not yet confirm a full trend reversal, it strongly supports a corrective upside move.
📈 Bullish Continuation Scenario
If price continues to hold above the reversal zone:
Expect a pullback-and-continuation structure
Upside targets may include:
Previous internal highs
Range equilibrium
Upper resistance zones if momentum sustains
This scenario favors buy-on-pullback strategies, not chasing.
📉 Failure Scenario
If price breaks cleanly below the demand zone:
Bullish bias is invalidated
Expect continuation toward deeper range lows
This reinforces the importance of risk management and confirmation
🧠 Trading Insight
This setup emphasizes:
Letting price confirm intention
Trading reaction, not anticipation
Respecting zones where volume and structure align
Patience remains the edge.

High Probability Setups: Divergence in Price and VolumePrice defines direction, but volume defines participation. High probability setups emerge when both align. When they separate, conditions change. Divergence between price and volume is one of the clearest tools for assessing whether a move is supported by real commitment or driven by diminishing participation.
In strong market conditions, impulsive price movements are accompanied by stable or increasing volume. This shows that traders are actively committing capital in the direction of the move. Pullbacks during these phases typically show reduced volume, confirming that counter-moves are corrective rather than a shift in control. This alignment between price expansion and volume participation supports continuation.
Divergence forms when price continues to extend while volume contracts. The market is still moving, but fewer participants are involved. This shift indicates that momentum is weakening beneath the surface. The move becomes more fragile, and continuation requires increasingly less resistance to fail. These conditions often develop before structural changes become visible on price alone.
The relevance of divergence increases at key locations. When price reaches major highs or lows, premium or discount zones, or obvious liquidity pools, declining volume signals absorption. Orders are being filled without follow-through. Late participants provide liquidity rather than fuel. This explains why many apparent breakouts stall or reverse shortly after forming.
Volume behaviour also clarifies breakout quality. Breaks that occur with low or declining volume often lack acceptance. Price may move beyond a level, but without participation the market struggles to sustain the new range. When price quickly re-enters the prior structure, divergence explains the failure before structural confirmation appears.
During consolidation phases, volume provides insight into preparation. Falling volume reflects compression and balance. Rising volume within a range reflects active engagement and positioning. Divergence during these phases often precedes resolution, especially when combined with liquidity interaction at range boundaries.
High probability setups form when divergence aligns with location and structure. Volume refines what price presents. It helps identify whether a move is being supported, absorbed, or exhausted. Reading this relationship consistently improves timing, reduces false entries, and keeps execution aligned with real market participation rather than surface-level movement.

PLUS | AI Related Software Apps Will Rise | LONGePlus, Inc. engages in the provision of information technology (IT) solutions that enable organizations to optimize their IT environment and supply chain processes in the United States. It operates through the Technology and Financing segments. The Technology segment offers hardware, perpetual and subscription software, maintenance, software assurance, and internally provides outsourced services and advanced professional and managed services, including ePlus managed, professional, security, staff augmentation, server and desktop support, and project management services. The Financing segment specializes in arrangements, such as direct financing, sales-type, and operating leases, loans and consumption-based financing arrangements, and underwriting and management of IT equipment and assets. Its financing operations consist of sales, pricing, credit, contracts, accounting, risk management, and asset management. This segment primarily finances IT equipment, communication-related equipment, medical equipment, industrial machinery equipment, office furniture and general office equipment, transportation equipment, and other general business equipment directly, as well as through vendors. The company was founded by Bruce M. Bowen in 1990 and is headquartered in Herndon, VA.

APP | New ALL TIME HIGHS Incoming | LONGAppLovin Corp. engages in the development and operation of a mobile marketing platform. It offers AppDiscovery, MAX, Adjust, and SparkLabs. Its software-based platform caters to mobile application developers to improve the marketing and monetization of applications. The company was founded by Andrew Karam, John Krystynak, and Adam Foroughi in 2011 and is headquartered in Palo Alto, CA.t represents results from other non-reportable segments and corporate-related charges. The company was founded by Robert Norton Noyce and Gordon Earle Moore on July 18, 1968 and is headquartered in Santa Clara, CA.

INTC | Intel is Going To Pop In The Future | LONGIntel Corp. engages in the design, manufacture, and sale of computer products and technologies. It delivers computer, networking, data storage, and communications platforms. The firm operates through the following segments: Client Computing Group (CCG), Data Center and AI (DCAI), Network and Edge (NEX), Mobileye, Accelerated Computing Systems and Graphics (AXG), Intel Foundry Services (IFS), and All Other. The CCG segment consists of platforms designed for notebooks, 2-in-1 systems, desktops, tablets, phones, wireless and wired connectivity products, and mobile communication components. The DCAI segment delivers solutions to cloud service providers and enterprise customers, along with silicon devices for communications service providers and high-performance computing customers. The NEX segment offers computing system solutions from inflexible fixed-function hardware to general-purpose compute, acceleration, and networking devices running cloud native software on programmable hardware. The Mobileye segment develops driving assistance and self-driving solutions. The AXG segment provides products and technologies designed to help customers solve the toughest computational problems. Its products include CPUs for high-performance computing and GPUs targeted for a range of workloads and platforms, from gaming and content creation on client devices to delivering media and gaming in the cloud, and the most demanding high-performance computing and AI workloads on supercomputers. The IFS segment refers to full stack solutions created from the foundry industry ecosystem. The All Other segment represents results from other non-reportable segments and corporate-related charges. The company was founded by Robert Norton Noyce and Gordon Earle Moore on July 18, 1968 and is headquartered in Santa Clara, CA.

High R/R Opportunity from Key ZonesPrice has recently rallied into a key supply zone, so a reaction or rejection from this level is expected. While the projected path favors continuation, it's crucial to monitor the $0.320 support area. If we see a strong weekly bullish hammer-style candle with a solid close into this zone, that would trigger a long entry.
If price fails to hold $0.320, attention shifts to the $0.290–$0.270 range, which should act as a deeper support zone. From either level, the upside target remains $0.430, offering a compelling risk-to-reward profile for a staggered entry strategy.
