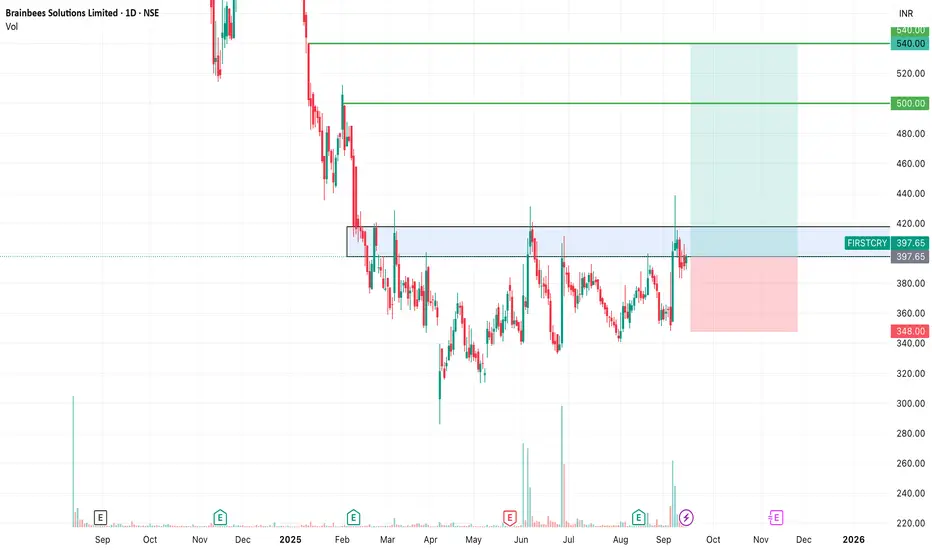
SWING IDEA - FIRSTCRY (BRAINBEES SOLUTIONS LTD)FirstCry (Brainbees Solutions) , a leading omni-channel retailer for baby and kids’ products, is showing signs of a potential breakout, presenting a strong swing trading opportunity.
Reasons are listed below :
400 resistance zone tested multiple times — now looking ready for a breakout
Attempting to break out of a 7+ month consolidation phase
Volume spikes suggest accumulation by smart money
Golden Fibonacci retracement support in play
Price action forming higher highs, confirming bullish structure
Target - 500 // 540
Stoploss - daily close below 348
DISCLAIMER -
Decisions to buy, sell, hold or trade in securities, commodities and other investments involve risk and are best made based on the advice of qualified financial professionals. Any trading in securities or other investments involves a risk of substantial losses. The practice of "Day Trading" involves particularly high risks and can cause you to lose substantial sums of money. Before undertaking any trading program, you should consult a qualified financial professional. Please consider carefully whether such trading is suitable for you in light of your financial condition and ability to bear financial risks. Under no circumstances shall we be liable for any loss or damage you or anyone else incurs as a result of any trading or investment activity that you or anyone else engages in based on any information or material you receive through TradingView or our services.
@visionary.growth.insights
Volumeanalysis
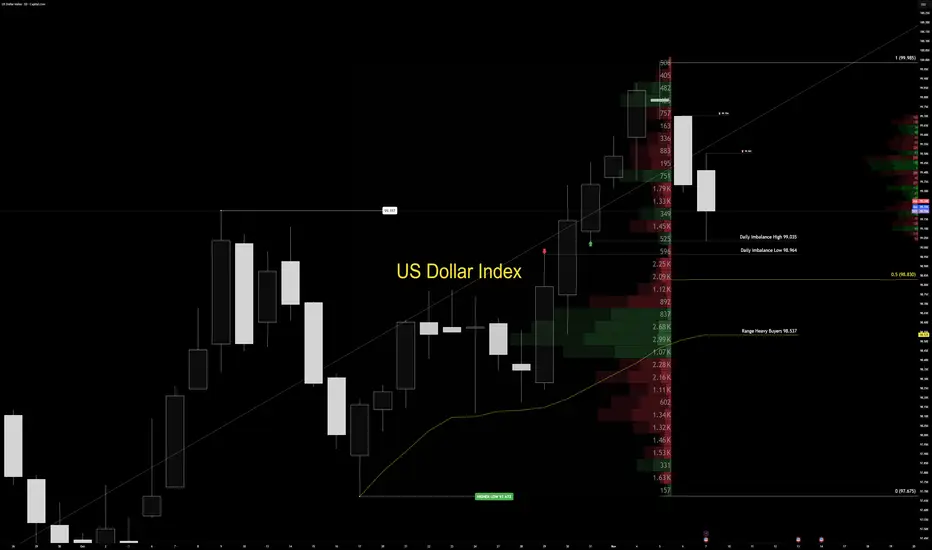
Sunday Dollar War Map | Week Ahead — DXY Structure OutlookThe US Dollar Index (DXY) continues to trade within a controlled bullish range, holding the upper half of its daily structure between 97.675 (range low) and 99.985 (range high). Price remains anchored inside premium territory, with a daily imbalance cap defined between 99.035 (high) and 98.964 (low).
Volume delta stays concentrated deep in the discount zone near 98.537, showing that institutional participation remains limited. Early in the week, price may probe deeper into that imbalance cap to trigger larger positioning before any directional expansion. Until confirmed volume steps in, the tactical stance remains clear: observe, don’t predict. Professionals wait for conviction — amateurs try to guess it.
The active order flow imbalance remains unfilled, and price typically reacts once single prints inside that imbalance get touched. However, the heavy volume concentration across the lower half of the range deserves attention — trading directly into the cap often causes reactive blowback. That’s not random; it’s how market maker logic plays out through volume flow behavior.
On the macro side, US yields continue to climb as investors demand higher compensation for duration risk. The 10-year Treasury yield hovers near 4.1%, while the 30-year sits close to 4.7%. Meanwhile, fiscal pressure continues to build — record government debt and renewed shutdown risks are keeping confidence fragile.
The outcome is a balancing act: rising yields support the dollar in the short term, while long-term credibility remains under pressure. For now, the dollar holds its ground — but each move is conditional.
Professionals trade participation, not prediction. The market doesn’t reward speed — it rewards confirmation. Let the tape show its hand before you show yours. Structure speaks first. Volume decides who listens.
— Institutional Logic. Modern Technology. Real Freedom.
BTI | Expect More Smokers in a Recession | LONGBritish American Tobacco plc is a holding company, which engages in the manufacture and distribution of tobacco products. Its brands include Kent, Dunhill, Lucky Strike, and Pall Mall. It operates through the following geographical segments: United States, Asia-Pacific and Middle East (APME), Americas and Sub-Saharan Africa (AMSSA), and Europe and North Africa (ENA). The APME geographical segment consists of markets in the Middle East merged with Asia-Pacific. The AMSSA geographical segment is composed of markets in East and Central Africa, West Africa, and Southern Africa merged with the Americas region. The ENA geographical segment includes markets in Russia, Ukraine, Caucasus, Central Asia, Belarus, Turkey, and North Africa merged with the Western Europe region. The company was founded by James Buchanan Duke on September 29, 1902 and is headquartered in London, the United Kingdom.

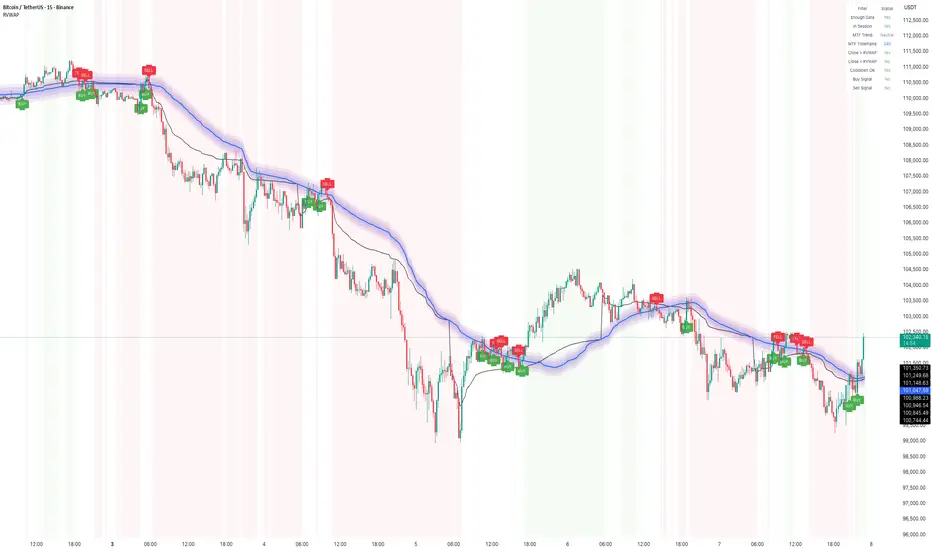
How to Use Rolling VWAP – Early US Session Trend TrackerIn today’s BTC/USDT 15-min chart, the Rolling VWAP perfectly captured the directional bias throughout the session.
The smooth transition between compression and expansion phases clearly aligned with VWAP slope shifts — giving multiple early signals during the US market open, when volatility tends to expand sharply.
Performance Highlights
• The indicator tracked clean trend waves with minimal lag, showing how price respected the VWAP envelope dynamically.
• BUY and SELL zones were well-defined, with fading reversals quickly replaced by trend-aligned setups.
• Session filter (US Market) ensured signals appeared primarily during active volatility windows, avoiding false setups during low-volume hours.
• The rolling nature of VWAP (instead of session-based VWAP) allowed continuous trend capture across intraday transitions.
Additional Notes
1. Cooldown Setting:
Currently set to 1 candle — which makes the chart more responsive but slightly denser with signals.
Increasing it (e.g., to 3–5 bars) can make the chart cleaner, though some reversal entries may not display visually even though they’re logically detected.
2. US Session Filter:
The logic focuses on the early US market phase, effectively capturing directional bursts when liquidity and volatility spike — ideal for short-term scalping or trend continuation setups.
⸻
🧠 Tip:
Combine the Rolling VWAP bias with higher-timeframe structure (e.g., 1H trend) for even more reliable directional trades.
BTCUSD — NY Session🧭 Market Context
Bitcoin just hit 100,966, a key weekly volume level.
This is where big players make their move — either defend or break it.
Right now, patience matters more than prediction.
Let the level show its hand.
📈 Technical View
Structure’s still bearish, but price is testing a major area.
If we close under this weekly level, that shifts the short-term bias.
These volume zones act like algorithmic switches — one move and momentum flips fast.
We’ll see if price pulls back cleanly or just breaks straight through.
No rush — this is the spot to stay calm and read behavior.
🌍 Macro View
The Dollar stays strong because yields are high.
Crypto’s just reacting — not leading.
Money flow’s defensive, and traders are managing risk, not chasing pumps.
Until yields cool off, crypto’s range-bound.
🏛️ Coach’s Take
This level isn’t for guessing.
It’s where pros slow down, not speed up.
React after confirmation — not before it.
🎯 Operator Rule
“Let the level talk before you do.”
— CORE5DAN
Institutional Logic. Modern Technology. Real Freedom.

DXY — London Session🧭 Market Context
Dollar capped down overnight from 99.762 to 99.704 but still trades above the key bullish structure point at 99.525. The structure remains bullish overall, yet price keeps failing to break through 99.875 — the current cap. London session has filled yesterday’s balance range, leaving us in neutral territory.
We’re sitting on zero deviation — meaning equal chance to push higher or rotate lower.
Before taking any position, we need confirmation.
📈 Technical Frame DSM + VFA
Structure stays constructive but momentum is fading.
Volume shows thinning participation near 99.875 — professionals aren’t chasing.
If we see clear volume conviction through that level, we likely drive higher and fill the capped zone. If price slips below 99.525, expect a liquidity sweep into the lower volume pocket near 99.40. Right now, this is observation mode — not engagement mode.
🌍 Fundamental Frame (Macro Logic)
Overnight softness came from mild risk-on sentiment — Asia equities up, yields down.
Still, the Fed’s tone stays restrictive, and dollar demand remains under the surface.
This move looks more like positioning ahead of NFP than any real shift in trend.
🏛️ Coach’s Lens
When the market sits in balance, patience becomes the edge.
Professionals wait for clarity; amateurs act on hope.
Bias follows structure — not emotion.
🎯 Operator Rule
Confirmation defines conviction.
— CORE5DAN
Institutional Logic. Modern Technology. Real Freedom.

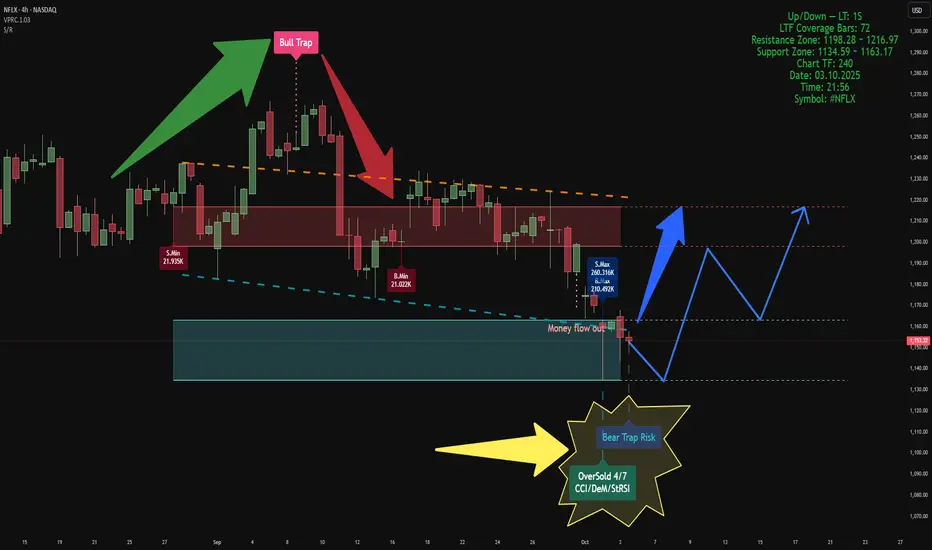
Volume-Based Market AnalysisUsing Indicators:
Smart Money Support/Resistance and ATAI Volume Analysis with Price Action V1.03
Analytical Configuration
This analysis combines two advanced indicators. The calculation period for both has been set to 52 bars, based on a lower timeframe of 1 second (1S), which provides 72 valid LTF candles. This configuration ensures that volume-based calculations remain within the valid data window for maximum accuracy.
Current Market Context
On the latest candle, a Bear Trap Risk signal appeared right after detecting an OverSold condition. This combination usually suggests weakening selling pressure near the end of a bearish leg and indicates the potential for buyer reaction. At that candle, both buy and sell volumes reached their highest values within the 52-bar window, but sellers maintained a slight advantage — approximately 260K sell volume versus 210K buy volume. This dominance by sellers in the OverSold zone reinforces the concept of volume exhaustion
Key Zones
• Support Zone: 1134 – 1163 USD
• Resistance Zone: 1198 – 1217 USD
Price is currently oscillating between these two zones. Based on the data, a short-term move toward the lower edge of the support zone is possible. If strong support holds, a rebound toward the upper boundary of resistance can be expected to retest or potentially break above it.
Structural Observation
In previous data, ATAI identified a Bull Trap at the resistance zone, which initiated the current bearish leg. Now, the emergence of a Bear Trap Risk near the support boundary is an intriguing reversal signal. If this trap functions similarly to the previous Bull Trap but in the opposite direction, we could expect a movement from the support base toward the resistance ceiling in the upcoming phase.
Summary
According to both indicators’ volume-based calculations, this is the most probable short-term scenario. However, this analysis is purely technical and volume-driven, and does not constitute any form of financial or investment advice.
BTCUSD — Pre-New York Session🧭 Context
Bitcoin is pulling back on the hourly without delta following — a clear Delta Divergence.
Key bearish structure: 104 584.
Imbalance: 104 268.
If price closes below these within the next 15 minutes, retracement higher into the NY session becomes likely.
📊 Technical Frame
Volume delta remains ultra-low while price presses higher — signaling a potential fake move.
The U.S. Dollar hovers sideways in its 4-hour structure, holding range highs.
Confluence is light; precision is required.
🌍 Macro Overview
Crypto sentiment is cautious. Short-term flows favor defensive positioning.
Dollar holds firm but lacks expansion — macro tone remains indecisive ahead of U.S. session liquidity.
🎯 Takeaway
Delta Divergence marks exhaustion, not opportunity.
Let confirmation form at 104 584 / 104 268 before engagement.
— CORE5DAN
Institutional Logic. Modern Technology. Real Freedom.

I would call this a Change of Character (CHoCH) for BTCI want to share with you that the 2 Day On Balance Volume (OBV) is now below its EMA(100).
The last time this happened was at ATH in November 2021.
Also the 2D OVB EMA(100) was spot on at the ATL in January 2023.
BTC has reached it's 6.618 Fibonacci of Wave 1 resulting in 698%.
Don't you think a correction would be in order?
And yet people are still talking about a coming bull run ;)))
I don't say this is the final top, even though it looks like it… one more high after a short correction could still be possible.
I'm just saying this is something to keep in mind » Already 7x, bullish OBV is finished AND … according to a simple sine wave (yellow) we are now in a down phase until around February - March 2026.
Let's see what happens.

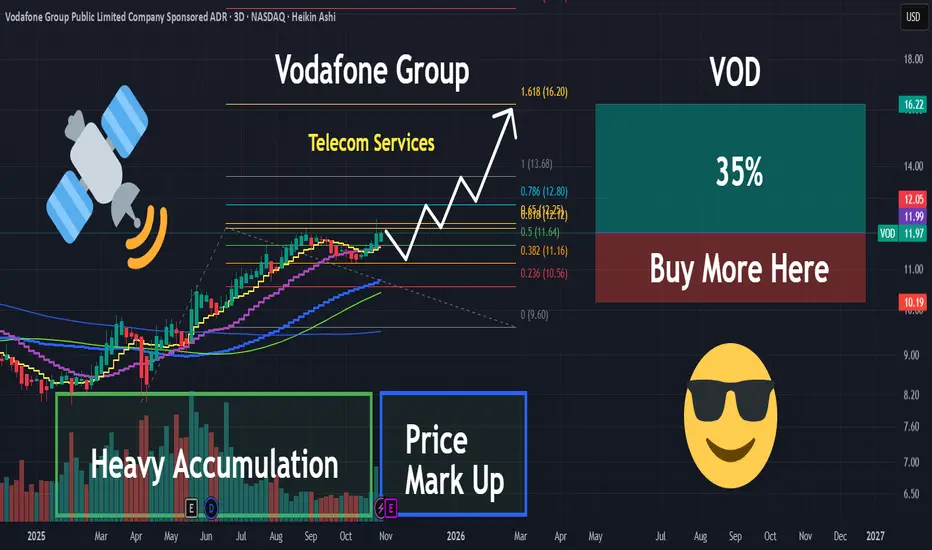
VOD | This Telecom Co. Is Ready to Explode Higher | LONGVodafone Group Plc engages in the telecommunication services in Europe and International. It offers mobile services that enable customers to call, text and access data, fixed line services, including broadband, television offerings, and voice and convergence services under the GigaKombi and Vodafone One names. It also provides mobile, fixed and a suite of converged communication services, such as Internet of Things (IoT) comprising managed IoT connectivity, automotive and insurance services, as well as smart metering and health solutions, cloud and security portfolio comprising public and private cloud services, as well as cloud-based applications and products for securing networks and devices and international voice, IP transit and messaging services to support business customers that include small home offices and large multi-national companies. The company was founded on July 17, 1984 and is headquartered in Newbury, the United Kingdom.
BTCUSD UPDATEBitcoin and the Dollar — October 30, 2025
Bitcoin continues to hold AT the 109,090 volume node — the same zone that absorbed heavy selling during drop. This is the market’s decision point.
1. Macro
The Dollar remains firm after Powell’s cautious tone on rate cuts. Liquidity is flowing toward safety, not speculation. Until the Fed signals confidence, risk markets stay reactive — not expansive.
2. Market structure
We’re taking profits into the 109,090 node. No fresh shorts added here.
Below 106,324 sits a pool of stops — a clear downside magnet if sellers regain control.
If price rotates higher, value area high around 115,596 is the next liquidity zone.
3. Institutional view
This is still a range-driven market. Algorithms are defending prior value while waiting for clarity in macro tone and Dollar strength.
Takeaway
The bias remains cautious.
Dollar firmness defines the boundary.
Structure over story — patience over prediction.
— CORE5DAN
Institutional Logic. Modern Technology. Real Freedom.

INTC Swing Long Conservative Trend Trade Conservative Trend Trade
+ long impulse
+ expanding T2 level
+ support level
+ unvolumed 2Sp
+ volumed test
+ below first bullish bar closed level entry
Calculated affordable virtual stop loss
1 to 2 R/R take profit
Daily Context
"+ long impulse
+ SOS level
+ support level
+ unvolumed Sp"
Monthly Context
"+ long impulse
+ SOS level
+ support level
+ 1/2 correction"
Give me a way better price at afterhours.
I just need my 2 R and I'm out!

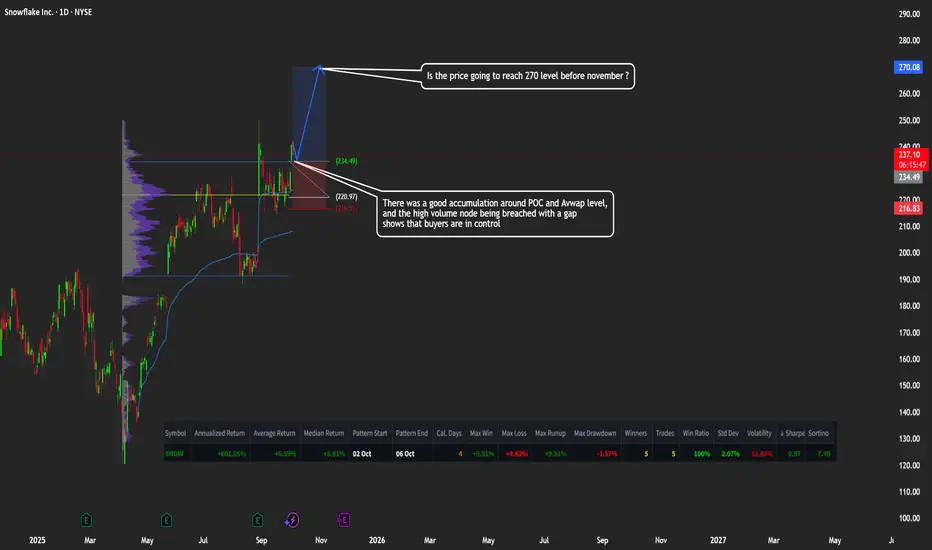
SNOW: Snowflake Headed to $270?🚀 Snowflake Ready for Takeoff? $270 Before November?
Caption:
SNOW has shown strong accumulation around the POC and VWAP levels, with buyers taking control after breaking through the high-volume node with a gap. 📈
Momentum could push the price toward $270 in the coming weeks.
👉 What do you think — is $270 realistic, or will we see a pullback first?
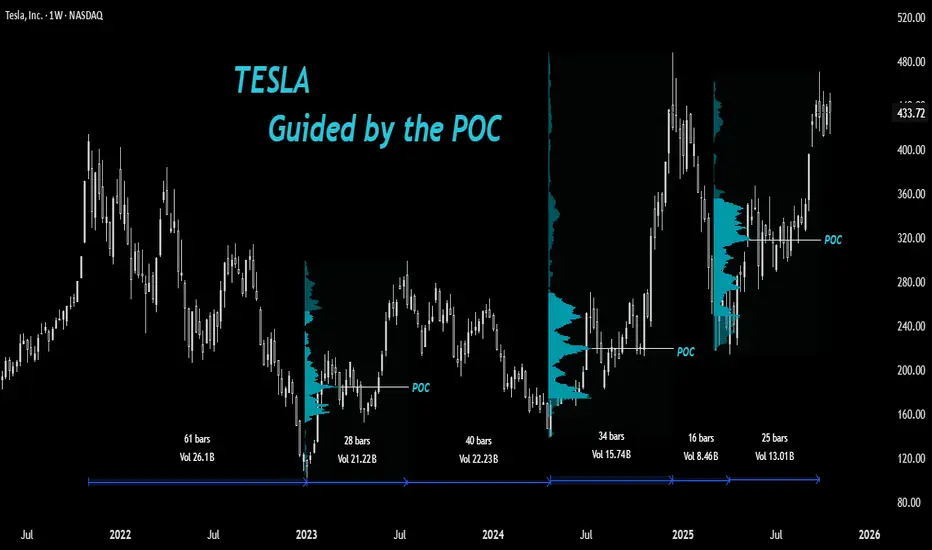
Tesla: Guided by the Point of Control🔎Understanding How Stocks React at Key Volume Profile Levels
In this post, let’s study how a stock can react around important Volume Profile levels and how we, as traders, can take advantage of this behavior.
🔘 A Quick Look at Volume Profile
The Volume Profile shows how much trading took place at each price level. Think of it like a sideways histogram that highlights where buyers and sellers were most active. It helps identify price zones that the market accepted (heavy trading) and those it rejected (light trading).
In between a Volume Profile is the Point of Control (POC) - the price level where the highest trading volume occurred. This is often considered as the market’s fair value zone, where buyers and sellers found the most agreement.
The POC tends to act like a magnet for price. When price moves too far away from it, it often returns to test that level since it represents strong trading interest. That’s why traders use POC zones to mark key supports, resistances, and potential entry areas.
In short:
The Volume Profile shows where trading happened. The POC shows where it mattered the most.
🔘 Overview: TSLA’s Story
After printing a high of $414 in 2021, Tesla (TSLA) has been trying to decisively break that level for almost four years. It made two attempts - first in December 2024, which was quickly faded, and again in September 2025.
🔘 The Fall and Bottom Formation
The stock went through a major bearish phase from $414 down to $101 in 2022 - a massive 75% drop. Then came a sharp V-shaped rally from the bottom - a 194% rise over about 28 weeks, retracing roughly 60% of the entire fall in a short span.
🔘 Why It’s Hard to Catch the Bottom
Catching a stock at the exact bottom is one of the hardest things in trading. No one really knows when the real bottom is forming.
At that point, fear is high, sentiment is negative, and the trend still looks weak. Most traders wait for confirmation - but by then, the bottom is already behind.
Catching the exact low becomes more like a luck than skill. No doubt 'smart traders' focus on catching the early reversal and not the perfect bottom, there are others who wait for pullback opportunities to a fair price.
🔘 April 2024 Bottom Formation
After rallying sharply, TSLA began to pull back from around $300 in July 2023. Traders who had missed the earlier move were waiting patiently with their limit orders for a healthy correction.
But the question was - where should those limit orders be placed?
◽️At the breakout zone around $218?
◽️Near the 50% or 61.8% Fibonacci retracement?
◽️Or below the April 2023 low near $152 for a possible liquidity grab?
The truth is - nobody actually knows the exact level because nothing works all the time.
However, the POC can often help identify a probable fair value zone where accumulation tends to happen.
Although we can’t pinpoint the exact level where a pullback will end, the area 'around' the POC often serves as one of the most reliable zones to accumulate a bullish stock.
And that’s exactly what happened in April 2024. The stock dipped below the previous rally’s POC, grabbed liquidity under $152, and then reversed sharply.
🔘 The Sharp Rally to New Highs
After that, TSLA entered a strong bullish phase, rallying from the April 2024 low to new highs above $414 in December 2024 - a massive 252% rise.
If you observe the Range Tool on the chart, you’ll notice a pattern - bearish phases take longer, while bullish rallies happen faster.
A question here arises: Was this rally sustainable above previous highs?
🔘 The Quick Fall
In January 2025, the stock saw a sharp fall from $488, wiping out 78% of the previous rally.
Interestingly, this decline didn’t stop at a typical breakout retest level - instead, it halted exactly at the POC of the prior bullish rally and began consolidating there.
Since then, the stock has climbed back near its previous highs.
But note this - the January 2025 fall lasted only 16 weeks, while the recovery has taken over 25 weeks without new highs, suggesting a slight loss of upside momentum compared to earlier rallies (early 2023 and late 2024)
🔘 What to Watch Next
If TSLA pulls back again in the future, we can draw a new Volume Profile over the latest bullish leg to locate its POC (I have drawn till the current high of the rally)
That level could once again serve as a potential fair value area and possibly repeat the same price behavior we’ve seen before.
What is your thought on point of control as a tool for investment purpose?
Share your views and hit the boost for more educational posts in future.
📣Disclaimer:
Everything shared here is meant for education and general awareness only. It’s not financial advice, nor a recommendation to buy, sell, or hold any asset. Do your own research, manage your risk, and make sure you understand what you’re getting into.
Your money, your responsibility; and if you’re unsure, ask a qualified financial professional. (Or at least run it by your pet - they’re great listeners 🐶).
Bitcoin USD — Weekly Flat TPO Top 116.077 | Testing Conviction o🧭 Context
Bitcoin has rewarded patient structure traders this week — a near +10% advance from the range lows, holding daily supports “like clockwork.”
We remain inside the bearish daily range, but momentum has clearly rotated upward through volume participation. The internal rhythm continues to expand toward the upper pivot, with liquidity building near the prior TPO top.
📊 Technical Map
Volume expansion off the range lows has confirmed strength, but structure still defines risk.
Daily pivot target sits at 114,082, an ideal partial zone.
Next major liquidity magnet aligns with the weekly flat TPO high at 116.077 — a zone where price historically hesitates.
Closing above 116.077 would flip structural bias bullish; rejection here likely resets next week’s rotation lower.
Patience remains the real edge — take partials, trail stops, and let structure lead, not emotion.
🌐 Fundamental Pulse
This week’s tone stays dollar-driven. The U.S. Dollar Index has been steady as traders await fresh macro cues.
Next week brings U.S. ISM PMI and NFP, both capable of reigniting volatility across crypto and risk assets.
Keep in mind: Bitcoin’s recent strength often fades when real yields firm — the impact mechanism remains the same: liquidity flows follow rate expectations.
🎯 Plan
Trail stops behind range lows, book partials at 114,082, and monitor reaction near 116.077.
If weekly closes above that level, structural bias shifts; otherwise, expect rotation back into range mid.
Weekend traders — stay disciplined, not greedy. The market rewards clarity, not hope.
🧠 Mindset
Every rally feels easy after it happens. The pro separates confidence from euphoria.
Trade what structure confirms — not what emotion predicts.
Enjoy the weekend, protect profits, and respect the range.

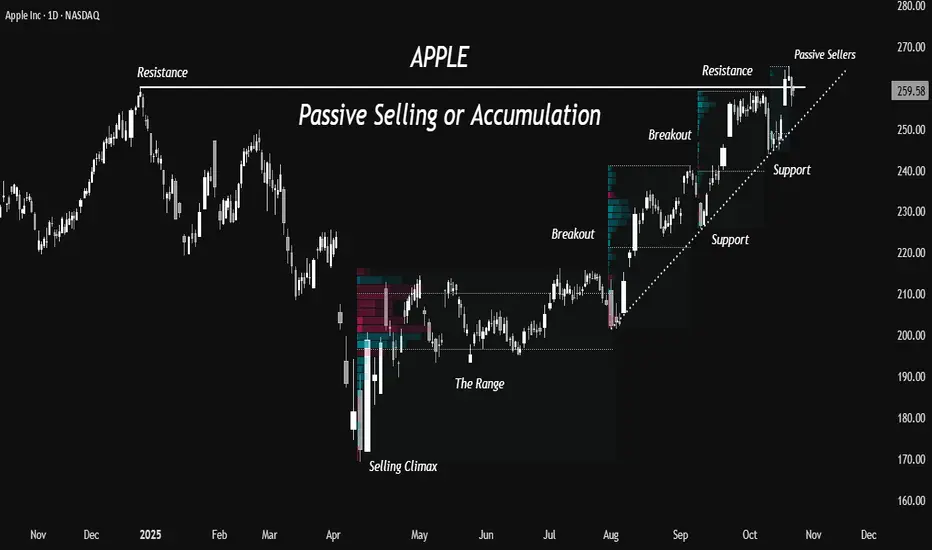
Apple- Passive Selling or More Accumulation?A Bottom and Accumulation
The stock formed a top near 260 in December 2024 and a bottom near 169 in April 2025.
After a sharp bounce of 25% from the lows in just 4 days, the stock consolidated for about 76 sessions in a range from 193 to 214- roughly a 10% range. This created a well-defined base structure, suggesting a period of accumulation.
Breakouts with Volume
The range broke out with strong volume expansion in the beginning of August, confirming a shift in market structure from accumulation to markup. Since then, the stock has maintained a steady uptrend, experiencing only brief pullbacks of about 5 to 6 percent- typical of a healthy trending phase.
Passive Selling at Highs
Currently the stock is trading near its previous highs of 260. It broke out of this resistance and then pulled back below this level. Passive selling is seen around 260 level which means sellers are stepping up, trying to absorb buyers. and the next few sessions will reveal whether this zone turns into a distribution area or simply a retest before continuation.
Trendline Buyers
Pullback buyers are watching the up trendline support which has held the previous shakeouts at two occasions (in Sep and Oct). As long as the stock sustains above this trendline, trend-following participants are likely to continue adding on dips, providing structural support to the uptrend.
Two Scenarios
A sustained move above 260, supported by strong volumes, would reaffirm bullish control and open the door for further upside momentum. Conversely, a break below the trendline could trigger long liquidation from those who bought above 260, leading to broader profit booking and a possible retracement toward 240 or even 225.
What do you think about the stock?
Will it fail the current breakout or sustain?
Do comment below 💬
#For educational purpose only, not a buy/sell recommendation.
Bitcoin — Pivot High Rejection at 108 388: Structure FirstContext
Bitcoin rejected last year’s pivot high at 108 388.
The weekly candle shows a clear reaction at that level.
Price remains inside a daily bearish range between 116 077 and 103 516, with a major volume node near 111 000. We sit in the mid-Fibonacci zone where algorithms love to collect liquidity from impatient traders.
Technical
Order flow indicates sell absorption near the pivot.
Momentum is flat and structure lacks directional conviction.
A weekly close above 108 388 would confirm re-accumulation; a rejection and break below 103 516 would confirm continuation. Until then, midrange trading offers poor reward-to-risk.
Fundamentals
Focus stays on the US-Dollar environment.
Key events this week include GDP advance data, Core PCE inflation, and remarks from Fed speakers. Yields up → stronger USD → pressure on BTC. Yields down → liquidity relief → potential bid in crypto. ETF inflows and stable-coin velocity remain soft, showing defensive liquidity rotation.
Plan
Maintain a neutral-to-bearish bias inside the current range.
Wait for a confirmed weekly close before defining new exposure.
Let structure lead and avoid reactive trades inside noise.
Mindset
This isn’t a market—it's a patience test wearing a Bitcoin logo.
If you feel bored, good. That means you’re finally trading like an adult.

Dual Range Structure with Asymmetric Upside PotentialBMN is setting up beautifully for a high conviction swing. Take a moment to study this chart, there’s a lot unfolding beneath the surface.
Structural Overview
Large Range (Red Labels):
A textbook Wyckoff reaccumulation structure dating back to August 2021.
Gradually increasing volume as price climbs suggests we're approaching Jump Across the Creek (JAC) a bullish inflection point.
Smaller Range (Yellow Labels):
Price appears to be forming its Sign of Strength (SOS).
A minor pullback to form a Last Point of Support (LPS) is possible before continuation.
Trade Scenarios
Scenario 1: Conservative Setup
Entry: Now
Stop Loss: Monthly swing low at $1.70
Targets:
TP1: ~$7.22 — initial range target with heavy resistance and key Gann extensions (not shown)
TP2: If price clears this zone, look for the larger range target
Note: There’s a marked Fair Value Gap (FVG) prior to TP1. Price may reject, consolidate, then push through. Consider partial profit near the EQ of the FVG depending on risk appetite.
Scenario 2: Aggressive Setup
Entry: Now
Stop Loss: $2.84 — tighter buffer based on momentum and closes above two key 50% range levels
Targets: Same as Scenario 1
While momentum supports the aggressive SL, keep in mind the SOS is still forming. Expect a potential pullback to create LPS before continuation.

Buy Kfin Technologies above 1,145 INR Buy Kfin Technologies above 1,145 INR.
Target: 1,180 / 1,220 INR.
Stoploss: 1,078 INR.

SOFI: Buyers in Control? Heading Toward $31?SOFI is showing strength as AVWAP and HVN hold as key support — a clear sign that buyers are in control. 📊
If momentum continues, we could see a push toward the $31 target zone in the coming weeks.
👉 What’s your take — breakout incoming or another retest of support first?
Based on :
- Fundamental analysis
- Avwap and HVN levels
- Quantitative analysis

GMDC Breakout Setup: Buy Above 637Entry: Buy above 637 (recent resistance and Fibonacci breakout spot).
Target 1: 673 (Fibonacci 0.382 retracement).
Target 2: 703 (Fibonacci 0.5 retracement).
Target 3: 733 (Fibonacci 0.618 retracement).
Stoploss: 615 (below recent support and trendline).
Volume spike and RSI uptick signal momentum

Gold at $4,000: A Major Milestone — or the Start of a Pullback?Gold just hit the $4,000 mark — a massive psychological level after one of the strongest rallies in years 🚀
Fueled by Middle East conflicts, the metal’s performance has been insane: +278% from the 2015 low and +130% from the 2022 correction low.
Now, with a ceasefire announcement in play, institutions might start taking profits. Could this be the pivot point before a short-term bearish move?
What do you think — will gold keep climbing to new highs, or is it time for a correction?
Drop your thoughts below 👇

$COIN viction Trade: Weekly Up, Daily Tight
NASDAQ:COIN
Summary
NASDAQ:COIN exhibits a textbook “expand → break → retest → coil” progression. A broad weekly megaphone that developed through 2024 continued into 2025 with a June ’25 breakout; price subsequently reached ~$445 (megaphone resistance) in July ’25 and then retraced in an orderly fashion, holding above 2023’s ceiling. Since that pullback, ranges have narrowed and participation has declined while price consolidates above $280—behavior consistent with constructive acceptance before a potential next leg higher.
Market Structure and Setup
The primary structure is defined on the weekly chart: an expansionary megaphone that retested prior highs. Tactically, the daily chart shows a controlled pullback, retest, and subsequent coil. This multi-timeframe alignment—higher-timeframe trend with lower-timeframe acceptance—creates favorable conditions for measured moves and for risk to be defined against transparent levels rather than discretionary judgment.
Fibonacci-Based Upside Roadmap
Anchoring to the 2024–2025 impulse advances, 1.618 extensions cluster around ~$580 (Sep ’24 → Dec ’24 leg) and ~$650 (Oct ’23 → Mar ’24 leg). These are not short-dated “targets” but conditional waypoints: they remain operative if the current consolidation resolves higher and the weekly uptrend reasserts.
Microstructure: Short Consolidations as Future Magnets
In sustained advances, brief, tight candlestick compressions often function as “price memory,” attracting subsequent retests and liquidity. COIN’s February 2024 bull-flag pause—formed mid-run—has been revisited multiple times since, underscoring how such compressions act as magnets in later price action. The present tight band atop $340–$370 should be viewed in similar context: it is both a potential near-term launchpad and a likely reference zone for future pullbacks as supply and demand re-balance around it.
Execution Plan
Accumulation is favored on constructive behavior within $290–$330 (retest followed by a higher low on the daily). For risk management, tactical invalidation sits below ~$280; for participants keying off weekly structure, a wider ~$250 stop aligns with the higher-timeframe shelf. If momentum resolves first, additional entries are reasonable on a clean break-and-hold above local range highs, using the reclaimed shelf to maintain tight risk. From a successful breakout, staged distribution into ~$580 with reassessment into ~$650 allows the position to self-finance while respecting the possibility of momentum fatigue.
Invalidation Criteria
A daily close back below ~$280 would indicate the near-term reclaim has failed and the base requires more time. A weekly close beneath ~$250 would challenge the integrity of the larger expansionary structure. Either signal warrants standing aside and allowing the chart to reset.
Fundamental Linkages
Coinbase’s revenue remains acutely sensitive to crypto price trends and realized volatility. When BTC/ETH trend and trading activity broadens across spot and derivatives, COIN’s top line typically expands with the cycle. The U.S. regulatory backdrop has moderated relative to the prior year—removing one overhang—yet policy risk persists and can shift rapidly. In effect, the technical setup has a plausible fundamental tailwind when the broader crypto complex trends and trades.
Key Risks
Crypto beta: A broad risk-off in digital assets will likely transmit to COIN regardless of technical posture.
Policy/regulation: Adverse enforcement actions or new rules could impair volumes, product breadth, or take rates.
Competition: A prospective Kraken IPO would arm a major U.S. competitor; Robinhood’s continued crypto build-out pressures economics during quieter tapes.
Operational/security: Exchange businesses carry ongoing operational and cybersecurity risks; incidents can compress multiples abruptly.
Conclusion
The market disclosed intent with the June breakout; current price action is testing sponsorship. Provided COIN continues to accept above $280–$330 and the ongoing coil resolves upward, the $580 → $650 roadmap remains credible. The operative plan is to trade the daily in the direction of the weekly, treat the former resistance shelf as the line in the sand, and require the chart to confirm strength before pressing exposure.
Not financial advice. Just charting things out. Let’s see what happens. Please adapt levels, sizing, and risk controls to your own process and constraints.
