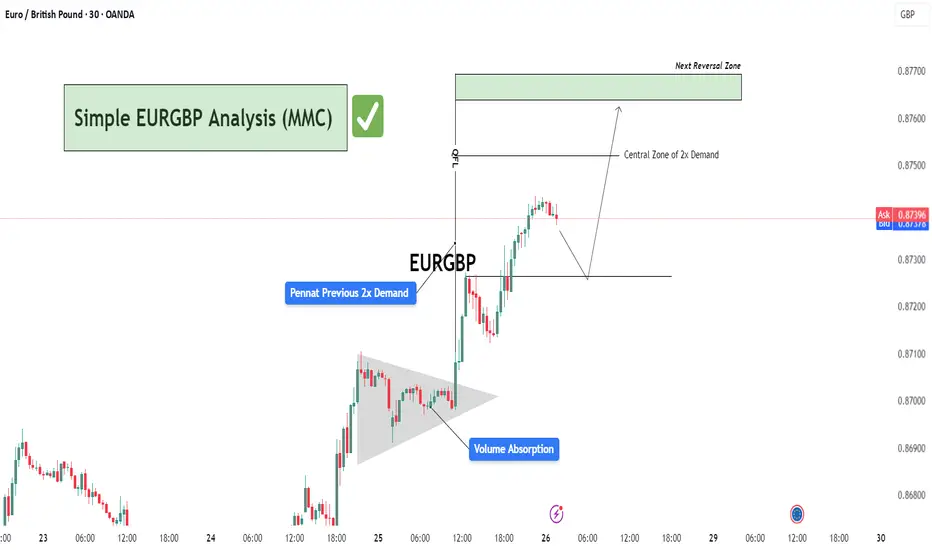
Simple EURGBP Analysis (MMC) – Bullish Continuation or Reversal?🕵️♂️ Chart Overview – 30-Min Timeframe (OANDA)
This EURGBP chart illustrates a classic bullish continuation structure following a volume absorption phase and pennant formation, leading into a vertical price expansion toward a potential reversal zone. The technical flow demonstrates smart money accumulation and re-accumulation before a sharp bullish leg.
🔷 Phase 1: Bullish Accumulation via Pennant Formation
The chart begins with a tight consolidation structure marked as a pennant, typically a continuation pattern.
This area coincides with “Previous 2x Demand”, hinting at a strong institutional buying interest.
The Volume Absorption label suggests that sell-side liquidity was efficiently absorbed—often a precursor to bullish breakouts.
📈 Phase 2: Breakout & Price Expansion
Price breaks out of the pennant aggressively, validating the absorption theory.
The post-breakout rally continues with minimal retracement, showcasing impulsive bullish momentum.
The QFL (Quasimodo Failure Level) is also marked—this serves as a structural footprint left by trapped sellers.
🟩 Next Levels to Watch: Reversal or Re-Entry Zones
As the price approaches the green "Next Reversal Zone" (0.87650–0.87700), watch for potential exhaustion or a reaction.
The Central Zone of 2x Demand (just below 0.87500) could act as a re-entry level for continuation long setups.
Anticipated short-term correction before continuation, as depicted by the projected path.
🧠 Strategic Insight & Trade Planning
Aggressive Bulls: May target breakout pullbacks near the Central Zone of Demand for intraday continuation.
Conservative Traders: Should wait for a clean reaction from the green Reversal Zone. If rejection is confirmed, short opportunities with tight stops become favorable.
Watch the price behavior around 0.87300–0.87500—this will likely dictate whether continuation or correction prevails.
Volumeanalysis
BLACKBUCKBLACKBUCK showing strength and crossed previous resistance zone with decent volume. Support is near 425-8 levels. Resistance is near 510 and above that it may enter into uncharted zone. Keep it on radar.
HUBTOWNHUBTOWN giving trendline breakout with decent volumes. Support can be seen near 301-2 level. On upper side resistance may be nr 342-365. Stock has given around 80% return in last 1.5 months. So strong momentum is observed. Keep it on radar

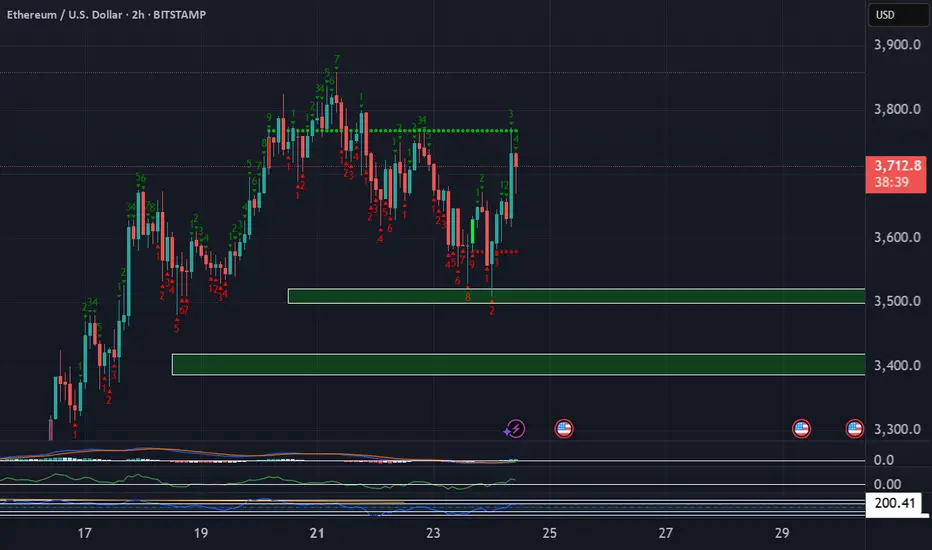
Ethereum Long These zones are significant because they represent areas where large institutions and professional traders are likely to be active, potentially causing strong price movements when those orders are triggered. We want to enter trades that have minimal drawdown to maximize our buying power.
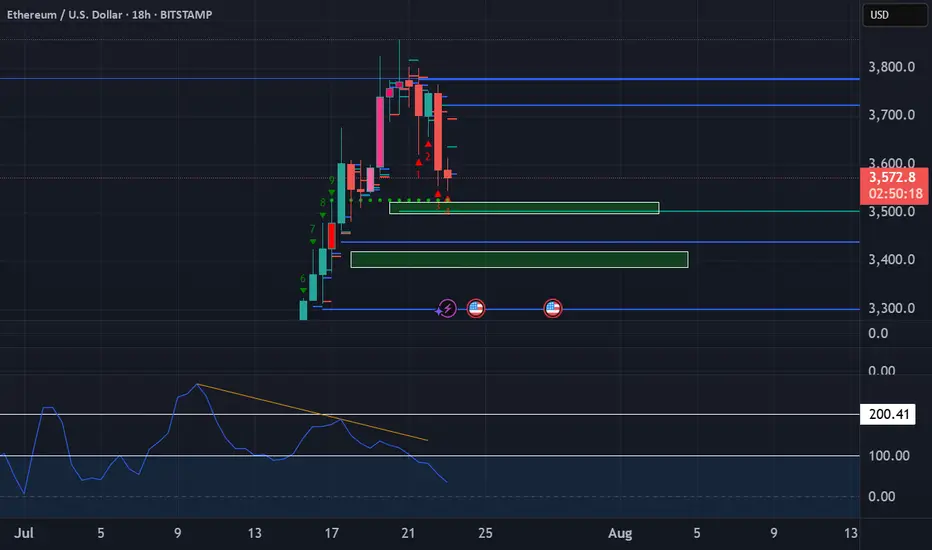
Ethereum short updateDon't be surprised to see some buying coming into play at the POI's highlighted below.
Hedging involves entering into a trade that is expected to perform in the opposite direction of an existing position, effectively protecting against potential losses.
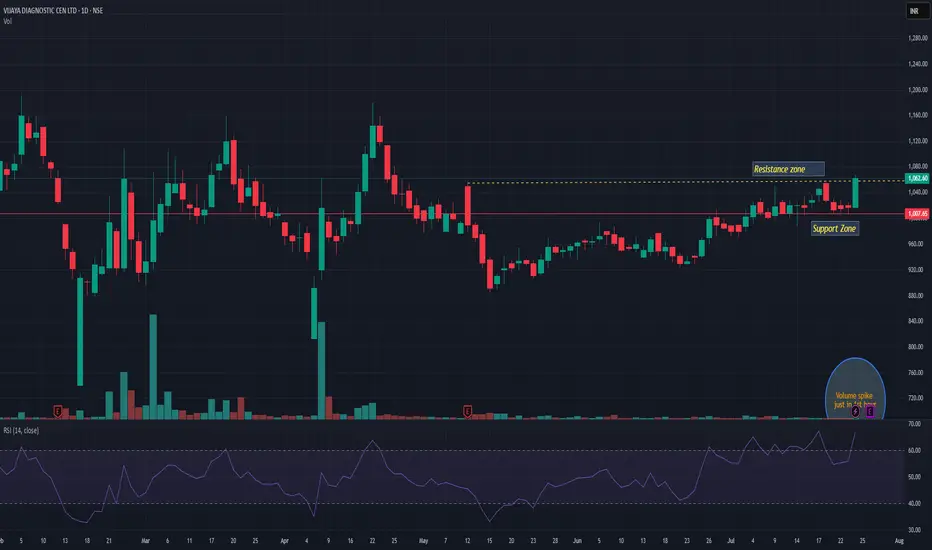
VIJAYAVIJAYA giving trendline breakout with decent volume. Q1 result is on 28th July may push momentum rally. Support seems near 1005 level. We may see momentum up to 1170 in coming days. Keep it on radar.
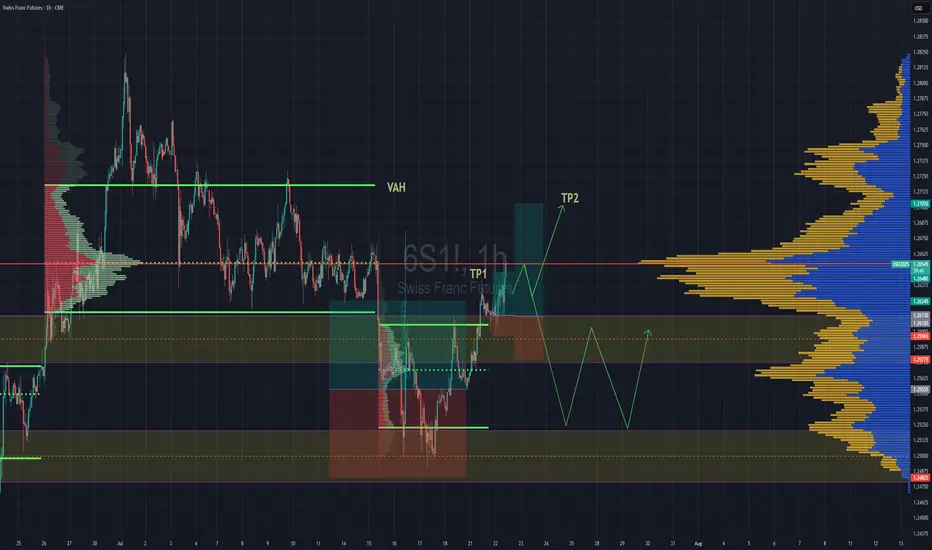
Swiss Gaining Momentum Against The DollarSwiss futures gaining strength against the dollar. We have broken back into previous rotation that was somewhat balanced, but still leaning towards a "b" style volume profile . If we are able to get above the POC, then we''ll go straight for TP2 close to Value are high.
If the POC is really strong and we reject hard from the POC then we might lose the value area and fall back down to previous value area to continue consolidation there until further notice.
Bullish Multi-Timeframe Alignment, Macro Risks & Key Levels__________________________________________________________________________________
Technical Overview – Summary Points
__________________________________________________________________________________
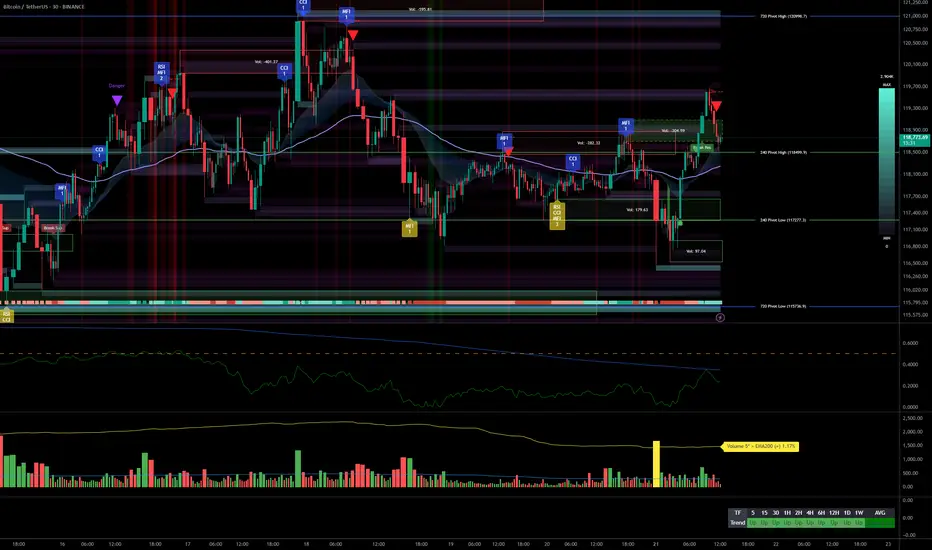
Momentum: Strong bullish trend across all timeframes.
Major Supports: 115796/117277 (720/240 Pivot Low).
Key Resistances: 119000–123200 (240/D Pivot High), watch for potential extension or profit-taking.
Volume: Healthy participation, no marked anomalies.
Risk On / Risk Off Indicator: Strong sector momentum except 15min (neutral), risk appetite confirmed.
Multi-TF Behavior Synthesis: No "behavioral sell" warning, ISPD DIV neutral, no climax.
__________________________________________________________________________________
Strategic Summary
__________________________________________________________________________________
Global Bias: Clearly bullish, all timeframes aligned, no notable technical divergences.
Opportunities: Buy on pullback (HTF support) or on breakout/consolidation above 123200 with increasing bullish volume.
Risk Zones: Drop below 115796 invalidates scenario; watch for “sell” behavioral signals (ISPD red/extreme volumes) or persistent sector divergence.
Macro Catalysts: Next Fed meeting (July 21st), ongoing geopolitical tensions.
Action Plan: Closely monitor supports/resistances, strict stops below 115796, dynamic adjustment to upcoming macro volatility.
__________________________________________________________________________________
Multi-Timeframe Analysis
__________________________________________________________________________________
1D: Bullish breakout, leading tech/growth sector, stable volume.
12H: Bullish signal, price held above all key HTF pivots.
6H: Consolidation below key resistance 123218, no distribution, strength intact.
4H: Sideways just below resistance, controlled pause, possible push upwards.
2H: Stalling under resistance yet bullish momentum still present.
1H: Supports defended, rising volume on rebounds, no excess.
30min: Intraday momentum positive; no signs of reversal, strong indicator consensus.
15min: Testing pivots, slight momentum decline, neutral on Risk On / Risk Off Indicator.
__________________________________________________________________________________
Technical confluence: All timeframes aligned upward, strong sector momentum, controlled volumes, no behavioral excess. Watch for resolution near the 119000–123200 resistance zone (potential supply), and monitor for alert signals on behavioral/volume side. Macro: anticipate volatility around July 21 (Fed).
__________________________________________________________________________________
Macro & Decision Synthesis
__________________________________________________________________________________
News / Macro: Upcoming Fed meeting = caution period, expected volatility spike. Geopolitics: Middle East/Europe tensions, no Asian shock.
On-chain: BTC in price discovery, initial STH profit-taking, everyone in latent profit (interim top risk if overheated, reward up to $130k possible).
Actionable checklist:
Optimal entry: Pullback on 115796–117277 or strong breakout above 123200 with confirmed volume
Stop-loss: Below 115796 (major pivot); intraday swings below 117277
Imperative risk management, avoid leveraged trades ahead of macro event
__________________________________________________________________________________
Final Conclusion
__________________________________________________________________________________
Bitcoin is structurally bullish, supported by perfect multi-timeframe alignment, strong sector leadership (Risk On / Risk Off Indicator), and positive on-chain signals. However, proximity to historical resistances and looming volatility call for strict, active risk management. Targets: $123k/$130k; stops below 115796.
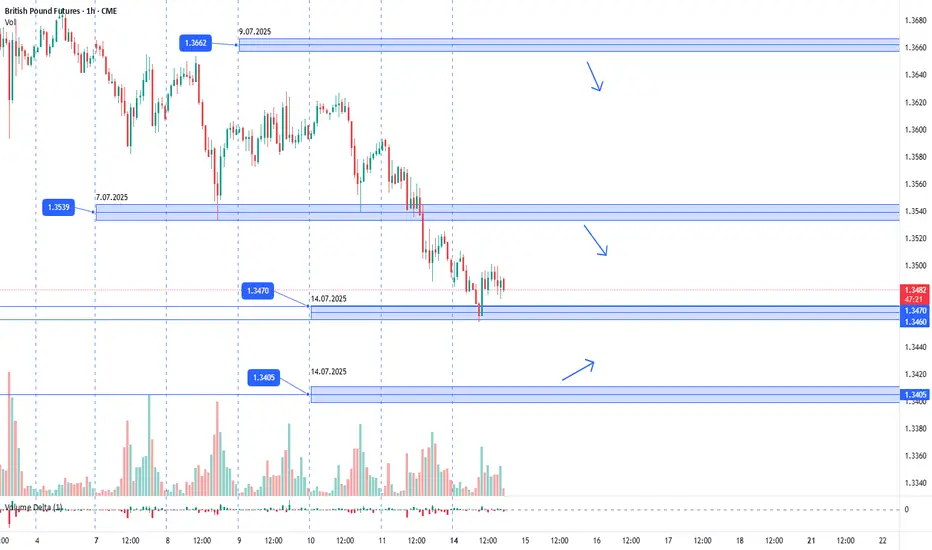
GBPUSD. 14.07.2025. The plan for the next few days.The nearest interesting resistance zone was already worked out in the morning and gave a good reaction. Let's mark the others where we can expect a reaction. It's not certain that there will be a major reversal, but I think we'll see a correction that can be monetized. We're waiting for a reaction and looking for an entry point.
The post will be adjusted based on any changes.
Don't forget to click on the Rocket! =)
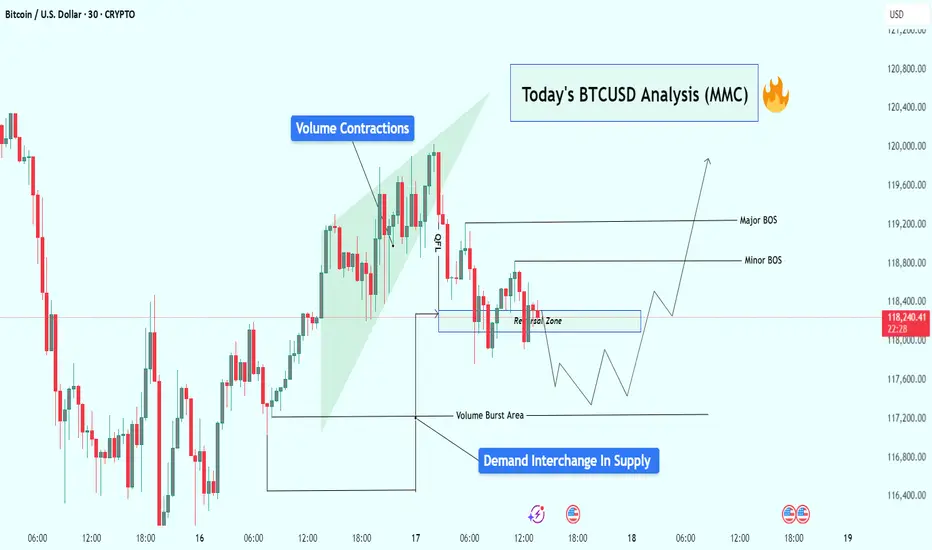
BTCUSD Analysis : Reversal Brewing from Volume Burst Demand Zone🧠 Overview:
Bitcoin is currently showing signs of a potential bullish reversal, following a classic Market Maker Cycle (MMC) pattern. The price action has been clean, respecting both volume dynamics and structural levels, setting the stage for a possible breakout above key areas of interest.
Let’s dive into the detailed breakdown:
🔍 Key Technical Elements:
1️⃣ Volume Contractions – Early Sign of Momentum Shift
At the top left of the chart, we observe a sharp upward move, followed by volume contraction within a rising wedge. This typically represents:
Absorption of orders
Reduced volatility
Market indecision
This kind of structure often precedes a reversal or aggressive breakout, depending on how price behaves near liquidity zones.
2️⃣ Fakeout/Trap Above – Classic MMC Manipulation Phase
After the rising wedge formed, BTC experienced a quick fakeout (stop hunt) just above the highs, then dropped sharply. This was the manipulation leg — a clear signal that liquidity above the wedge was taken and smart money is now repositioning.
🧠 Market makers love to trap breakout traders before moving the opposite way. The drop confirms manipulation is complete.
3️⃣ Reversal Zone + Demand Interchange into Supply
Price then entered a marked reversal zone which was previously an area of demand — now interchanging into supply. This zone is critical because:
It aligns with volume burst zones
It acted as support turned resistance
Multiple rejections confirm order flow shift
This tells us smart money is now testing this area to accumulate or trap sellers.
4️⃣ Volume Burst Area – Institutional Involvement Confirmed
We can clearly identify a Volume Burst Area, where price spiked with strong momentum — this is not retail trading. This zone is now being revisited for a potential bullish re-accumulation.
Expect reaction from this area, as it likely contains unmitigated buy orders from institutions.
5️⃣ Break of Structure (BOS) Mapping:
Minor BOS: Breaks short-term lower highs, showing early intent.
Major BOS: Breaks significant structure, confirming shift in trend direction.
A successful retest of demand and then break of both BOS levels will likely lead to a strong bullish continuation.
📈 Trade Plan & Potential Price Path:
There are two potential bullish entry strategies forming:
✅ Scenario 1: Clean Breakout Plan
Price holds the current reversal zone
Breaks Minor BOS, then Major BOS
Retest of BOS confirms continuation
📍 Target: $119,600+
✅ Scenario 2: Liquidity Sweep Entry
Price dips lower into Volume Burst Area
Sweeps liquidity below and prints a bullish reaction
Enters from discount zone
Same upside targets apply
🧠 This would be a smart money entry — entering from the lowest point of pain for retail traders.
🧵 Final Thoughts:
BTC is setting up beautifully for a reversal continuation pattern within the MMC framework. We’ve seen:
📉 Initial drop (accumulation phase)
🎭 Fake breakout (manipulation phase)
📈 Upcoming expansion (breakout phase)
All signs point to a high-probability move upward, especially if price confirms with BOS + retest. Be patient, wait for price action to align with structure and volume clues.
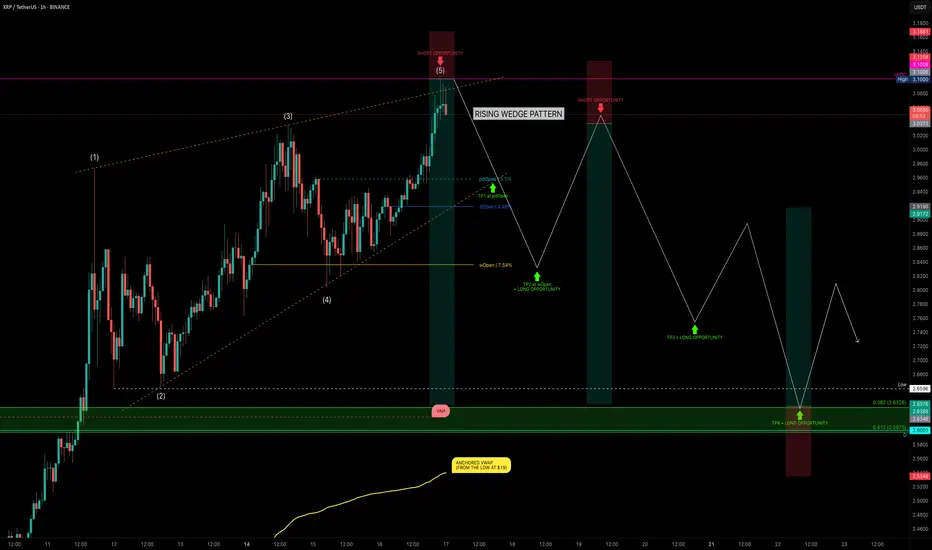
XRP Hits $3.10 — Rising Wedge or Ready to Fly?XRP has been on a strong run over the past 24 days, rallying from $1.90 → $3.10 — a +62% price increase. But after hitting key resistance, is XRP about to correct, or will it break out further? Let’s dive into the technicals.
🧩 Market Structure
Rising Wedge Pattern:
The current market structure resembles a rising wedge, with XRP likely completing wave 5.
Rejection Zone Hit:
Price tapped the nPOC at $3.10 and rejected — providing a clean short opportunity.
📉 Key Support Levels & Confluences
Taking the full 24-day bullish move:
0.382 Fib Retracement: $2.6326 — aligns with liquidity pool below the $2.6596 swing low.
226-day Trading Range VAH: ~$2.62 (red dashed line) — adds confluence.
Daily Level: $2.60 — further support.
Anchored VWAP from $1.90 Low: ~$2.54 (rising over time).
✅ Conclusion: The $2.66–$2.60 zone is a critical support area and offers a solid long opportunity.
Trade Setups
🔴 Short Setup (After Breakdown Confirmation):
Wait for a sell-off & breakdown of the wedge.
Ideal entry: retest of the lower wedge edge, ideal short entry would be between 0.618–0.786 fib retracement.
🟢 Long Setup:
Entry Zone: $2.66–$2.60
SL: below VWAP line
Target: Fib 0.618 as TP
🧠 Educational Insight: Rising Wedges Explained
A rising wedge is a bearish pattern, often signalling weakening momentum as price climbs within narrowing highs and lows.
Key points:
➡️ Volume typically declines as the wedge matures.
➡️ Breakdown below the lower wedge edge often triggers stronger sell-offs.
➡️ Retests of the broken wedge support turn into ideal short entries.
Pro tip: Combine wedge patterns with fib retracement zones and VWAP levels for higher-confidence setups.
Watch for wedge breakdown confirmation before shorting.
_________________________________
💬 If you found this helpful, drop a like and comment!
Want breakdowns of other charts? Leave your requests below.
Gold Market Analysis (XAU/USD) – MMC Analysis + Liquidity Target🧠 Market Context Overview:
Gold recently experienced a highly impulsive move from a major demand zone, suggesting strong smart money activity. The market is currently in the redistribution phase of the MMC (Market Maker Cycle), transitioning between a reversal impulse and a liquidity targeting move.
Let’s dissect the key zones, structure, and confluences that support the ongoing market narrative.
📍 1. Strong Demand Reaction (3X Demand Spike):
We start with a triple-tap demand rejection, where the price sharply reversed to the upside. This kind of movement typically represents:
Institutional Entry Points
Stop-Hunt Below Previous Lows
Liquidity Grab Before Expansion
This strong bullish engulfing candle signifies position building by smart money, often the beginning of a significant leg up.
🧱 2. Reversal Zone & Liquidity Imbalance:
The highlighted green zone between $3,370–$3,375 is crucial. Why?
It’s an inefficiency zone where price moved too fast with low resistance.
This created a liquidity void that typically needs to be revisited (also known as FVG – Fair Value Gap).
The area also coincides with structural resistance, making it a high-probability target for price to revisit and reject again or break through with intent.
📌 Smart money always returns to areas of unfilled liquidity to close their positions or trap late retail entries.
🔺 3. Volume Contraction (Wedge Pattern Formation):
After the explosive push upward, the market started compressing, forming a descending wedge — a classical volume contraction pattern.
What does this mean?
Volatility is decreasing
Liquidity is building up
Big breakout is expected
It’s like pulling a slingshot — the more it contracts, the stronger the release will be. The direction will depend on which side breaks first.
🔁 4. Previous Structure Flipped (Support turned Resistance):
You’ll notice a key level around $3,353–$3,355 acting as a flipped structure.
This was previously a support zone that got broken.
Now it’s acting as resistance — a classic example of support/resistance flip.
This adds confluence to the idea of a possible rejection or reaction in this area.
🧠 Structure flipping is a smart money trick — break structure, retrace to trap liquidity, and then run the opposite direction.
📊 5. MMC Logic – Market Maker Cycle in Play:
Here’s how the MMC is flowing:
Accumulation (bottom consolidation)
Manipulation (liquidity sweep below demand)
Expansion (aggressive upward move)
Contraction (volume dies, price slows down)
Now we’re waiting for the next manipulation or expansion phase.
The current wedge is the pause before the next move, which could fill liquidity in the reversal zone or go lower to sweep resting sell-side liquidity.
🎯 Trading Scenarios:
✅ Bullish Bias (if breakout happens):
Break and close above the wedge
Retest previous flipped structure successfully
Target: Liquidity zone at $3,370–$3,375
🎯 This move would fill the imbalance and potentially tag sell-side liquidity sitting at the top.
❌ Bearish Bias (if rejection holds):
Failure to break above flipped structure
Breakdown from the wedge
Target: Demand origin around $3,325–$3,315
🧲 A move lower would make sense if liquidity remains uncollected beneath the range.
🧵 Final Thoughts:
Gold is currently in a high-probability setup zone. We have:
✅ Clear demand reaction
✅ Imbalance above
✅ Volume contraction
✅ Flipped structure
✅ Strong MMC confluence
Now it's a waiting game. Let the market show its hand — either a clean breakout with volume or a fakeout/rejection and reversal.
📌 "Trade what you see, not what you think. Let the levels and liquidity guide your decision."

Patanjali Foods: A Potential Reversal Brewing Near Demand Zone?The price has now retraced back into a key value zone between 1,610 - 1,635, which has previously acted as a strong base. This zone also coincides with high volume activity on the visible range volume profile - suggesting accumulation interest.
Technically, the stock is near the 0% Fibonacci extension with multiple confluences of past support and volume, forming a potential base.
If this holds, look for retracement targets:
• First bounce zone: ₹1,687 (50% Fib)
• Further recovery: ₹1,745–₹1,775 (Fib 61.8–78.6%)
Long-term: ₹1,861 (161.8% Fib extension), ₹2,016 (261.8%)
Fundamentals Snapshot:
• Market Cap: ~₹58,000 Cr
• P/E: ~34x | P/B: ~3.8x
• Promoter Holding: 80.82% (No pledging)
• Debt-to-Equity: ~0.25
• ROCE: ~13.2% | ROE: ~10.4%
• FII Holding: 3.6%, DII Holding: 6.3%
Patanjali’s brand strength in edible oils, packaged foods, and growing FMCG integration offers secular demand visibility. The recent correction seems sentiment-driven, not structural.
Keep in Focus:
A decisive close above 1,660 could indicate a short-term reversal.
This chart is for educational use only and not a buy/sell recommendation.

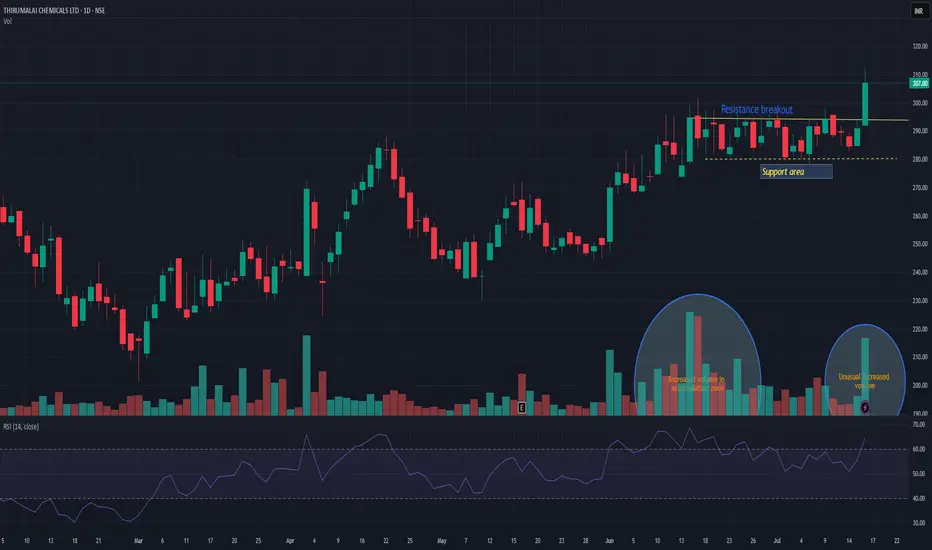
TIRUMALCHMTIRUMALCHM has given resistance breakout with decent volume. Another good thing is unusual volume increased in accumulation zone. Support can be seen near 280 levels. There is high probability that this time it may push the stock in to trend change and may take momentum to the next level. Keep it on radar.
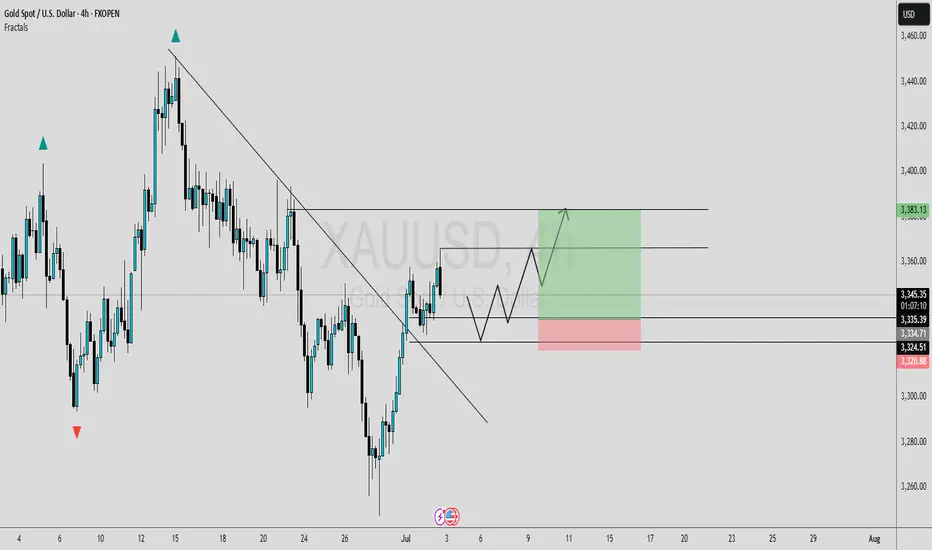
XAUUSD ANALYSISOn gold currently we're analyzing 2H time frame. As we know that current trend was bullish. At this stage, I'm anticipating a retracement towards my Point of Interest (POI), where I’ll be looking for a clear bullish confirmation, ideally through candlestick structure or solid price action. Only upon receiving that confirmation will I consider entering a buy position.
This outlook is based on the higher time frame structure. For now, I'm observing patiently to see how price unfolds. Until the market sweeps the SSL liquidity, I will remain on the sidelines no entries until that key liquidity level has been taken. Confirmation is key.
Always use stoploss for your trade.
Always use proper money management and proper risk to reward ratio.
#XAUUSD 2H Technical Analysis Expected Move.

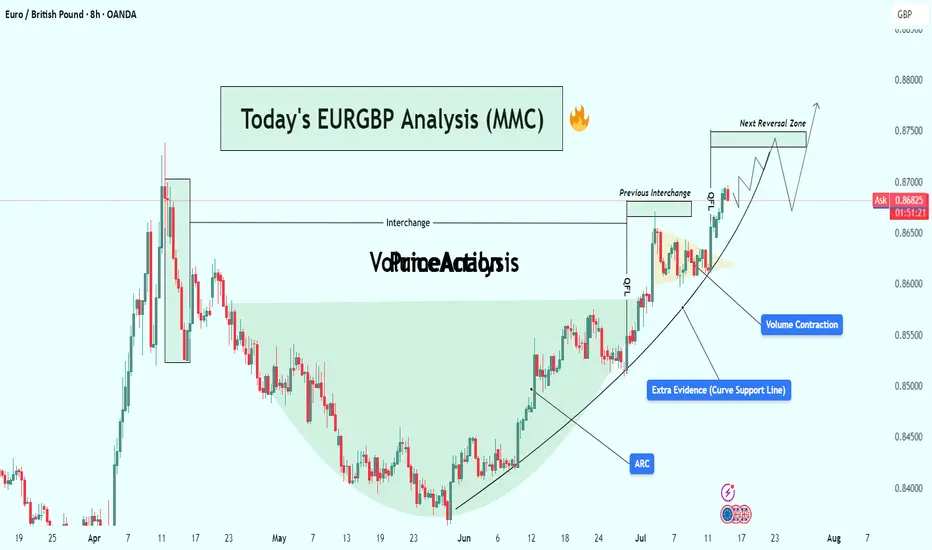
EURGBP Analysis : Bullish Setup + Support & Reversal Zone Ahead🔍 Overview:
This analysis explores a well-developed Mid-Market Cycle (MMC) pattern playing out on the EUR/GBP 8H chart. The price action has transitioned from accumulation to markup, forming a classic cup-shaped recovery structure supported by a parabolic ARC curve. With strong volume contraction, historical interchange zones, and clean breakouts, this setup indicates bullish momentum heading into the next reversal zone.
Let’s walk through each component in detail and build the case for this trade setup.
🧩 1. MMC Cycle Framework
The chart structure aligns with the MMC (Mid-Market Cycle) model:
Phase 1 – Accumulation:
From April to late May, price formed a rounded bottom resembling a "cup" — a known sign of smart money accumulation. The downward momentum stalled, and sellers were gradually absorbed by larger participants.
Phase 2 – Breakout & Expansion:
Early June saw price breaking out of this base, beginning an aggressive uptrend supported by rising structure. This marks the transition to the markup phase of the MMC.
Phase 3 – Pullback & Continuation:
Price pulled back slightly into previous resistance (now turned support), forming a bullish continuation triangle and breaking out again. A textbook MMC continuation.
🧠 2. Technical Confluences
✅ A. ARC Support Curve
The curved support line (ARC) acts as dynamic demand.
Price has bounced multiple times off the curve, reinforcing its strength.
ARC patterns often signal increasing bullish acceleration, reflecting market psychology as traders gain confidence with each higher low.
✅ B. Interchange Zones
The concept of Interchange refers to zones where support becomes resistance or vice versa.
This chart features two key interchange levels:
First interchange formed after the April high.
Second interchange was retested and held cleanly after the breakout.
These areas indicate institutional interest, and their successful retests confirm trend continuation.
✅ C. Volume Contraction
Volume has been shrinking during the markup, which is counterintuitive but strategic.
In Wyckoff theory, this shows absorption of supply — institutions deliberately suppress volatility to accumulate before the next breakout.
Once the contraction ends, explosive moves often follow.
🎯 3. Target Zone: Next Reversal Area
Price is now heading into a clearly defined resistance zone around 0.87400–0.87500.
This level was respected in prior price history (April peak) and may trigger short-term selling or distribution.
The chart shows a possible liquidity grab scenario at the reversal zone, followed by a corrective move (mini bearish ABC).
📈 4. Price Projection & Scenarios
Bullish Case (High Probability)
Breakout Above 0.87500: Triggers a major leg upward.
Potential extension targets:
0.87850 (Fibonacci projection)
0.88200 (next higher timeframe resistance)
Bearish Case (Short-Term Pullback)
Rejection at Reversal Zone:
A corrective leg toward the ARC or prior interchange.
Ideal re-entry for buyers near:
0.86400–0.86600 zone
Or curve retest near 0.86000
🧭 5. Trade Strategy
🔹 Entry Options:
Breakout Entry: Above 0.87500 on strong candle + volume.
Retest Entry: On dip toward ARC curve or interchange.
🔹 Stop-Loss Ideas:
Below ARC line (~0.86000)
Below last bullish engulfing (~0.86250)
🔹 Targets:
TP1: 0.87500
TP2: 0.87850
TP3: 0.88200 (longer-term swing)
💡 6. Trader Psychology in This Chart
This chart represents a controlled bullish structure — a hallmark of smart money participation. Here’s why:
The rounding base was methodically built without sudden volatility.
Each breakout was followed by healthy retests (no fakeouts).
Volume stayed low during markups, reducing retail confidence and allowing institutional loading.
The ARC curve reflects increasing confidence and participation — buyers consistently stepping in on higher lows.
📌 Conclusion
This EUR/GBP setup is a textbook MMC/ARC structure with multiple confirmations:
Smart accumulation
Curve support respected
Volume and structure aligned
Clear next resistance zone
Whether you’re swing trading or monitoring for breakout scalps, this is a high-quality setup worth tracking. Be ready to act at the reversal zone, as it will either confirm continuation or offer a lucrative retest entry.
🔔 Follow for More:
I post regular MMC, structure-based, and Smart Money trade setups. Drop a like, comment your thoughts, or ask questions below!
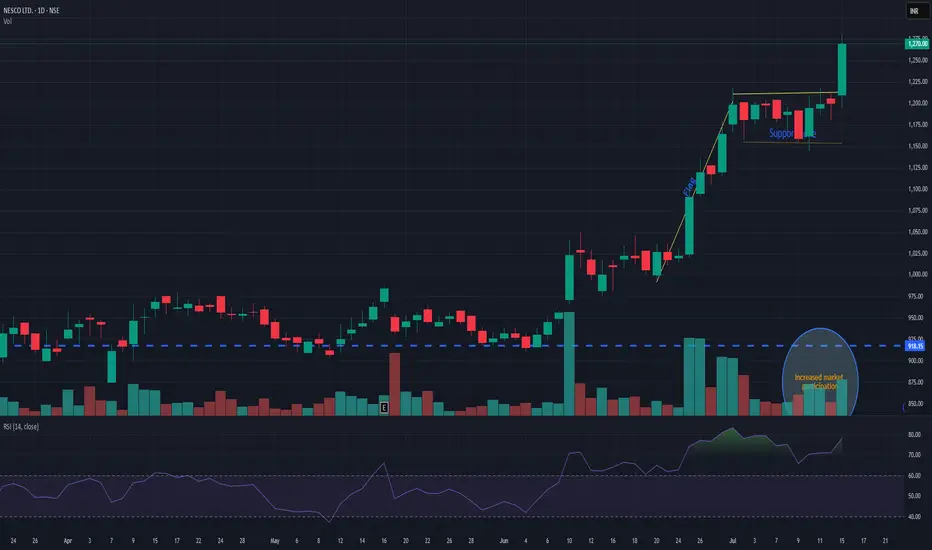
NESCONESCO giving flag pattern breakout with decent volume. Support is seen nr 1180. while pole initiation can be seen near 1010. Currently trading near 1270. It has a potential for new momentum. Keep it on radar.
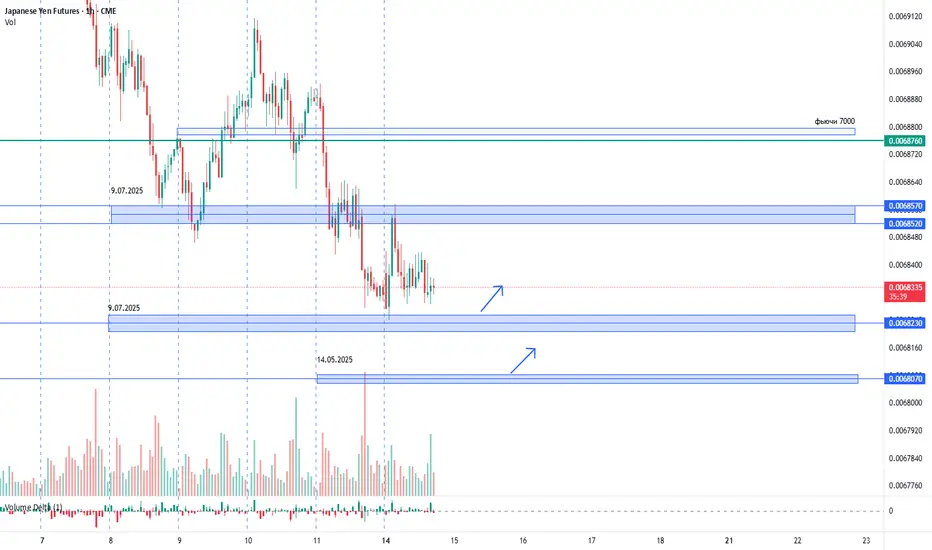
USDJPY. 14.07.2025. The plan for the next few days.The nearest interesting resistance zones have already been worked out at night and have given a good reaction. Let's mark the others where we can expect a reaction. It's not certain that there will be a major reversal, but I believe we will see a correction that can be monetized. We are waiting for a reaction and looking for an entry point.
The post will be adjusted based on changes.
Don't forget to click on the Rocket! =)
MAMATA - Head & Shoulder patternComment below what you observe in the chart.
All details are given on chart for educational purpose only. If you like the analyses please do share it with your friends, like and follow me for more such interesting charts.
Disc - Am not a SEBI registered analyst. Please do your own analyses before taking position. Details provided on chart is only for educational purposes and not a trading recommendation

EURUSD TRADES BEARISH
Last week, due to a fail of holding above the 1.18000 level, we saw a huge 1-hour decline of 0.39% on big selling volumes, which is not typical for such instruments as EURUSD. Since that time, the price has been moving within a descending channel and has formed a possible pennant yesterday. All of the factors "vote" for going bearish in this asset.
So, what will be the possible scenario? We may go market sell right immediately, or wait till the breakout of the pennant pattern. In this case we may set
🔽 a sell stop order at 1.17400 with
❌a stop loss at 1.17670 and
🤑a take profit at 1.16915
Additionally, EURUSD may go even further downstairs, next to a 1.16000 support level. For this case we may preserve some minor part of our position with a take profit set nearby this level.

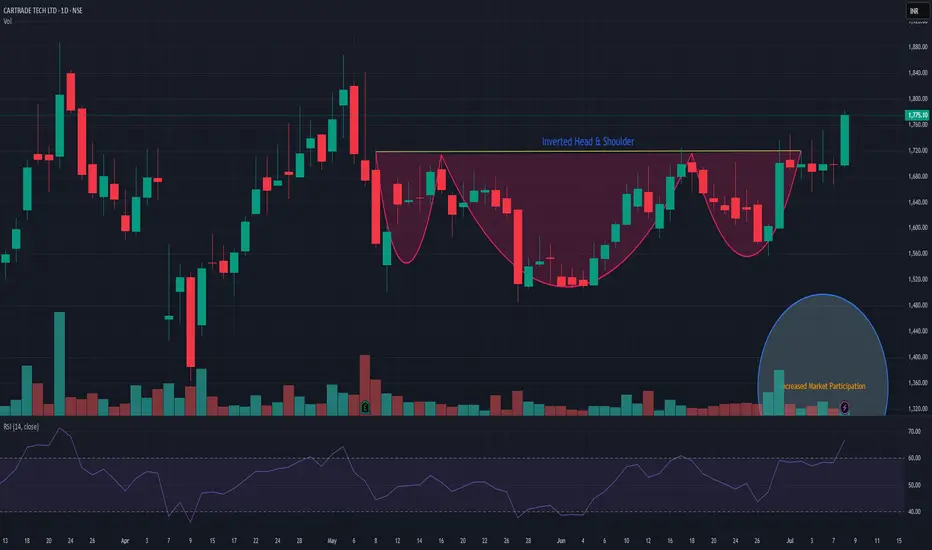
CARTRADECARTRADe is showing strength and has given Inverted head & Shoulder breakout with decent market participation. support is near 1620. It has a potential to go up! Keep it on radar. Closing below 1620 may change my view.
TRENDLINE BREAKOUT [LONG]In this analysis we're focusing on 4H timeframe. As we know that price move impulse toward upside and break trendline, now I'm waiting for retracement. Once price reach my zone and give any type of bullish confirmation than we'll execute our trade. This is a higher time frame analysis and key levels. Let's analyze more deeply into smaller time frame and potential outcomes.
Always use stoploss for your trade.
Always use proper money management and proper risk to reward ratio.
#XAUUSD 4H Technical Analysis Expected Move.
SWING IDEA - JK LAKSHMI CEMENT JK Lakshmi Cement , a key player in India’s cement sector under the JK Group showing strong technical confluence making this a swing-worthy setup.
Reasons are listed below :
Formation of a bullish engulfing candle on the weekly chart, indicating a potential trend reversal
Strong support from the 50-week EMA , reinforcing medium-term trend strength
Breakout from a consolidation range that lasted over a year, suggesting renewed momentum
Inverse Head & Shoulders breakout , a classic bullish pattern
Target - 1000
Stoploss - weekly close below 795
DISCLAIMER -
Decisions to buy, sell, hold or trade in securities, commodities and other investments involve risk and are best made based on the advice of qualified financial professionals. Any trading in securities or other investments involves a risk of substantial losses. The practice of "Day Trading" involves particularly high risks and can cause you to lose substantial sums of money. Before undertaking any trading program, you should consult a qualified financial professional. Please consider carefully whether such trading is suitable for you in light of your financial condition and ability to bear financial risks. Under no circumstances shall we be liable for any loss or damage you or anyone else incurs as a result of any trading or investment activity that you or anyone else engages in based on any information or material you receive through TradingView or our services.
@visionary.growth.insights
