Bitcoin Daily Analysis - February 4, 2026
Institutional Volume Analysis Using Cantillon Suite
Market Structure: BEARISH
Current price has broken below the anchored VWAP (purple line at ~$97k) and is trading 13.39% below the Point of Control. The structure remains bearish until price can reclaim VWAP with conviction.
Key Observation: Price is NOT in Value Area (dashboard shows "NO"), which indicates we're trading outside the institutional consensus range. This creates two scenarios: either mean reversion back to VA, or continued distribution to lower levels.
Volume Profile Breakdown
Point of Control (POC): The histogram on the left shows peak volume concentration around $88,000. This represents the price level where the most aggressive institutional trading occurred during this swing period.
Current Distance from POC: -13.39%
This is significant because price is now trading well below where the majority of volume transacted. Statistically, price tends to gravitate back toward POC over time—this is the "fair value" concept institutions use.
Volume Distribution:
Heavy volume cluster: $88k-$112k (the thick blue bars)
Low volume node: $76k-$84k (thin profile area)
High volume node: $100k-$108k (institutional accumulation zone)
Critical Levels
Support Zones:
$76,000 - $78,000 (Current area)
This appears to be the lower boundary of the current price action. Notice the lack of volume profile bars here—this is a low volume node, meaning price moved through this area quickly in the past without much participation. These zones can act as temporary support but are prone to fast moves in either direction.
$72,000 - $74,000 (Next major support)
If current support fails, the next logical institutional level sits around $72k based on previous swing lows visible on the chart.
Resistance Zones:
$88,000 (POC - Primary Target)
This is where the most volume traded. Any bounce from current levels should target this zone first. It represents institutional consensus value and acts as a magnet for price.
$97,000 (Anchored VWAP)
The purple line represents the volume-weighted average price anchored to the swing low. This is a critical mean reversion target. Institutional traders use VWAP as a benchmark—trading below it indicates we're in a discount zone.
$112,000 (Previous Swing High / Value Area Top)
The horizontal line at this level marks both a previous high and the upper boundary of where 70% of volume traded during the bull move.
Liquidity Sweep Analysis
The red "X" markers throughout the chart indicate liquidity grabs—moments where price spiked to stop out positioned traders before reversing. Notice the cluster of sweeps:
Multiple sweeps between $104k-$108k during the topping process
Recent sweep at $88k before the breakdown
Fresh sweep just occurred below $76k (current level)
What this means: The sweep below $76k suggests retail stop losses have been triggered. This is often—but not always—followed by a reversal as institutions accumulate the liquidity they just harvested.
Anchored VWAP Behavior
The purple VWAP line has been trending downward since the October highs. Key observations:
Price crossed below VWAP in late November at ~$98k
Failed to reclaim it during the December rally to $100k
Currently 21% below VWAP at $76k
Historical behavior: When Bitcoin trades more than 15% below VWAP on the daily timeframe, mean reversion typically occurs within 5-14 days. We're currently at 21% deviation, suggesting either:
An oversold bounce is imminent, OR
The trend is strong enough to override mean reversion (bearish continuation)
Scenario Planning
Bullish Case (Bounce Scenario):
Trigger: Daily close above $80,000 with increasing volume
Target sequence:
First target: $88,000 (POC) - 16% move
Second target: $97,000 (VWAP) - 27% move
Extended target: $104,000 (previous support-turned-resistance)
Confirmation needed:
Higher daily close
Volume expansion on the bounce
Reclaim of $80k level with follow-through
Probability: Moderate (40-50%)
We're at a low volume node (fast moves possible)
Significant deviation from VWAP (mean reversion due)
Fresh liquidity sweep completed
Bearish Case (Continued Distribution):
Trigger: Daily close below $75,000
Target sequence:
First target: $72,000 (next support cluster)
Second target: $68,000 (previous 2024 high / psychological level)
Extended target: $64,000 (unfilled gap from 2024)
Confirmation signals:
Break of current low with increasing volume
No meaningful bounce from current levels within 48 hours
VWAP continues sloping downward
Probability: Moderate-High (50-60%)
Structure remains bearish (below VWAP)
No signs of institutional accumulation yet
Multiple failed rally attempts since October
What Institutions Are Watching
Based on volume profile and VWAP analysis, institutional traders likely have the following framework:
Accumulation Zone: $72k-$78k (current area + next support)
This is where they'd build positions if they believe the macro trend remains bullish. Low volume nodes allow for better fill prices without moving the market.
Distribution Complete: Above $100k
The repeated rejection at $108k-$112k with heavy volume suggests institutional distribution occurred there. They're unlikely to defend those levels aggressively.
Neutral Zone: $88k-$97k (POC to VWAP)
If price returns to this range, it represents fair value. Expect choppy, range-bound trading as buyers and sellers reach equilibrium.
Time Decay Consideration
We're now 3 months into this decline from the October highs. Historical patterns suggest:
Corrections lasting 2-4 months typically resolve with either capitulation (one final flush) or reversal
We're in the window where a decision point is approaching
The longer we stay below VWAP, the more it acts as resistance rather than support
Risk Management Framework
For traders considering positions at current levels:
Long positions:
Entry: Current ($76k) or on bounce confirmation ($80k+)
Stop: Below $72k (invalidation of support thesis)
Target: $88k minimum (POC), $97k extended (VWAP)
Risk/Reward: 2:1 to 5:1 depending on entry
Short positions:
Entry: Rejection at $88k-$90k (if we bounce first)
Stop: Above $97k (VWAP reclaim = trend change)
Target: Retest of $76k or breakdown to $72k
Risk/Reward: 1.5:1 to 3:1
No position:
Wait for daily close above $88k (bullish confirmation), OR
Wait for daily close below $72k (bearish continuation)
Sometimes the best trade is no trade
Final Assessment
Bitcoin is at a critical juncture. The 21% deviation from VWAP suggests we're either approaching a significant low or entering a deeper correction phase. The volume profile shows institutional activity concentrated far above current prices ($88k-$112k), creating a "value gap" that typically gets filled over time.
The fresh liquidity sweep below $76k is noteworthy—it could represent the final shakeout before a bounce, or simply a pause in a larger downtrend.
Key level to watch: $88,000 POC. If price can reclaim and hold this level, it would signal institutional buyers have stepped in. If we fail to reach it on the next bounce, the bearish structure remains intact.
Next 48-72 hours are critical for determining which scenario plays out.
Disclaimer: This analysis is for educational purposes only and represents one interpretation of market structure using institutional volume analysis. Markets are probabilistic, not deterministic. Always conduct your own research and manage risk appropriately.
Volumeprofileanalysis

CL: Crude Oil at a Crossroads as Geopolitics Meet Key LevelsRecent Sentiment and Key Headlines Driving Crude
Crude oil sentiment over recent weeks has been shaped by a renewed mix of geopolitical risk and shifting expectations around global supply discipline. Headlines tied to Venezuela and Iran have been particularly influential, adding a layer of risk premium back into the market after a prolonged period of bearish positioning.
In Iran, renewed domestic unrest has been a notable catalyst. Protests that emerged in late December were initially sparked by economic pressures, including currency weakness, elevated inflation, and deteriorating living standards. As demonstrations spread across several major cities, concerns shifted from purely domestic stability toward potential implications for energy production and exports. While Iranian crude flows have not seen immediate disruption, the market has reacted to the increased uncertainty around enforcement of sanctions, internal security priorities, and the broader risk of escalation in an already fragile region.
Venezuela remains another key variable. Ongoing questions around sanctions compliance, export licenses, and the sustainability of recent production gains have kept traders cautious about assuming incremental supply will remain consistent. Any tightening of enforcement or breakdown in negotiations could quickly alter expectations, particularly given the market’s sensitivity to marginal barrel availability.
Beyond geopolitics, crude continues to trade against a mixed macro backdrop. Global growth expectations remain uneven, with slowing industrial activity in some economies offset by resilient consumption elsewhere. At the same time, OPEC plus communication has reinforced a willingness to manage supply if downside pressure accelerates. Together, these factors have kept sentiment reactive and highly responsive to both headlines and technically defined levels rather than driven by a clear fundamental trend.
What the market has done
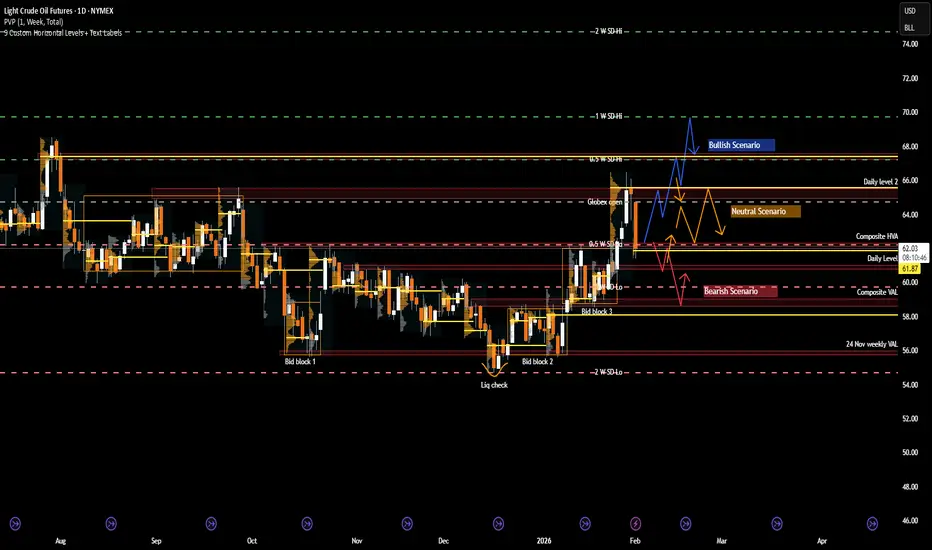
• In November 2025, the market was in a grind trend down to bid block 1, where there was a liquidity check and buyers responded by holding the 56 level.
• Since December, the market has been in a block step trend up due to improving risk sentiment, renewed geopolitical premium, and reduced willingness by sellers to press below established value.
• In the past week, the market imbalanced out of bid block 3 above the 62.4 area (the composite HVA) and rotated higher toward the 65 area at daily level 2. This move coincided with a noticeable rise in geopolitical risk premium in oil markets as tensions between the U.S. and Iran escalated. Markets were responding to reports that the U.S. was considering possible military action if Iran did not negotiate a settlement on key issues, which was interpreted by traders as increasing the chance of supply disruption in the Persian Gulf. This elevated risk pricing helped push crude higher into the 65 area as participants priced in the possibility that instability could affect exports or shipping routes through the Strait of Hormuz. During the same period, there were also reports that Iran had announced live-fire exercises in the Strait of Hormuz, a key oil chokepoint, reinforcing those risk premiums even though no actual supply disruption occurred. The combination of geopolitical headlines and elevated risk appetite drove sellers to defend higher levels only after the initial breakout, leading the market back down toward 62.5 where responsive orders re-entered.
• Sellers responded by pushing price back down toward the 62.5 area, which corresponds with the weekly 0.5 SD low, signaling responsive selling rather than initiative downside continuation. This pullback was supported by an easing of the geopolitical risk premium that had driven the prior breakout. Over the weekend, no U.S. strike on Iran actually took place, and comments from U.S. leadership over the weekend suggested that Iran and Washington were “seriously talking” about negotiations rather than immediate military action. These remarks reduced the acute fear of an imminent strike that had been pushing oil toward multi-month highs late last week. As a result, the risk premium priced into crude unwound somewhat when markets reopened, and prices retraced back toward the 62.5 area as traders reassessed the likelihood of a near-term supply disruption.
What to expect in the coming weeks
The 62.5 area, which marks the level where the market imbalanced out of bid block 3 last week, remains the key level to monitor.
Bullish Scenario
• If the market holds above the 62.5 area, expect a rotation back up toward the 66 area (daily level 2), where sellers are likely to respond initially.
• If sellers fail to regain control at 66, the market could extend higher toward the 67.5 area, which aligns with the 28 Jul 2025 VPOC and the weekly 0.5 SD high.
• Acceptance above that zone would open the door for a test of the 70 area, corresponding with the weekly 1.0 SD high and a more pronounced shift in medium term structure.
Neutral Scenario
• If buyers defend the 62.5 area but sellers respond firmly at 66, expect a two-way auction to develop.
• In this case, price is likely to re- establish value and work through the repair of the previous week’s LVA, favoring rotational trade rather than trend continuation.
Bearish Scenario
• If buyers fail to defend the 62.5 area, expect a move back down into bid block 3 toward 59.7, which aligns with the weekly 1.0 SD low.
• Further downside could test the 59 area, defined by the bid block 3 low and the CVAL, where buyers are expected to respond and attempt to stabilize price.
Conclusion
Crude oil is currently balancing well defined technical structure against an evolving geopolitical backdrop. Risk premiums re-entered the market as unrest in Iran, U.S. rhetoric around a potential strike, and Iran’s live firing exercises near the Strait of Hormuz raised concerns about supply disruption, even though no strike ultimately materialized. The absence of escalation over the weekend led to some unwinding of that premium, reinforcing the recent pullback as responsive rather than initiative selling. At the same time, Venezuela remains a moderating variable, with questions around sanctions enforcement and incremental supply limiting follow through on both extremes.
From a technical perspective, price remains anchored around the 62.5 area, which continues to act as the primary pivot for directional intent. Acceptance above this level would favor renewed upside rotation toward higher distribution targets, while failure to hold would suggest a return into lower value and corrective trade. As geopolitical headlines continue to ebb and flow, traders should remain focused on how price responds at key levels.
If you found this analysis helpful, consider sharing your own levels or scenarios and join the discussion below
Disclaimer: This is not financial advice. Analysis is for educational purposes only; trade your own plan and manage risk.
Acronyms:
C - Composite
w - Weekly
m - Monthly
VAH - Value Area High
VAL - Value Area Low
VPOC - Volume Point of Control
LVN - Low Value Node
HVN - High Value Node
LVA - Low Value Area
SP - Single print
Bitcoin Volume Analysis: Institutional Positioning & AVWAP RegimUnderstanding Volume-Based Market Structure
This analysis examines Bitcoin through the lens of institutional volume flow, anchored VWAP positioning, and volume profile theory. The goal is to demonstrate how professional traders identify regime changes and manage risk using volume-based methodologies.
Current Market Structure: Bearish AVWAP Regime
Key Metrics:
Structure: BEARISH
VWAP Distance: -2.65%
POC Distance: +0.7%
Price: $88,240
What Does "Bearish Regime" Mean?
In volume-based trading, we classify market regimes by price relationship to anchored VWAP (Volume Weighted Average Price). When price trades below VWAP, institutional positioning favors distribution over accumulation. This doesn't predict direction—it describes the current structural bias.
Educational Principle: AVWAP acts as a dynamic fair value reference. Price above VWAP suggests institutional sponsorship (accumulation regime). Price below VWAP indicates institutional distribution or profit-taking.
Volume Profile Analysis: Understanding Institutional Positioning
The volume profile histogram (left side of chart) reveals where significant volume transacted historically:
High Volume Nodes (HVN)
90,000 level: Major volume concentration (olive/brown zone)
87,000-88,000: Current consolidation building volume
High volume nodes represent equilibrium zones where buyers and sellers reached extended agreement. These levels act as magnets for price—we often see price return to test these zones after trending moves.
Low Volume Nodes (LVN)
93,000-96,000: Minimal volume overhead
85,000-86,000: Volume gap below
Low volume areas create rapid price movement when tested, as there's minimal interest to slow momentum. These become measured move targets.
Point of Control (POC) Analysis
Current POC: ~88,600 (marked by white horizontal line through volume profile)
The Point of Control represents the price level with the highest volume during the measurement period. Currently, price is trading just below POC, which has important structural implications:
When price trades at or near POC while in a bearish AVWAP regime, we're in a decision zone. This represents the "fairest" price based on historical volume—neither extended nor oversold. Direction from here depends on whether accumulation or distribution dominates.
Bitcoin currently exhibits bearish regime characteristics with emerging divergence signals. The prudent approach involves:
Patience: Wait for regime confirmation before directional commitment
Preparation: Identify key levels where probability shifts (90,500 upside, 86,500 downside)
Process: Follow volume structure regardless of bias or hope
The market will resolve this structure—our job is to recognize the resolution when it occurs, not predict it in advance.

XAUUSD – Brian | M45 Technical Outlook — Buyers Still in Control Above 5,200
Gold continues to trade firmly above the 5,000 milestone, with price action confirming strong bullish acceptance at higher levels. On the M45 timeframe, the market remains in an expansion phase, supported by aggressive buying volume and well-defended value areas.
Current conditions suggest that buyers are still in control, with pullbacks being absorbed rather than sold into. This behavior typically characterises a strong trending environment rather than a distribution phase.
Macro Context (Brief Overview)
From a fundamental perspective, institutional positioning remains stable, with no signs of defensive de-risking despite gold trading at record highs. At the same time, the market remains sensitive to upcoming macro events, which may introduce short-term volatility but have not altered the broader bullish bias so far.
As long as uncertainty persists and risk appetite fluctuates, gold continues to benefit from its role as a strategic hedge.
Market Structure & Volume Context (M45)
The current structure on M45 remains constructive:
Price is holding above the rising trendline.
Buying volume remains elevated, indicating strong demand and reduced willingness to sell.
Pullbacks continue to develop in a corrective manner rather than impulsive declines.
In strong trends, high volume combined with shallow retracements often signals continuation rather than exhaustion.
Key Technical Zones to Watch
Based on the chart structure and volume profile, several zones stand out:
Upside Reaction Zone
5,385: A major resistance and extension area where price may pause, consolidate, or react before deciding the next directional leg.
Primary Value Support
POC + VAH: 5,243 – 5,347
This is the most critical zone for continuation. Acceptance and holding within this range would reinforce the bullish structure.
Secondary Support
VAL: 5,163 – 5,168
A deeper pullback into this zone would still be considered corrective as long as price stabilises and reclaims value.
Deeper Structural Support
POC: 5,086 – 5,091
This level represents broader value and would likely come into play only during heightened volatility.
Forward Expectations & Bias
Primary bias: Bullish continuation while price holds above value zones
Pullbacks are currently viewed as opportunities for re-accumulation rather than trend reversal.
Short-term volatility is expected, but structure remains the key reference point rather than individual candles.
Strong trends rarely move in straight lines. The ability of gold to hold value during pauses continues to support the case for further upside.
Refer to the accompanying chart for a detailed view of value areas, trend structure, and projected paths.
Follow the TradingView channel to get early structure updates and join the discussion on key market levels.

BTCUSD: Institutional Structure vs. Intraday WeaknessThe Technical Conflict As we head into today's volatility, Bitcoin is showing a distinct divergence compared to the broader market. While indices and metals are pushing highs, BTC is displaying a conflict between its high-timeframe zones and immediate price action.
1. The 4H Trend: Intraday Weakness On the 4H chart, the structure is currently labeled BEARISH.
Lower Highs: The price has lost the bullish momentum seen earlier in the month and is struggling to reclaim key levels.
Momentum: Selling pressure remains dominant in the short term, with price action holding below the key moving averages.
The Signal: Until the chart prints a new structural "Higher High" or a reversal signal, the path of least resistance on this timeframe remains heavy.
2. The Weekly Context (The "Trap"?) Despite the short-term weakness, the asset is sitting in a known high-timeframe support zone (88k-89k).
The Conflict: We have a Bearish 4H trend colliding directly with Weekly historical support.
This often creates choppy conditions. Aggressive traders might see value here, but conservative analysis suggests waiting for the 4H trend to align with the higher timeframe support before assuming a bottom is in.
3. Key Levels to Watch
Resistance: The 92,000 - 93,000 zone. Any rally into this area is likely a retest of resistance until proven otherwise.
Support: The 87,000 level (Previous Day Low). This is the invalidation point for the weekly support thesis.
Summary & Plan Patience is key. The prudent approach is to wait for the 4H trend labels to flip back to BULLISH. Attempting to buy this dip before a confirmed structural change is fighting the immediate trend.
Watch for a confirmed break above the local moving averages to signal that buyers have regained control.

Richtech Robotics Inc. (RR) 1DRR broke the descending trendline in September 2025, followed by an impulsive upside move, and the current price action represents a corrective phase rather than a structural breakdown. Price is pulling back into a key support area where the 0.786 Fibonacci level aligns with diagonal support, the MA200 and the volume profile, making this zone technically strong and well-defined. On the monthly timeframe, indicators maintain a buy-side bias and moving averages support trend continuation, with no signs of a new downtrend forming. Fundamentally, the company remains in a growth phase, generating revenue across multiple robotics segments, paying no dividends and reinvesting cash flows into expansion, while revenue expectations for 2026 remain above current levels, consistent with a high-risk growth profile. The base scenario assumes support holding at the Fibo 0.786 zone with a continuation toward 4.85, 6.06 and 8.08, and invalidation only on a decisive break below support. The structure is already set, now the market decides the timing.

Technical Analysis – Meta Platforms Inc (META)Meta Platforms needs little introduction. The company continues to show strong long-term growth and has been one of the best-performing stocks in the market over the past few years.
The stock comes from a major bullish phase that started in 2023, during which it gained over +600%, with healthy pullbacks occurring within the dominant uptrend.
Market Structure & Volume Analysis
Over the past few months, the stock has entered a retracement phase, which remains technically well-controlled.
Key points:
the correction was contained at the first Point of Control (POC_1), calculated using volume from the top distribution area
price reacted both at POC_1 and at the ascending weekly trendline
two strong bullish reactions occurred in this confluence area (yellow circles), confirming it as a key support zone
Bullish Scenario
For a bullish continuation scenario, price needs to:
break above the descending weekly trendline, which is currently being challenged
ideally confirm the breakout with a pullback (retest), turning the trendline into dynamic support
A successful retest would strengthen the probability of trend continuation in line with the primary bullish trend.
⚠️ Trading Note
As long as price holds above POC_1 and the ascending weekly trendline, the broader bullish bias remains intact.
Failure to decisively break the descending weekly trendline would keep the stock in a consolidation/correction phase.

Technical Analysis – Redwire Corp (RDW)The stock RDW , which has been listed relatively recently, showed an interesting technical structure shortly after its IPO.
In the early trading phase, price action formed a classic Cup & Handle continuation pattern, later confirmed by a bullish breakout that led to a strong impulsive move, nearly doubling the price.
Market Structure
After setting a significant high, the stock entered a corrective phase, characterized by:
lower highs
lower lows
a short- to medium-term bearish market structure
From a volume and market profile perspective:
price is currently holding above the POC (Point of Control), a key level representing the area of highest traded volume
the stock is trading just below a descending daily trendline, acting as a dynamic resistance
Bullish Scenario
A long setup becomes technically valid only after a confirmed breakout above the daily descending trendline.
Key conditions:
clean breakout of the trendline
decreasing or controlled volume, suggesting supply absorption rather than emotional buying
potential retest of the broken trendline as dynamic support
⚠️ Trading Note
Until the bearish structure is broken, the stock remains in a corrective/consolidation phase.
A confirmed breakout would be the key signal to reassess bullish momentum and directional strength.

NG: Natural Gas Surge as the Polar Vortex Tests the Upper Range Market Overview and Key Drivers
Natural gas futures are among the most seasonally sensitive products in the commodity markets, with prices largely driven by predictable demand cycles and unpredictable weather shocks. Demand typically begins to build in late summer, with prices often finding seasonal lows between July and August before rallying into September and October as the market prices in winter heating demand. Volatility generally accelerates from November through February, when cold weather events, storage draws, and forecast revisions can rapidly shift sentiment. As winter demand fades, prices often soften into March and April, followed by a weaker period in May and June as heating demand subsides and storage injections resume.
Beyond seasonality, traders closely monitor weekly EIA storage reports, temperature forecasts measured through heating degree days, production trends, and LNG export flows. Short term price discovery is frequently driven by changes in weather models, while medium term direction is shaped by whether storage levels and production trends confirm or contradict seasonal expectations.
Natural gas does not maintain a consistent correlation with other energy products, as pricing is driven more by regional supply and demand than global macro flows. That said, broader risk sentiment and energy sector positioning can still influence short term price behavior. Volatility remains elevated, especially during winter, when forecast changes can reprice the market quickly.
Over the past week, natural gas prices reacted sharply to weather driven headlines. A polar vortex warning across large parts of the United States triggered a surge in short term demand expectations, leading to an aggressive upside move. This rally pushed price into the upper portion of the broader multi-year range.
What the market has done
• The market remains within a larger multi-year range, with clearly defined weekly resistance in the 5.8 to 6.0 area and weekly support near the 3.2 area.
• Since the end of winter in 2025, price has respected a block step trend down, consistently rotating lower after each failed rally attempt.
• The market began its seasonal rally in September, driven by expectations of increased winter heating demand and tightening balances.
• Sellers responded aggressively at the start of December at offer block 2, auctioning price lower and pushing the market back toward the 3.2 weekly support area.
• In the past week, a polar vortex weather warning across the United States triggered a sharp upside spike, driving price toward the 5.6 area, aligning with offer block 1 near the top of the multi-year range and directly into the March 2025 mVAH.
What to expect in the coming weeks
The key level to monitor remains the 5.0 area, which aligns with daily level 1, the March mVAL, and the April mVAH. This zone is likely to act as the primary decision point for both buyers and sellers as the winter season progresses.
Bullish scenario
• If the market holds above the previous week’s close at 5.278, continued momentum could carry price higher toward the 6.0 area.
• The 6.0 level aligns with weekly resistance and the upper boundary of the multi year range.
• Sellers are expected to respond aggressively in this area, potentially leading to rotational or rejection based price action rather than sustained breakout behavior.
Neutral scenario
• Price may balance between the 5.0 area and the 5.75 zone for the remainder of the winter season.
• This range represents a region of prior acceptance, with 5.75 aligning with weekly resistance and the March 2025 mVAH.
• In this scenario, traders should expect two sided trade and rotational behavior rather than directional continuation.
Bearish scenario
• If buyers fail to hold price above the 5.0 area, long liquidation could accelerate.
• A downside move could target the SOC, repairing single prints left behind during the recent weather driven rally.
• Buyers are expected to respond near the 4.47 and 4.25 area, which aligns with the December 2025 VPOC and daily level 2.
Conclusion
Natural gas remains a headline driven market where technical structure and macro fundamentals must be evaluated together. While seasonal demand and extreme weather events continue to support volatility, the broader market remains constrained within a well defined multi year range. From a technical perspective, acceptance or rejection around the 5.0 area will likely dictate whether price continues higher toward weekly resistance or rotates lower to repair unfinished auctions. Fundamentally, traders should remain alert to shifts in weather forecasts, storage trends, and production data, as these factors can quickly invalidate technical setups. As winter unfolds, traders will need to respect the speed of rotations and the market’s tendency to punish late positioning near range extremes.
If you found this analysis helpful, consider sharing your own levels or scenarios and join the discussion.
Disclaimer: This is not financial advice. Analysis is for educational purposes only; trade your own plan and manage risk.
Acronyms:
C - Composite
w - Weekly
m - Monthly
VAH - Value Area High
VAL - Value Area Low
VPOC - Volume Point of Control
LVN - Low Value Node
HVN - High Value Node
LVA - Low Value Area
SP - Single print

ES (S&P 500 E-mini) – January 26 Day Session OutlookES (S&P 500 E-mini) – January 26 Day Session Outlook
Timeframe: 15m
Current Price Area: ~6946
Market Context
ES is trading inside a balanced range after a sharp downside liquidation and recovery. Price is currently rotating around high-volume acceptance near 6945–6950, with clear resistance stacked above 6958–6965 and responsive buyers previously defending 6925–6932.
This is a range-to-range auction day unless we see strong initiative volume outside value.
🔹 Key Levels
Resistance / Supply: 6958 – 6965
Acceptance / Pivot: 6945 – 6950 (POC-like behavior)
Support / Demand: 6930 – 6925
Range Low (failure area): 6915 – 6908
📊 Trade Plan – Day Session
9:30 AM – 12:00 PM (Opening Rotation)
Primary Expectation: Responsive trade off extremes, rotation through value.
Trade Idea 1 – Short from Upper Range
Entry: 6958 – 6965
Target: 6946 → 6935
Stop Loss: 6972
Logic: Prior rejection + heavy volume node → sellers defend value high
Alternate Long (Only if Acceptance Holds)
Entry: 6930 – 6935
Target: 6948 → 6955
Stop Loss: 6922
Logic: Buyers defend prior demand and rotate back to POC
12:00 PM – 4:00 PM (Afternoon Continuation / Fade)
Primary Expectation: Either continuation to range extremes or late-day fade.
Trade Idea 2 – Afternoon Long (If Hold Above Value)
Entry: 6940 – 6946
Target: 6958 → 6968
Stop Loss: 6932
Logic: Holding above value = bullish acceptance into close
Failure Scenario – Breakdown Short
Entry: Acceptance below 6928
Target: 6915 → 6905
Stop Loss: 6940
Logic: Loss of demand → liquidation toward prior lows
This is not financial advice. For educational purposes only.

Bearish Structure Holding – Key Rejection at VA High + LiquidityEthereum continues to respect the bearish regime on the 4h timeframe.
Current setup highlights:
• Structure: BEARISH (price below anchored VWAP, sloping down)
• Price rejected hard at Value Area High (~3,340–3,350) with multiple liquidity sweeps (red "x" markers) confirming distribution
• POC Distance: -0.48% → trading just below the control point, weak bullish defense
• In VA? YES → but failed to hold above midline/POC → classic "trapped longs" scenario
• Multiple absorption attempts (ABS labels) at the highs failed to produce follow-through → sellers still in control
• Clean bearish FVGs filled on the way down, now creating new inefficiency below 3,000
Key levels to watch:
Resistance: VA High ~3,340 → retest here would be high-probability short zone
Support: Red macro level ~2,964–2,975 (previous swing low + unfilled FVG base)
Next downside target: 2,850–2,900 if 2,964 breaks (previous HVN area)
Confluence:
- Negative swing delta
- Repeated liquidity grabs above structure
- No reclaim of AVWAP despite several attempts
Bias: Bearish continuation until price reclaims AVWAP or VA high with strong volume + positive delta flip.
Invalidation: Close above 3,400 on 4h with conviction volume.
Always manage risk – this is not financial advice.
What do you think – will ETH hold 2,964 or are we heading lower first? Drop your levels below 👇

Bitcoin (BTC): Why $88k is the "Institutional Floor"Bitcoin is testing a critical structure level at $89,000.
Looking at the Cantillon Structure chart above, we can see why this zone is defending:
Liquidity Trap ('x'): We just printed a 'Liquidity Sweep' marker at the lows ($88,200). Historically, when we see an 'x' followed by a reclaim of the range, it signals a bear trap.
The AVWAP Check: Price is currently fighting to reclaim the Purple Institutional Mean. A close back above $92,000 confirms the trend resumption.
The Trade Setup:
Bullish Confirmation: We need a 4H close above $90,500 to validate the trap.
Invalidation: A loss of the $88,000 sweep low invalidates the structure.
Institutional Note: While price structure looks supportive, traders should watch Volume Delta carefully here. If price rises but Delta remains negative (Divergence), this bounce is likely a fake-out.
I track these Delta signals daily in my morning briefing. See Signature for details.

DOGE: Gravity Takes Over (Lost Value & Heavy Structure)
While the broader market chops, DOGE is showing significant relative weakness. The chart highlights a classic "Distribution and Flush" sequence. Price spent weeks chopping around the Red POC line (Fair Value ~$0.139) before finally losing that support level.
The Technicals (Cantillon Lite):
Market Structure: BEARISH
Price is strictly respecting the Institutional Mean (Purple AVWAP) as resistance. Every attempt to rally back to this line has been sold into.
The separation between price and the Purple Line is widening, which often indicates increasing bearish momentum.
Volume Profile: Lost Value
The most critical observation here is the Red Line (POC) at $0.139.
We are now trading significantly below this high-volume node. This means the vast majority of recent buyers are underwater.
This creates a "supply overhead" dynamic—any rally back toward $0.139 will likely be met by trapped holders trying to break even.
Liquidity:
Notice the 'x' marker at the recent swing low (0.125). We just swept this level.
Often, a sweep of the lows leads to a relief bounce. However, without a structural reclaim, this is just a "dead cat bounce."
The Game Plan: DOGE is in a precarious spot. The "Easy Money" phase is over.
The Bearish Play: The 0.138 - 0.140 zone (POC + previous support) is now a "Short on Retest" zone. If price rallies there and rejects, it confirms the downtrend.
The Bullish Path: To be interested in longs, we need to see price not just sweep a low, but reclaim the Purple AVWAP. Until then, the trend is down.
Verdict: Bearish. DOGE has lost its fair value shelf. Unless it can quickly reclaim 0.140, the path of least resistance is lower. I am watching for a retest of the breakdown level to deploy shorts.

Update: The Deviation is Resolved (Back to Fair Value)
In my previous analysis, we warned about the "Bull Trap" developing on SUI. The structure was showing weakness despite the price pushing higher. That setup played out perfectly: SUI rejected the highs and flushed back down, erasing the recent gains.
Current Situation (The "Lite" View): Price has now returned to the "Scene of the Crime"—the Point of Control (POC).
Market Structure: BEARISH 🔴
SUI is trading firmly below the Institutional Mean (Purple AVWAP).
The rally above this line failed to hold, confirming it was a "Deviation" rather than a true breakout.
Volume Profile: Reset to Neutral
Notice how price stopped exactly at the Red Line (POC). This is the "Fair Value" zone where the most volume has traded.
The market is now in "Agreement." The volatility has contracted as buyers and sellers negotiate at this high-volume node (~$1.52).
Liquidity:
The recent highs are marked with small 'x' (Sweeps). These remain the "line in the sand" for bears. Until those highs are reclaimed, lower highs are the expectation.
The Game Plan: We are currently in "No Man's Land" (Chop Zone).
Bearish Continuation: We are looking for a 4H Candle Close below the current consolidation (below the POC). If we lose this $1.52 shelf, the next high-volume node is significantly lower.
Bullish Reclaim: To flip bullish, price must reclaim the Purple AVWAP. A close back above the mean would invalidate the bearish structure.
Verdict: Short-term Neutral / Structural Bearish. The violent move is over. We are now consolidating at fair value. I am staying flat/defensive until SUI picks a direction away from this volume node.

BTC: The Silence Before the Move (Battle for Fair Value)
Bitcoin is currently compressing in a tight range, sitting directly on the highest volume node of the entire consolidation (the Point of Control or POC).
When price hugs the POC (Red Line), it indicates the market is in "Agreement." Buyers and Sellers are transacting at what they perceive to be Fair Value ($91,000 region). However, low volatility periods like this are usually the precursor to a violent expansion.
The Technicals (Cantillon Lite):
Market Structure: BEARISH
Price remains below the Institutional Mean (Purple AVWAP). As long as we are trading below this dynamic resistance, the path of least resistance remains sideways-to-down.
Volume Profile: BALANCED
We are trading strictly inside the Value Area (70% of volume). This is "chop city."
The Red Line (POC) is acting as a magnet. Every attempt to rally or dump is being pulled back to this $91k mean.
Liquidity Sweeps:
Notice the small 'x' markers at the recent lows. These indicate that bears tried to push lower, swept liquidity, and were rejected. There is passive demand sitting just below $88k.
The Game Plan:
This is not a zone for aggressive positioning. The market is waiting for a trigger.
Bullish Scenario: We need a confirmed 4H Candle Close above the Purple AVWAP. That effectively "breaks" the bearish structure and opens the door for a run to the Value Area High.
Bearish Scenario: A loss of the recent "Sweep Lows" (the green 'x' marks around $86k-$88k) would confirm that the passive buyers have been exhausted.
Verdict: Neutral / Watch. The trend is technically bearish (below mean), but the liquidity sweeps suggest the bears are struggling to clear the lows. Wait for the breakout from this value bracket.

PL: Platinum at an Inflection PointWhy Platinum Is Moving
Platinum is a unique metal that sits at the intersection of precious and industrial markets. Unlike gold, which is primarily viewed as a monetary or store of value asset, platinum derives a larger share of its demand from industrial uses. Silver sits between the two, with meaningful industrial demand alongside its role as a monetary metal. These include catalytic converters, chemical processing, hydrogen related technologies, and jewelry. Because of this dual role, platinum tends to be more sensitive to shifts in global growth expectations than gold, while still reacting to macro forces such as inflation, real rates, and currency trends.
From a correlation standpoint, platinum often trades in sympathy with gold and silver during periods of broad commodity strength, but the relationship is not constant. Gold typically leads during risk off environments, while platinum performs best when growth expectations improve and industrial demand increases. In recent months, platinum has begun to decouple from gold, showing relative strength as investors price in tighter physical supply and improving demand narratives. Silver has also participated in this move, but platinum’s advance has been more structurally driven rather than purely momentum based.
Recent sentiment has shifted materially since December 2025. After spending years trapped in a large consolidation range, platinum finally attracted sustained institutional interest. Supply constraints from major producing regions, rising costs of extraction, and renewed interest in platinum as a substitute metal in industrial applications have all contributed to the move higher. The breakout since December 2025 reflects a repricing of long term value rather than a short term speculative spike, which helps explain the persistence of the trend despite periods of volatility.
What the Market has done
• The market has been on a bullish uptrend since markets broke out of a multi year consolidation and accumulation range that lasted from December 2021 to June 2025.
• Markets formed two clear accumulation ranges during the advance, suggesting strong two way trade before higher prices were accepted.
• At the start of December 2025, market compressed against daily level 1, forming bid block 1 as buyers continued to absorb supply.
• Buyers initiated higher from this compression and pushed price to new ATHs in the spot market.
• Sellers responded aggressively at the end of December 2025, resulting in a volatile two way whipsaw and expanded range.
• Over the past two weeks, market volatility has contracted and the overall range has narrowed as the market works to establish a new value area at higher prices.
What to expect in the coming week
Key reference levels remain 2500, which marks the CVAH, and 2330, defined by the 5 Jan wVAH and the 12 Jan wVAL. These levels frame the current auction and provide clarity for upcoming scenarios.
Neutral scenario
• Continued two way balanced rotation between 2500 and 2330 would suggest acceptance of higher prices.
• This behavior would indicate responsive participation from both buyers and sellers rather than initiative control.
• Value may continue to build above prior ranges, reinforcing the broader bullish structure without requiring immediate continuation.
Bearish scenario
• If buyers are unable to defend the 2330 area, the auction is likely to rotate lower in search of demand.
• A move toward 2136.9, which aligns with the 5 Jan wVPOC, would be the first downside repair target.
• Continued acceptance below that level could expose the 2069 area, where the CLVN remains untested.
Bullish scenario
• If the market is able to break and accept above 2500, buyers may regain initiative control.
• Acceptance above the CVAH would signal strength and continuation of price discovery.
• This scenario increases the probability of a move toward new ATHs, particularly if value begins to migrate higher.
Conclusion
Platinum’s breakout is occurring against a backdrop of tightening supply, improving industrial demand expectations, and a broader commodity bid as inflation and growth dynamics remain in focus. While the structural shift higher is notable, history offers an important reminder. The last time platinum entered a parabolic phase in 2008, the move was followed by a 67% drawdown that erased four years of gains in just four months. As price continues to build value at higher levels, respecting both macro drivers and auction behavior will be critical in navigating the weeks ahead.
If you found this analysis useful, feel free to give a boost, comment, or share your own levels and scenarios below.
Disclaimer: This is not financial advice. Analysis is for educational purposes only; trade your own plan and manage risk.
Acronyms:
C - Composite
w - Weekly
VAH - Value Area High
VAL - Value Area Low
VPOC - Volume Point of Control
LVN - Low Value Node
HVN - High Value Node
LVA - Low Value Area
SP - Single print

BTC: Institutional Bulls are Defending the MeanBitcoin is currently painting a textbook Institutional Accumulation structure on the 4H timeframe. While the broader market shows uncertainty, the internal order flow for BTC remains constructive.
Structure is Bullish
The most critical data point on this chart is the Anchored VWAP (Purple Line).
Notice how price reclaimed this level and has successfully held it as dynamic support.
As long as BTC trades above this institutional mean, the trend bias remains Long.
Order Flow is Positive
This is a crucial confirmation. It means the current price action is supported by Net Buying Volume. This isn't just a "low volume float" or short covering; there is actual aggression from buyers supporting this level.
My script fired perfect Green Triangles (Strong Buy) signals at the recent local lows.
Why did these fire? The algorithm detected a Liquidity Sweep (stop run) followed by a reclaim of the Value Area with momentum.
These signals marked the institutional entry, and we are now seeing the follow-through.
We are currently in the Value Area, which often acts as a chop zone. However, with the Bullish Structure and Positive Delta, the path of least resistance is upward.
Watch Zone:
Bullish Invalidation: A sustained close below the Purple AVWAP.
Target: Continuation toward the upper liquidity pools, supported by the buying pressure we see in the Delta.
I do analysis everyday with clear areas of interests so you can focus on trading.

BTC Macro Roadmap: The $110k Institutional Supply ZoneAnalysis: I am currently monitoring the $109k–$116k region as a primary Point of Interest (POI). This zone represents a high-confluence cluster:
Daily Order Block: A clear area of institutional distribution.
Price Imbalance: A Daily Fair Value Gap (FVG) that needs to be filled.
Volume POC: My Anchored Volume Profile shows the heaviest trading volume (Blue POC line) sitting right at $110k.
The Strategy: I am looking to play the current bullish momentum up into this zone (monitoring the 4hr structure). However, upon arrival at $110k, I am shifting to a bearish bias.
Trigger: I will wait for a Lower Timeframe (15-30min) Break of Structure (BOS) to confirm the reversal from said zone above (109-116k)
Target: A rejection here could lead to a deep retracement back toward the $85k–$88k (CYL) support zone.
Disclaimer: Not financial advice (NFA). For educational purposes only. Crypto trading involves significant risk; always manage your risk and wait for confirmation. DYOR.

GOLD: Warning — Price is +2dv Extended
The "Inflation Trade" is crowded. While the narrative for Gold is bullish, the math is flashing a warning sign.
Gold is currently trading +2 Standard Deviations (+2σ) above its institutional mean. Statistically, price cannot sustain this extension without a reversion to value or a time-based consolidation.
We are not chasing longs here. The Risk/Reward is mathematically broken. I am looking for a "Blow-Off Top" or a rejection to fade this move back toward the mean.
Don't chase green candles. Trade the data. Full institutional screener available in the link in my bio.

BTC/USD: Reclaiming the Value Area?
Bitcoin is currently navigating a critical inflection point after establishing a clear trading range over the last few weeks. We are seeing a battle between structural recovery and overhead supply. Here is the technical breakdown of the current setup.
1. Volume Profile & Liquidity
The most immediate observation is that price is trading directly within the High Volume Node (HVN)—the yellow shaded area on the profile.
Significance: This zone represents a region of high agreement between buyers and sellers. The fact that we have reclaimed this area after the capitulation wick in late December suggests that the market is attempting to establish a new "fair value" here.
The "Magnet": As long as we stay within this yellow block, expect chop. The market is comfortable here.
2. Key Levels to Watch
The Pivot (Support): The red horizontal line at ~$87,500 acted as crucial resistance in December and has now successfully flipped into support. The recent bounce from this level confirms that buyers are defending the lower bounds of this range aggressively.
The Ceiling (Resistance): Immediate resistance lies at the range highs near $94,000 (blue line). We saw a rejection here recently, reinforcing this as the breakout level to watch. A clean 4H close above this level would likely open the door for a move toward the psychological $100k barrier.
3. Momentum & Structure
The price action since the start of 2026 has formed a series of higher lows, indicating building bullish pressure. However, we are currently compressing against a dynamic resistance line (purple curve).
Bullish Scenario: We need to see a hold above the current level of ~$91,800 followed by an impulse through the $94k blue line.
Bearish Scenario: If price falls back below the "Golden Zone" of the volume profile (below ~$88k), the probability increases of revisiting the local lows near $84k.
Conclusion
BTC is coiling. The recovery from the late-2025 lows has been constructive, but we are not out of the woods yet. The market is essentially deciding whether this $90k-$92k zone is a launchpad or a distribution shelf.
Patience is key here. Let the range resolve itself before committing to a heavy directional bias.
Enjoyed this perspective? I track these institutional levels daily. Hit the boost button and follow so you don't miss the next setup.

DOGE/USDT — Structure Check
Price: $0.1388 | 4H
The Read
DOGE is in a clear bearish regime. Price sits below the AVWAP with a heavy volume node overhead at $0.150 acting as a ceiling.
That rally to $0.155 earlier this month? Rejected at POC. Textbook.
Current structure:
Regime: Bearish
AVWAP: ~$0.143 (resistance)
POC: $0.150 (major resistance)
Bias: Sell rallies until reclaim
Key Levels
LevelPrice POC Resistance$0.150
AVWAP$0.143 Current$0.1388
Support$0.130
Bottom Line:
BEARISH — No Long Setup
Price below AVWAP. Structure says sell rallies, not buy dips.
Longs need a regime flip first. We're not there yet.
Full entry zones and targets in the daily briefing.

ZB: 30 Year Treasuries Face a Defining Data Week The Long Bond and the Shifting Inflation Narrative
The ZB thirty year Treasury futures contract represents the long end of the United States Treasury yield curve and is primarily driven by expectations around inflation, growth, fiscal policy, and long term interest rate risk. Because of its long duration, ZB is the most sensitive Treasury product to changes in inflation expectations and shifts in term premium. When markets become concerned about persistent inflation or increased Treasury issuance, ZB tends to underperform. When growth risks rise or inflation pressures ease, ZB often attracts defensive demand.
Within the Treasury complex, ZB sits at the far end of the curve, while ZT two year, ZF five year, and ZN ten year futures reflect progressively shorter duration exposures. ZT is most reactive to Federal Reserve policy expectations, ZN tends to balance policy and growth considerations, and ZB expresses longer term confidence or concern about economic stability and inflation control. Over the past few months, sentiment in ZB has improved as inflation has moderated from prior highs and recession risks have remained present but not fully realized. The narrative since late spring has centered on easing tariff fears, slower but resilient growth, and a market that is gradually reassessing how restrictive policy needs to remain over the long run.
This week, macro data will be a major driver. CPI on January 13th, followed by PPI and retail sales on January 14th, will shape near term direction. A miss in CPI or PPI, particularly on core measures, would likely support ZB as it reinforces the idea that long term inflation pressures are cooling, allowing yields to drift lower. A beat in inflation or strong retail sales would pressure ZB lower, as it would revive concerns that growth and pricing power remain too firm for comfort at the long end of the curve.
What the Market has done
• Since bottoming out at the 109'14 area in May 2025 after tariff fears were alleviated, bids have stepped up and the market has steadily reclaimed the April Trump liberation tariff selloff.
• In September 2025, buyers were able to overcome sellers at 116’00, which was daily level 2 and a four month resistance level where sellers had previously defended.
• Subsequently, buyers were able to defend this level until the end of November, when bids slipped and sellers were able to offer prices down through the September 5, 2025 low value area and single print at 115'20 to 114'20.
• Since December, the market has been consolidating sideways within this zone, filling in and repairing the LVA as balance has developed.
What to expect in the coming week
The key level to watch is 115'25 to 116'00, which represents the previous week’s close, the current consolidation block high, and the over-under zone of daily level 2.
Neutral scenario
• Expect the market to continue consolidating in a tight range, potentially between 115'25 and 115'05, as participants wait for clarity from CPI on January 13th and PPI and retail sales on January 14th.
• In this scenario, rotational and mean reverting behavior should dominate, with responsive buyers and sellers active at range extremes.
Bearish scenario
• If the market is unable to accept above 116'00, expect a rotation back down through the consolidation block toward 114'18, which aligns with the range low and weekly one standard deviation low.
• This bearish scenario is likely to be very choppy and difficult to trade, as the market remains in balance within the broader 116 to 114'20 range.
Bullish scenario
• If the market is able to accept above 116'00, price could move up through offer block 1 toward 117'00, which represents the high of offer block 1 and the weekly one standard deviation high.
• In our opinion, this is the cleaner trade opportunity, as the market would be imbalancing out of the current balanced and composite value area, opening the door for directional follow through.
Conclusion
ZB sits at a critical decision point, balancing between a well repaired value area below and a clearly defined acceptance zone above. With CPI scheduled for January 13th, followed by PPI and retail sales on January 14th, the market is likely to remain patient until these releases provide clarity on inflation persistence and demand strength. A softer inflation print or weaker consumption data would support acceptance higher and reinforce the bullish imbalance scenario, while firmer data could keep ZB capped and pressure price back through the current consolidation. In our opinion, traders should focus on how price responds at 116'00 and 115'25 following the releases, as acceptance or rejection at these levels will likely define the next directional opportunity.
If you found this analysis useful, feel free to give a boost, comment, or share your own levels and scenarios below.
Disclaimer: This is not financial advice. Analysis is for educational purposes only; trade your own plan and manage risk.
Acronyms:
w - Weekly
VAH - Value Area High
VAL - Value Area Low
VPOC - Volume Point of Control
LVN - Low Value Node
HVN - High Value Node
LVA - Low Value Area
SP - Single print

Silver Futures Breakdown: From Trend Expansion to DistributionWhy Silver Is Moving: Economic Cycle, Correlation, and Sentiment
Silver futures (SI), represent one of the most dynamic markets within the precious metals complex. Silver occupies a unique position because it functions as both a monetary metal and an industrial input. This dual role makes it sensitive not only to inflation expectations, real interest rates, and currency movements, but also to manufacturing demand, energy transition themes, and broader economic growth expectations. Silver is closely correlated with Gold futures, or GC, due to their shared role as hard assets and hedges against currency debasement. However, silver often exhibits higher beta behavior than gold, meaning it tends to lag initially and then accelerate more aggressively once capital rotates into the metals complex.
From an economic cycle perspective, silver typically performs best during late cycle and early easing environments. These are periods when growth concerns rise, central banks signal accommodative policy, and investors seek both inflation protection and upside convexity.
Sentiment toward silver has shifted meaningfully over the past several months. The recent bull uptrend has been driven by a combination of persistent inflation pressures, expectations for lower real rates, strong industrial demand tied to electrification, and increasing speculative participation. Over the past month specifically, silver prices have been influenced by renewed weakness in the US dollar, falling real yields, and a broader rotation into commodities. The general sentiment remains constructive, with market participants viewing pullbacks as opportunities rather than trend reversals.
What the Market has done
• The market consolidated between the 46.325 and 54.285 area from October through the end of November 2025, forming a well defined balanced region.
• Buyers initiated out of this range causing an imbalance to the upside.
• The market trended higher throughout most of December, displaying persistent initiative buying that resulted in new all time highs at 82.670.
• Over the past two weeks, volatility has expanded, with more pronounced two way rotations.
• This activity has led to the development of a distribution range bounded by 82.32 on the upside and 69.640 on the downside.
What to expect in the coming week
The key levels to watch are the current range high and range low at 82.32 and 69.64. These boundaries define the active distribution and will be critical in determining the next move of the market.
Neutral scenario
• Given the increase in volatility following the strong bullish December run, the market may continue to rotate in two directions as participants work to establish value.
• Price could remain contained within the recent distribution range as both buyers and sellers test conviction at the edges.
Bullish scenario
• If bids are able to step up and hold the 73.96 area, which aligns with the developing weekly value area low, buyers may regain control.
• A sustained buyer response from this level could lead to a rotation back toward the all time highs.
• Acceptance above the 79.22 area, which aligns with the developing weekly value area high, would signal strength and open the door for a move toward 84, corresponding with the weekly one standard deviation high.
• Continued acceptance and momentum could extend the move toward 88, which aligns with the weekly two standard deviation high.
Bearish scenario
• If sellers are able to step down offers and buyers are unable to hold the 75.75 area, which aligns with the developing weekly value area low, the market may rotate lower to 70.58, which aligns with the distribution range low and the December 29 weekly value area low.
• Failure of buyers to defend 70.58, would expose further downside move to the 67.755 level, which aligns with the December 15 weekly value area high.
• Continued acceptance below 67.755 would open the door to a move toward the 64 area, where bid block 2 high is located and responsive buyers may attempt to defend
Conclusion
Silver remains in a confirmed higher time frame uptrend, supported by strong initiative buying since the December breakout and sustained acceptance above prior value. The recent increase in volatility reflects a transition from directional expansion into distribution rather than structural weakness. As long as price continues to hold above the lower boundary of the current range at 69.64, the broader bullish structure remains intact, with upside potential defined by acceptance above 79.22 and a retest of the 82.32 to 82.67 all time high region. A failure to hold the lower range would mark a shift in market condition and open the door to deeper rotations toward lower weekly references.
If you found this breakdown useful, feel free to give a boost, comment, or share your own levels and scenarios below.
Disclaimer: This is not financial advice. Analysis is for educational purposes only; trade your own plan and manage risk.
Acronyms:
wVAH - Weekly Value Area High
wVAL - Weekly Value Area Low
wVPOC - Weekly Volume Point of Control
wLVN - Weekly Low Value Node
wHVN - Weekly High Value Node
