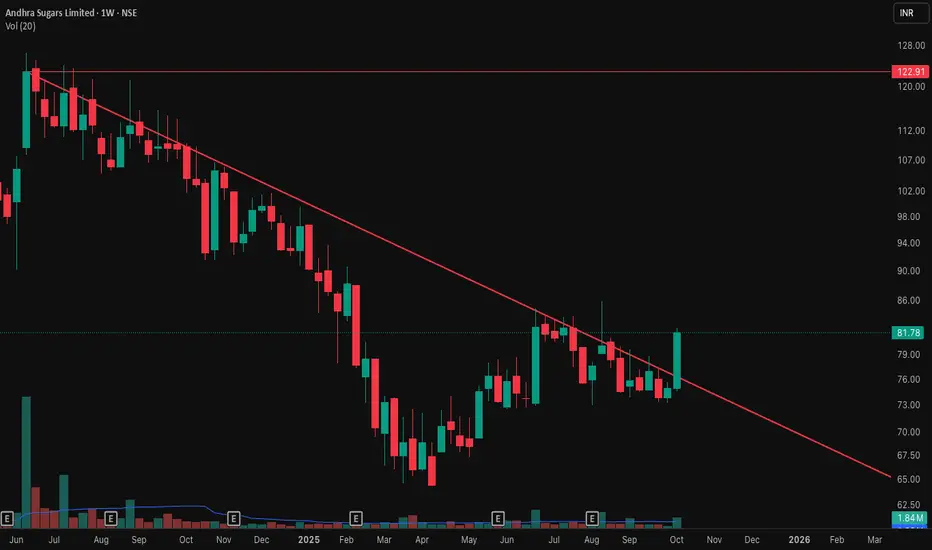
Andhra Sugars Ltd - Weekly Chart📊 Andhra Sugars Ltd – Trendline Breakout on Weekly Chart 🚀
📅 Chart Date: October 12, 2025 | Timeframe: Weekly
📈 CMP: ₹81.78 (+9.01%)
📍 Symbol: NSE:ANDHRSUGAR
🔍 Technical Analysis
📉 Downtrend Line Broken After Months of Consolidation
The stock had been trading under a strong falling trendline since mid-2024.
This week’s bullish candle successfully closed above the trendline, indicating a potential reversal from the long-term downtrend.
💥 Volume Confirmation
Noticeable rise in weekly volume (1.84M) compared to the recent average of 1.06M, showing buying interest emerging from the support zones.
🟡 Key Resistance Level: ₹122.91 (previous swing high from June 2024).\
A breakout and weekly close above ₹123 could confirm a major trend reversal and open up higher targets.
📌 Key Levels
Immediate Support (Breakout Retest Zone): ₹75–₹77
Resistance Zone: ₹122.91
Next Targets: ₹95 / ₹110 / ₹123
Stoploss (Weekly Close Basis): ₹70
⚠️ Disclaimer
This analysis is for educational and charting purposes only. Not financial advice. Please do your own research before making any investment decisions.
Volumespike
Volume EPO – One bar, seven volume stories Volume EPO – One bar, seven volume stories (VAKFN, Borsa Istanbul)
This idea illustrates how different volume-classification methods can produce very different interpretations of the same bar. The Volume EPO overlay is used as a research tool to display seven methods side by side in a compact HUD.
The example is taken from VAKFN on Borsa Istanbul. On this market, TradingView provides extended intrabar volume data (BIST volume data plan), which allows the Intrabar row of the table to be built from lower-timeframe up/down volume and used as a high-precision benchmark.
Price is shown on the daily chart inside an ascending channel. The last daily bar in that structure is analyzed with the Volume EPO table on the right. Total volume on that bar is the same for every row (66.49M), but each method splits it into buy / sell / delta differently:
- Intrabar (Ref) – lower-timeframe up/down volume
≈ 36.66M buy vs 29.83M sell → delta +6.83M (moderate net buying; benchmark “truth layer”).
- BVC (Smart) – probabilistic split via normal CDF on normalized price change
Delta ≈ +7.61M, very close to Intrabar (Diff ≈ 1.1%), confirming a mild buy imbalance.
- Tick Rule – classic uptick/downtick classifier
Because the close is above the previous close, the whole 66.49M is classified as buy volume
→ delta +66.49M (Diff ≈ 90%), an extremely bullish reading.
- Lee-Ready Style – delayed midpoint quote test with Tick fallback
On this bar the close falls on the sell side of the delayed midpoint, so the entire volume is classified as selling
→ delta −66.49M (Diff ≈ 110%), the exact opposite of Tick Rule.
- Wick Imbalance – geometric supply/demand from upper vs lower wicks
A strong upper wick and weak close again lead to a full sell reading
→ delta −66.49M (Diff ≈ 110%).
- ML-Logit – logistic model of normalized return and volume deviation
Shows only a small negative imbalance
→ delta ≈ −1.38M (Diff ≈ 12.1%), close to neutral flow.
- Geometry – legacy CLV-style candle approximation
With the close near the low of the range, more volume is assigned to sellers
→ delta ≈ −33.25M (Diff ≈ 60.1%), strong selling.
On this single daily bar of VAKFN, the conclusions range from “mild net buying” (Intrabar, BVC) to “massive buying” (Tick Rule), “massive selling” (Lee-Ready Style, Wick Imbalance), “almost neutral” (ML-Logit), and “strong selling” (Geometry).
Only the Intrabar row uses actual lower-timeframe up/down volume from TradingView; all other rows are models built on top of OHLCV. Access to deeper intrabar history on small timeframes (such as 1s/5s, depending on data plan and subscription level for BIST) strengthens this benchmark layer and makes it easier to see which methods stay close to the underlying flow and which ones drift away.
This idea is presented as a research and educational example on VAKFN, not as a trade signal or financial advice.

Parag Milk Foods Ltd - Monthly Cup & Handle Breakout📊 Parag Milk Foods Ltd – Monthly Cup & Handle Breakout ☕🚀
📅 Chart Date: November 2, 2025 | Timeframe: Monthly
📈 CMP: ₹311.55 (+19.98%)
📍 Symbol: NSE:PARAGMILK
🔍 Technical Overview
📉 Pattern: Cup & Handle Breakout (Bullish Continuation)
The stock has completed a multi-year Cup & Handle pattern spanning from 2018–2025.
Breakout above long-term trendline resistance (~₹290–300) on strong monthly volume confirms a bullish reversal structure.
Sustaining above ₹300 can open up multi-month upside potential.
💥 Volume Confirmation (🔊)
Monthly volume surged to 31.04M, nearly 30% above its 20-period average, validating the breakout with institutional interest.
📈 Next Resistance Zone: ₹380–₹410
📉 Immediate Support: ₹285 (Breakout Retest Zone)
💬 Analyst View
After years of consolidation, Parag Milk Foods has broken out of a long-term cup & handle formation — a strong bullish structure often marking the start of a multi-year uptrend.
Holding above ₹300 with volume could attract swing and positional investors, targeting ₹400+ levels in the medium term.
⚠️ Disclaimer
This chart analysis is for educational and illustrative purposes only. It is not financial advice or a buy/sell recommendation. Always perform your own research or consult a financial advisor before investing.

Cello World Ltd – Weekly Inverted Head & Shoulders Breakout📊 Cello World Ltd – Weekly Inverted Head & Shoulders Breakout 🧩
📅 Chart Date: October 29, 2025 | Timeframe: Weekly
📈 CMP: ₹660.60 (+4.74%)
📍 Symbol: NSE:CELLO
🔍 Technical Overview
📉 Pattern: Inverted Head & Shoulders (Reversal Pattern)
The stock formed a clear inverted H&S structure after a long downtrend, signalling potential trend reversal.
Neckline breakout seen near ₹645, accompanied by rising volume momentum — suggesting buyer dominance.
💥 Volume Confirmation (🔊)
Weekly volume surged to 3.2M, up significantly from the average of 1.02M, validating the breakout.
📈 Next Resistance Zone: ₹745–₹780
📉 Immediate Support: ₹640 (neckline zone)
⚠️ Disclaimer
This analysis is for educational and charting purposes only. Not a buy/sell recommendation. Always do your own research before trading or investing

#BSE - Cup & Handle BO in DTFScript: BSE
Key highlights: 💡⚡
📈 Cup & Handle BO in DTF
📈 Volume spike seen during Breakout
📈 MACD Bounce
⚠️ Important: Always Exit the trade before any Event.
⚠️ Important: Always maintain your Risk:Reward Ratio as 1:2, with this RR, you only need a 33% win rate to Breakeven.
✅Like and follow to never miss a new idea! ✅
Disclaimer: I am not SEBI Registered Advisor. My posts are purely for training and educational purposes.
Eat🍜 Sleep😴 TradingView📈 Repeat 🔁

Oberoi Realty Limited chart analysis: BUY SetupEntry: ₹1,687-1,695 (Current Level)
Target 1: ₹1,722-1,725
Target 2: ₹1,754-1,760
Target 3: ₹1,800+ (Extended)
Stop Loss: ₹1,650
Technical Rationale:
Massive bullish momentum with +5.35% surge today
Strong breakout from consolidation zone (1,600-1,690)
Huge volume spike (2.61M) - highest in recent months
RSI spiking above 60, indicating strong bullish momentum
Price breaking above long-term resistance at 1,680
Gap-up opening showing institutional interest
Real estate sector showing strength
Clear resistance levels at 1,722 and 1,754
Risk-Reward: Favorable 1:2.5+ ratio
Strategy: Momentum play - Book partial at Target 1 (1,722), trail SL to 1,670 at Target 2. Hold remaining for extended targets
Caution: Watch for profit booking after such strong rally. Avoid chasing if price goes significantly above 1,700

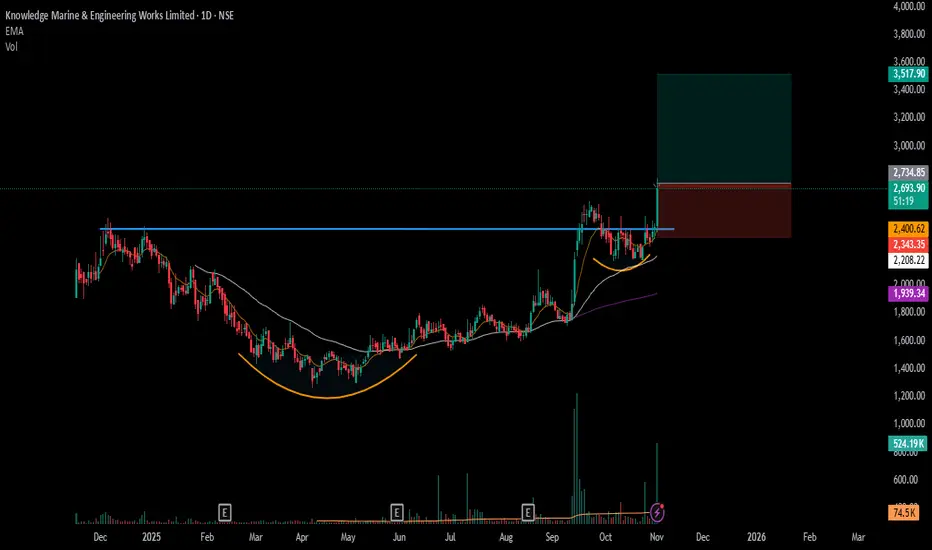
#KMEW - IPO Base Breakout in DTFScript: KMEW
Key highlights: 💡⚡
📈 IPO Base Breakout in DTF / C&H BO in DTF
📈 Short consolidation below Resistance
📈 One Fake Breakout seen during the base formation
📈 Volume spike seen during Breakout.
📈 MACD Bounce
⚠️ Important: Always Exit the trade before any Event.
⚠️ Important: Always maintain your Risk:Reward Ratio as 1:2, with this RR, you only need a 33% win rate to Breakeven.
✅Like and follow to never miss a new idea! ✅
Disclaimer: I am not SEBI Registered Advisor. My posts are purely for training and educational purposes.
Eat🍜 Sleep😴 TradingView📈 Repeat 🔁
Thomas Scott Ltd - Symmetrical Triangle Breakout - Weekly📊 Thomas Scott (India) Ltd – Symmetrical Triangle Breakout on Weekly Chart 🔺
📅 Chart Date: October 26, 2025 | Timeframe: Weekly
📈 CMP: ₹364.05 (+16.93%)
📍 Symbol: NSE:THOMASCOTT
🔍 Technical Overview
📉 Pattern: Symmetrical Triangle
Price has been consolidating within a contracting triangle pattern since February 2024, showing a gradual squeeze in volatility.
This week’s strong bullish candle with +16.9% move and above-average volume indicates a potential breakout attempt from the upper trendline.
💥 Volume Confirmation (🔊)
Volume rose sharply to 277.4K, much higher than the recent average of 189.8K, supporting the breakout strength.
📈 Next Resistance Zone: ₹415–₹430 (previous supply area).
📉 Immediate Support: ₹330 (triangle breakout zone).
🎯 Trading Plan (for Educational Purpose)
Entry (on Retest): ₹335–₹345 zone
Stoploss: ₹295 (Weekly Close Basis)
Targets: ₹415 / ₹475 / ₹525
Risk–Reward: ~1:2.5
⚠️ Disclaimer
This analysis is for educational and charting purposes only, not financial advice. Always do your own research before investing or trading.

Trade Setup: Kingfa Science & Technology (India) LtdAction: Buy
Entry Level: 4,670–4,690 (breakout candle level)
Target 1: 4,764
Target 2: 4,962
Stoploss: 4,400 (below triangle support)

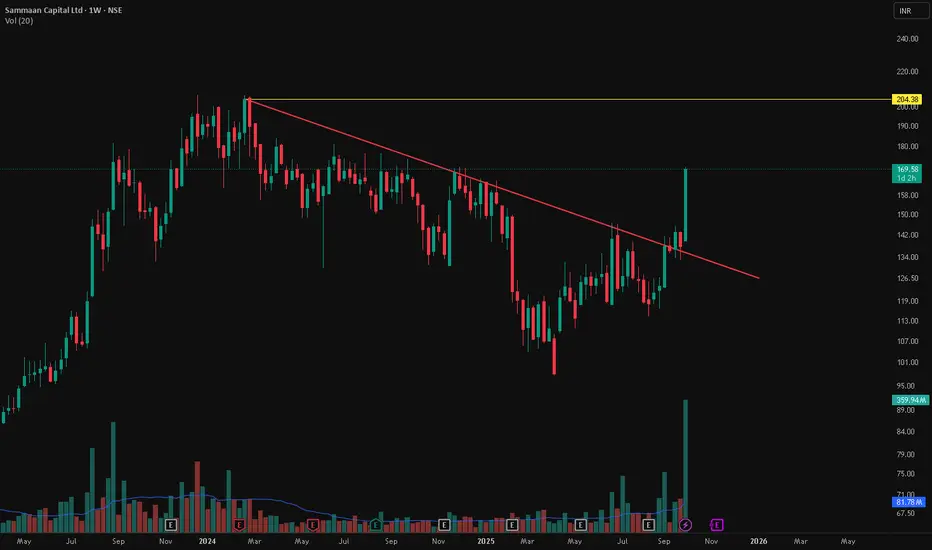
Sammaan Capital Ltd - Weekly Breakout📊 Sammaan Capital Ltd – Major Trendline Breakout with Volume Spike 🚀
📅 Chart Date: October 2, 2025 | Timeframe: Weekly
📍 CMP: ₹169.58 (+23.04%)
📈 Symbol: NSE:SAMMAANCAP
🔍 Technical Analysis
📉 Multi-Month Downtrend Broken
Stock has been consolidating under a falling trendline since late 2023.
This week, price gave a clean breakout above the trendline with a strong bullish candle.
💥 Volume Confirmation
Current Weekly Volume: 359.94M vs Avg 81.78M 🔥
Indicates strong institutional participation.
🟡 Key Resistance
Next major hurdle is ₹204.38 (previous swing high).
Sustained closing above this zone can open doors for higher levels.
📌 Key Levels
Immediate Support (Breakout Retest): ₹142–₹150
Resistance Zone: ₹204.38
Potential Next Targets: ₹220 / ₹250
Stop loss for Swing Trades: ₹135
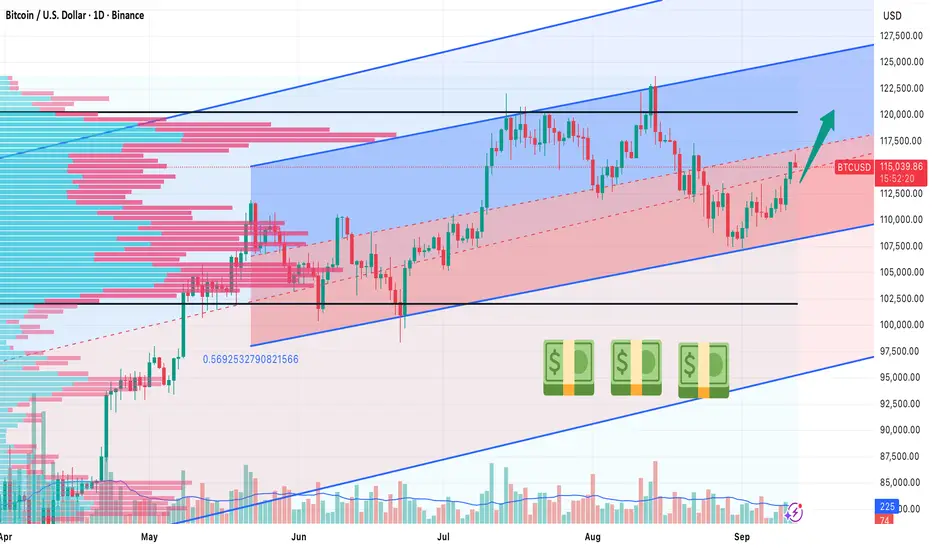
BTC/USD Near the Median of Weekly and Daily Regression TrendsHow to Approach the Setup
Long‑term bias: bullish (weekly regression channel slopes upward, daily channel is flat‑to‑slightly bullish).
Typical trader mindset: wait for an upward breakout with strong volume or place a buy‑limit order around the round‑number level of 115,000 USD and aim for an initial target near 120,000 USD (+4%).
Price action and technical context
BTC is currently trading close to the median line of two overlapping regression‑trend channels:
Weekly Timeframe: Channel slope Upward - Interpretation : Long‑term bullish pressure
Daily Timeframe: Channel slope Flat‑to‑slightly up - Interpretation : Short‑term equilibrium, slight upside bias.
The price sits in a narrow corridor bounded by the upper and lower regression lines. Because the weekly channel is tilted upward, the overall market structure still favors higher highs. The daily channel’s flatness suggests that any move will need a catalyst—typically a surge in buying volume or a breakout above the weekly upper trend line.
Key technical reference points
Upper daily regression line: ~125,000 USD – the first resistance level that, if breached with volume, could trigger a sustained rally.
Median (current price area): ~117,000 USD – a psychologically clean round number that also aligns with the median of both channels.
Lower daily regression line: ~108,000 USD – a safety net; a break below would invalidate the bullish bias.
Trade‑the‑setup options
1. Wait for a breakout – Enter the trade when the price closes above the weekly upper regression line and the accompanying volume is at least 1.5 times the 20‑day average. This condition confirms that the bullish bias is actually materialising and helps avoid false “whipsaw” moves. In practice, traders use a market order or place an aggressive limit order just above the breakout level (around 118,600 USD).
2. Buy‑limit at 115,000 – Set a limit order at the round‑number median of 115,000 USD. The round number acts as a natural “magnet,” and because the price is already near the median, this approach works well in a range‑bound market. The typical execution is a limit order at 115,000 USD with an initial profit target of 120,000 USD, representing roughly a +4 % gain.
Both methods assume the trader will monitor volume and short‑term momentum (RSI, MACD) to confirm that the move is not a temporary spike.
Momentum and volume cues
RSI(14): Values climbing above 55 support the bullish bias; a dip below 45 warns of potential reversal.
MACD: A bullish crossover (MACD line crossing above the signal line) on the daily chart adds confidence to a breakout or limit‑order fill.
Volume: A surge to at least 150 % of the 20‑day average on the day of the breakout dramatically raises the probability of a sustained move.
Risk considerations
Stop placement: If the price falls below the lower weekly regression line (≈111,000 USD) or breaches the median downward with a sharp volume spike, exit the position.
Position sizing: Because BTC’s volatility can be extreme, allocate a modest percentage of the portfolio (e.g., 2‑3 % of equity) to this speculative play.
Alternative defined‑risk structures: Traders uncomfortable with outright exposure can use a debit call spread (e.g., buy the 115,000 USD call, sell the 120,000 USD call) to cap downside while preserving upside to the first target.
Bottom line
When BTC/USD hovers near the median of a bullish weekly regression channel and a flat‑to‑slightly bullish daily channel, the market is in a neutral‑to‑bullish equilibrium. The prudent approach is either:
Patience: Wait for a volume‑driven breakout above the weekly upper trend line, or
Precision: Place a buy‑limit order at the clean 115,000 USD level and target the first upside milestone at 120,000 USD (+4%).
Both strategies rely on confirming momentum and volume before committing capital, while keeping a tight stop below the lower weekly regression line to protect against a sudden reversal.
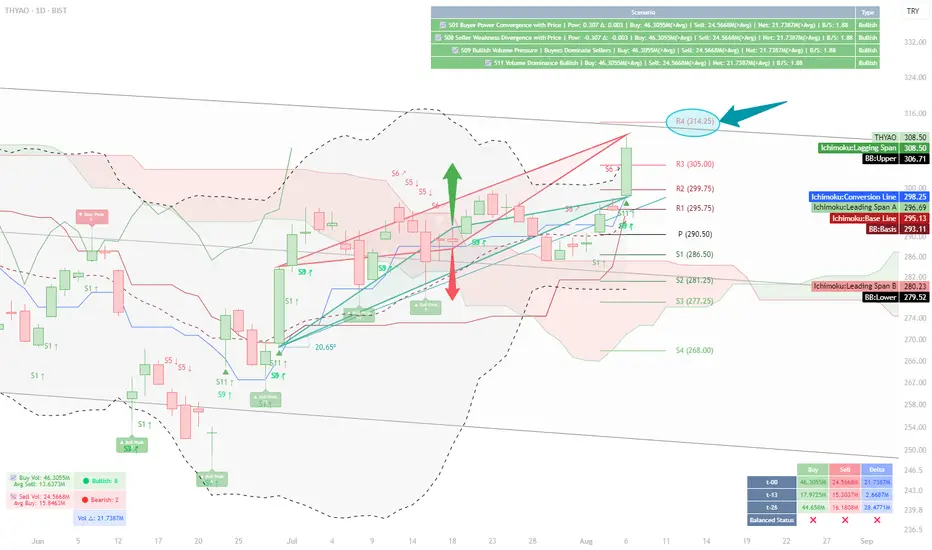
Volume and Structural Analysis of THYAO — Reaching Resistance at📝 Analysis:
My initial focus in this chart was on the daily buy and sell volumes.
According to the table displayed at the bottom of the chart for August 6th:
Buy Volume (t-0): 46.305M
Sell Volume (t-0): 24.566M
These values show a clear increase compared to previous checkpoints (t-13 and t-26).
Notably, the buy volume is 28.3M higher than t-13 and about 1.6M higher than t-26.
This gives us a broader picture: buying strength remains dominant, even though delta volume has not surpassed its value at t-26 (still about 7M short). Nevertheless, the current volume levels show stronger positioning compared to the mid-term past.
On the upper-right side of the chart, four system-based scenarios have been triggered via our custom indicator:
✅ Scenario 01 – Buyer Power Convergence with Price
✅ Scenario 08 – Seller Weakness Divergence
✅ Scenario 09 – Bullish Volume Pressure
✅ Scenario 11 – Volume Dominance Bullish
Together, they present a market that is tilting in favor of the buyers, with bullish sentiment supported by volume structure.
Next, my attention shifts to the triangle formations on the chart, which were automatically plotted based on cross high/low logic.
🔺 The green ascending triangle, with a slope of 20.65°, indicates a healthy and steady bullish structure.
Its top has not yet reached the resistance zone, where the red triangle forms a descending structure aligned with the R4 level at 314.25.
Beyond the technical interpretation, I also look at triangles symbolically.
Throughout history, from the Seal of Solomon (Star of David) to the Egyptian pyramids, triangles have represented stability, energy focus, and a path upward.
In this chart, that symbolism holds true — the green triangle embodies a progressive, rising support, while the red triangle offers a calculated obstacle.
What’s intriguing is the parallel structure of the triangle bases — suggesting a balanced energy field, ready to be tipped by momentum.
📊 When combined with other indicators:
Price is above the red Ichimoku cloud
It sits in the upper zone of the regression channel
Bollinger Bands show an upward breakout bias
Daily pivot levels align with this structure, and the R4 level (314.25) becomes a relevant resistance to monitor
📍 Conclusion:
Given the alignment of structural elements and volume behavior,
a move toward the resistance at 314.25 is well within reach under current market dynamics.
⚠️ This analysis is based on a custom-built indicator named Volume Based Analysis V 1.4+ and is provided strictly for educational and analytical purposes.
No investment or trading advice is intended.
👥 I welcome your interpretations and experiences —
Do you also see 314.25 as a realistic target?
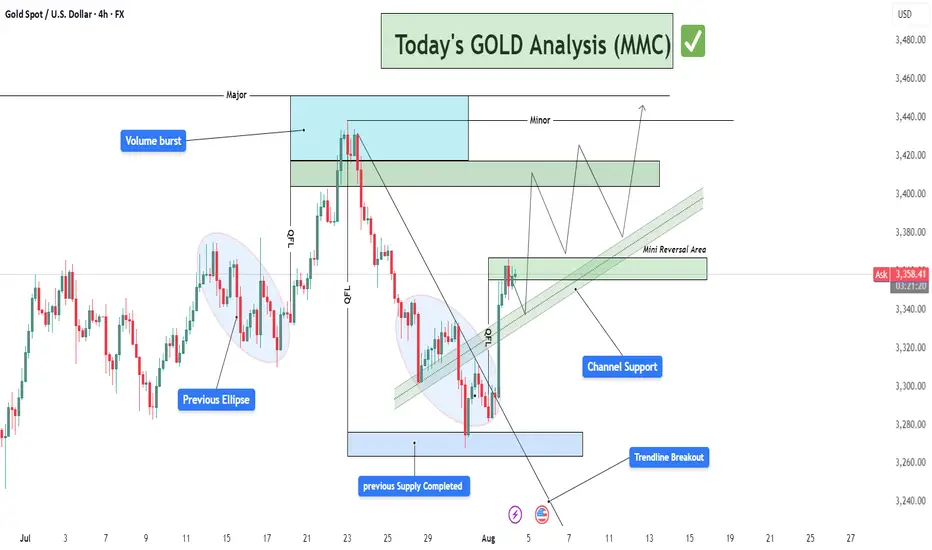
Today's GOLD Analysis : MMC Structural Analysis + Reversal ZoneThis analysis is rooted in MMC – Mirror Market Concepts, a framework designed to track institutional behavior through liquidity patterns, QFL (Quick Flip Levels), trendline shifts, and volume bursts. The current 4H Gold chart demonstrates a smart money footprint that provides actionable insight for intraday and swing traders.
🔍 Detailed Technical Breakdown:
🟦 1. Previous Supply Completed | Demand Zone Reversal
At the lower end of the chart, price entered a key blue zone around $3,250–$3,280, previously a supply zone now flipped into demand. This zone represents where institutional buyers absorbed liquidity, forming the base for a bullish impulse.
The strong reaction from this zone, marked by long-wick candles and immediate reversal, indicates exhaustion of selling pressure.
This reversal is confirmed by a QFL structure, meaning price created a fast liquidity sweep before flipping direction.
MMC recognizes this as a high-probability area of reversal, a point where smart money typically enters.
📈 2. Trendline Breakout & Structure Shift
A descending trendline, representing bearish market control, was decisively broken to the upside. This shift marks:
End of the corrective phase
Beginning of a bullish structural change
Buyers now control the short-term narrative
The breakout was not only clean but also supported by a volume burst, which is a classic MMC indicator that institutional traders are entering the market.
🔶 3. Volume Burst Confirmation
Volume behavior plays a critical role in MMC. We see a clear volume spike post-breakout. This suggests that:
The breakout is not false
Buyers were aggressively positioned
A sustainable move is in development
This supports the validity of the trendline breakout and confirms the idea that price is ready to test higher liquidity zones.
🟢 4. Current Price Structure: Bullish Channel
After the breakout, the market formed a bullish channel, where price is steadily climbing while respecting parallel boundaries.
The channel support line acts as a dynamic entry point for retracement buys
MMC strategy uses this structure to identify scaling entries at channel lows or after successful pullbacks into key reversal zones
🟩 5. Mini Reversal Area (Short-Term Resistance Zone)
Price is currently testing a minor supply zone or what MMC defines as a "Mini Reversal Area". This is a reaction zone before continuing toward the major target above.
There are two possible reactions:
Short-term rejection, leading to a pullback into the lower channel support zone
Minor consolidation, forming a base for a breakthrough toward major resistance
🟦 6. Major & Minor Supply Zones Above
Marked in light blue and green, these zones represent areas where previous selling volume and distribution occurred.
The major supply zone (approx. $3,440–$3,470) is the next institutional target
The minor zone sits between $3,400–$3,420 and may cause initial resistance or a base for another impulse
These levels are prime for partial profit-taking or scouting short-term reversal trades.
📊 Trade Management Insights:
🛒 Buy Opportunities (Long Bias):
On pullback into channel support near $3,340–$3,350
On bullish confirmation from mini reversal area
On break and retest above minor resistance at $3,420
🛑 Stop-Loss Suggestion:
Below the channel support or below the blue demand zone (approx. $3,245)
🎯 Profit Targets:
TP1: $3,400 (first resistance)
TP2: $3,420 (minor supply)
TP3: $3,450–$3,470 (major institutional level)
🧠 Mirror Market Concepts (MMC) Highlights:
QFL Structures = Institutional Reversal Points
Volume Burst = Confirmation of Breakout Validity
Trendline Breakout = Momentum Shift
Channel Structure = Controlled Climb Pattern
Mini Reversal Zone = Key Decision Point Before Continuation
🧭 TradingView Summary for Minds Community:
This GOLD chart beautifully aligns with the MMC method — spotting smart money involvement early and aligning with their flow. After confirming structural reversal via trendline and QFL, the setup now looks poised for continuation toward the $3,440–$3,470 zone, making it a perfect chart to watch for buy-the-dip setups.
"Crypto Charts Whisper—Are You Listening?"As I’ve mentioned before, the market is manipulated. In a previously published idea, “VSA vs BTC: Into a Bearish Scenario or Not?”, this manipulation becomes obvious. The big players—whales, institutions, banks—are deliberately engineering traps to absorb liquidity from uninformed retail traders, boosting their profits and power.
Some informed retail traders like you and me understand that behind these entities are teams of insiders and highly trained traders operating around the clock—24/7, 365 days a year. That’s what it takes to survive in such a demanding environment.
This is especially true in the crypto market, which—despite its explosive growth—is still a baby in terms of total market cap. That’s why price fluctuations are so extreme, whether it’s Bitcoin, Ethereum, or altcoins.
Many of you who have been in the space since the early days already know: Bitcoin is the king. As the first coin built on cryptography, Bitcoin leads the way—and where it goes, altcoins follow. These movements often align with changes in Bitcoin Dominance.
So, yes, Bitcoin is the king—but its movements aren’t random. Bitcoin follows rules, and these rules are shaped by data—especially macroeconomic data. One major example is the Consumer Price Index (CPI), released monthly by the U.S. Department of Labor and Statistics.
And here's the key: the big players often have early access to this kind of information. They prepare accordingly—days before the official release—and when the data hits, they move the markets up or down. Even whales don’t act on gut feelings. They follow a framework.
We, as retail traders, must adopt a similar approach. We may not have insider access, but we do have knowledge—and with an open mind, we can act in advance.
As I’ve emphasized before: learning to read Market Structure lets you decode not just market psychology, but also the intentions of the big players. Their large positions leave footprints, just like a ship cuts a path through water. That trail is visible—for those who know where to look.
If you study volume correctly, you’ll start to notice certain zones that keep coming back. That’s all I’ll say—for now.
Unfortunately, many traders rely blindly on strategies like swing trading, expecting price to react at predefined swing highs or lows. But this rarely happens on schedule—especially in crypto. Yes, swing highs and lows exist—that’s the nature of all markets—but in between those levels, the big players create hidden structures that act as signals.
These aren’t just random formations—they’re part of how the big players "communicate" with one another. First, to maintain balance within their own circles. Second, to create FOMO and trap emotional retail participants.
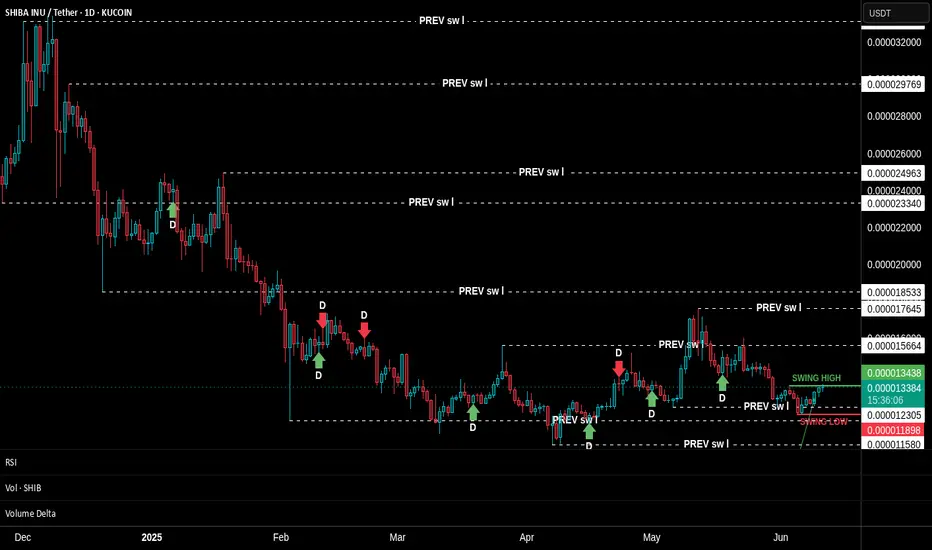
Look at the SHIBA INU chart I’ve shared. This technique is unfolding in real time. Do you notice how the structure is compressing? How price and new swing levels are squeezing in? Look closer at the footprints I’ve highlighted—some of those levels are being respected and reused in the future.
We’re taught from childhood that "we can’t know the future." But is that really true? Repetition of such beliefs is common—worldwide. But again, is it true? I think not.
Think about this: if you drive a car full-speed toward a wall and don’t brake, what happens? You crash. Isn’t that a form of future reading? It’s based on logic, observation, and probability. The same tools we use in market analysis.
So, I hope my words challenge your thinking.
📅 As of this writing (June 11, 2025), Bitcoin is trading at $109,588.
Today’s candle still has about 17 hours left to form, and price action on the daily timeframe is sitting within a previously established supply zone. Bulls and bears are clashing here. But zoom in: what's happening on the lower timeframes? Which signals have been tested, and which haven't?
Are we about to see a breakthrough above the all-time high?
Could this be the launch of the next leg of the bull run?
Equity Research Flash – Hexaware Technologies Ltd.CMP: ₹722.35 | Bullish Momentum Post Trend Reversal
HEXT shows a bullish breakout from a falling trendline, with RSI near 60 and strong volume uptick. The price reclaimed the 0.5 Fibonacci level, eyeing next targets at ₹749.85 (0.618) and ₹793.35 (0.786). Fundamentally strong with robust revenue growth, improving ROCE (26.4%), and low debt. A move above ₹750 could trigger further upside. Accumulate on dips with SL at ₹688.
Recommendation: Positive | Buy on Dips Near ₹700
For Education Purpose only

Bullish potential detected for NHFEntry conditions:
(i) higher share price for ASX:NHF along with swing up of indicators such as DMI/RSI.
Stop loss for the trade would be:
(i) below the support level from the open of 17th March (i.e.: below $6.41), or
(ii) below the support level from the open of 24th February (i.e.: below $6.30), depending on risk tolerance.

Equity Research Report – NEWGEN SOFTWARE TECHNOLOGIESShort-Term View: A strong breakout above key resistance at ₹1,100 with volume surge indicates bullish momentum. Price reclaimed the 50 EMA after consolidation. RSI at 60.87 supports strength; next resistance lies near ₹1,193.90.
Long-Term View: Structurally strong after correction. Sustaining above ₹1,020 (50 EMA) may attract fresh buying. Long-term targets can stretch to ₹1,300+ if earnings and demand trends remain favorable.
Conclusion: Bullish momentum likely to continue both short and long term. Watch for volume confirmation and hold above ₹1,100.
For Education Purpose only

ADITYA BIRLA CAPITAL LTD – Trend Reversal Breakout Trade🧠 Technical Highlights:
Downtrend Channel Breakout: Clear breakout from a falling channel pattern
Resistance Break: Strong breakout above supply zone of ₹204–₹210
Volume: Massive volume spike validates bullish strength
RSI: Above 70, indicating strong momentum but not overbought yet
🟢 Buy Setup
Buy Above: ₹219 (today's close confirms breakout)
Stoploss: ₹204 (below the previous resistance/new support)
Target 1: ₹235
Target 2: ₹248
Target 3: ₹260+ (swing/high-risk high-reward)
🔻 Sell/Short Setup (only if reversal)
Sell Below: ₹203
Stoploss: ₹210
Target: ₹190, ₹178
📅 Timeframe: Short-to-Medium Term (2–6 weeks)
📊 Risk-Reward: ~1:2.5
For Education Purposes Only

Equity Research Report – CARE Ratings Ltd (CARERATING)🔹 Technical Outlook
Stock has broken out of a horizontal resistance near ₹1,237 with volume pickup.
RSI is above 60, indicating momentum strength.
Short-term EMAs are crossing over the 50-day EMA — bullish signal.
Volume confirms accumulation.
🛒 Trade Setup
✅ Short-Term View (Swing/Positional Trade):
Buy above: ₹1,240 (on closing basis)
Target 1: ₹1,320
Target 2: ₹1,375
Stop-Loss: ₹1,185
Timeframe: 2–4 weeks
🏦 Long-Term View (Investor Strategy):
Buy Range: ₹1,180–1,240
Target 1: ₹1,450
Target 2: ₹1,580
Stop-Loss: ₹1,080 (weekly close)
Timeframe: 3–6 months
for educational purpose only

Equity Research Report – Paras Defence & Space Tech Ltd Technical Summary
Volume Spike: Sharp surge in volume confirms breakout strength.
Resistance Flipped: ₹1,299 now acting as strong support.
Momentum: RSI near 75 (overbought but strong bullish trend), indicating short-term potential with caution.
Moving Averages: 20/50/200 EMA crossover in bullish alignment.
🛒 Trade Setup
Short-Term View (Swing/Positional Trade):
Buy Zone: ₹1,315–₹1,330 (on dip near support ₹1,299)
Target 1: ₹1,435
Target 2: ₹1,475
Stop-Loss: ₹1,255 (below support & 5-day EMA)
Timeframe: 2–3 weeks
Short-Term View (Swing/Positional Trade):
Sell Zone below: ₹1,299
Target 1: ₹1,222
Target 2: ₹1,200
Stop-Loss: ₹1,255
For Education purposes only

POWERGRID – Breakout Setup with Volume Spike📍 Entry Zone: ₹310.10 – ₹311.10
🎯 Target: ₹330.00
🛑 Stoploss: ₹302.00
📈 RSI has crossed above 60, volume confirms breakout momentum (🔵 arrow), and price is supported above key EMAs.
🔍 Strong bullish structure with clear higher lows and a clean breakout candle. Momentum shift confirmed with increasing volume.
For Education Purposes Only

Equity Research Report – NEWGEN SOFTWARE TECHNOLOGIES Short-Term View: A strong breakout above key resistance at ₹1,100 with volume surge indicates bullish momentum. Price reclaimed the 50 EMA after consolidation. RSI at 60.87 supports strength; next resistance lies near ₹1,193.90.
Long-Term View: Structurally strong after correction. Sustaining above ₹1,020 (50 EMA) may attract fresh buying. Long-term targets can stretch to ₹1,300+ if earnings and demand trends remain favorable.
Conclusion: Bullish momentum likely to continue both short and long term. Watch for volume confirmation and hold above ₹1,100.
For Education Purpose only

MANORAMA Industries Breakout Above Resistance | Short-Term Rally🧾 Financial Content for Client (Performance FY25)
Revenue Growth:
Strong topline growth as per latest quarterly results (Q4FY25), showing consistent demand recovery and margin stability.
Profitability:
Net profit margins have improved on the back of better operational efficiencies and strong demand for specialty fats and oils.
Balance Sheet Strength:
Debt levels remain manageable; focus continues on maintaining a healthy asset-light model.
Future Outlook FY26:
Expanding international orders, coupled with premium product segment focus, is expected to drive double-digit revenue growth.
Management Commentary: Positive tone about expansion and demand pickup in domestic + export markets.
Learning Content
Price Action: Manorama Industries is at a crucial horizontal resistance (~₹1200), a major previous supply zone.
Volume: Recent breakout attempt supported by a significant spike in volume, which is a strong bullish signal.
RSI: RSI is near the overbought zone (>70), indicating strong momentum but also a caution for possible pullback if not sustained.
📊 Recommendations
Intraday Recommendation:
Bias: Bullish
Entry: Above ₹1215
Intraday Target: ₹1245 – ₹1265
Stop Loss: ₹1185
Short-Term Recommendation (1–3 weeks):
Bias: Bullish
Entry: Above ₹1215–₹1230
Target 1: ₹1300
Target 2: ₹1370
Stop Loss: ₹1160
for educational purpose only
