XAUUSD. Trading opportunityHey traders and investors!
Happy New Year to everyone!
Wishing you health, energy, and success in all your endeavors!
Patience, composure, and perseverance in mastering the intricacies of the markets!
On the daily timeframe, there is a range. The current buyer's vector is 7-8, with a potential target of 2721 (2726). In the buyer's vector that has started, a buyer's zone has formed (green rectangle on the chart). The seller is testing this zone.
Buying opportunities (buy patterns) can be sought from this zone.
On the 4-hour timeframe, there is also a buyer's zone at these levels, and a test level has already formed at 2636.705. You can look for buying opportunities from a manipulation (false breakout) of the test level if the price returns there.
I wish you profitable trades!
VSA

BTCUSDT. Analysis of the daily timeframe.Hey traders and investors!
The price of Bitcoin entered the range of 92,232 - 90,500, and the buyer resumed activity (see previous posts).
On the daily timeframe, there is a range, with its boundaries marked on the chart.
The current buyer's vector is 6-7. The first target is almost reached at 99,963.7. The next target will be 103,333 (the seller’s zone at the upper boundary of the range).
If looking for buy opportunities, it’s advisable to focus on lower timeframes with a tight stop-loss and a near-term target based on the lower timeframe.
The feasibility of looking for sell opportunities can be evaluated once the price reaches 103,333
I wish you profitable trades.

NLMK 1H Long Swing Trend TradeTrend Trade
+ short impulse
+ support level
+ biggest volume T1?
- 1 bar reversal?
+ volumed 2Sp
+ weak test to 1/2
+ first bullish bar closed entry
Calculated affordable virtual stop
1 to 2 R/R expandable to 1D if closed Sp take profit
Daily Trend
" + long impulse
+ 1/2 correction
+ JOC level
+ support level
+ volumed manipulation"
Monthly Trend
"+ long impulse
+ T2 level
+ support level
+ volumed manipulation"

HUBB 1H Long Swing Aggressive Trend TradeAggressive Trend Trade
- short impulse
+ biggest volume TE / T1 level
+ support level
+ boggest volume Sp
Calculated affordable stop limit
1 to 2 R/R take profit
Daily Trend
"+ long impulse
+ T2 level
+ 1/2 correction
+ support level"
Monthly Trend
"+ long impulse
+ T2 level
+ 1/2 correction
+ support level"
Yearly Trend
"+ long impulse
+ neutral zone"

PIKK 1H Swing Long Conservative Trend TradeConservative Trend Trade
+ long impulse
+ 1/2 correction
+ T2 level ? (new spread)
+ support level
+ biggest volume Sp
+ weak test
Calculated affordable stop limit
1 to 2 R/R take profit
Daily context
"+ long impulse
+ 1/2 correction
- SOS level above JOC
+ support level
+ volumed Sp
+ weak test"
Monthly context
"- short impulse
+ volumed T1
+ support level
+ biggest volume 2Sp+ in 4d"
Yearly context
"- no trend
- context direction short"

BTCUSDT. Daily and 4 hour TF analysisHey traders and investors!
Daily Timeframe Analysis
The price of Bitcoin is in a range on the daily timeframe. The lower boundary is 90,500, and the upper boundary is 108,353 (more details in previous reviews).
The seller's vector 3-4 stopped at the level of 92,232.54. The key bar in the seller's vector (the bar with the highest volume) is the bar from December 19. At the beginning of the seller's vector, a seller's zone was formed with a lower boundary of 103,333 (red rectangle on the chart), and this zone has not yet been tested by the buyer on the daily timeframe. This means there is a high probability of the seller resuming from this zone.
The buyer's vector 4-5 started to develop on December 20, and on December 21, the seller resumed from the key bar of the seller's vector, forming the test level of the key bar of the seller's vector at 99,540.61. Then, the price interacted with the test level, and yesterday, December 26, the seller resumed again. The potential target for the seller could be 92,232.54.
4H Timeframe Analysis
On the 4-hour timeframe, the price is also in a range with similar boundaries to the daily timeframe: the lower boundary is 90,500, and the upper boundary is 108,353.
The seller's vector 13-14 reached the required target, and the buyer's vector 14-15 began to develop with a potential target of 102,800.11.
Summary:
On the weekly timeframe (see previous reviews), there is a long trend. The priority is buying.
On the daily and 4-hour timeframes, there are ranges. It is a priority to look for buys at the bottom of the range and sells at the top.
It is interesting to look for buying opportunities (buy patterns) after the price interacts with 92,232 or 90,500. The potential target is 102,800 (103,333).
I wish you profitable trades.

NVIDIA. Buying opportunitiesHey traders and investors!
NVIDIA Daily Timeframe Analysis
A sideways trend (range) was formed on the daily time frame in October 2024 (point 4 was formed). The lower boundary is 128.74, and the upper boundary is 152.89. The seller's vector 11-12 interacted with the lower boundary of the range, where key volumes of the vector passed ("rKC" on the chart). The buyer absorbed these volumes on December 23, meaning they defended the lower boundary of the range.
The current buyer's vector is 12-13, with a potential target of 146.54 (152.89). The obstacle for the buyer is the test level of the seller's zone at 142.82 (the seller's zone is the red rectangle on the chart).
It makes sense to look for buying opportunities (buy patterns) as part of the idea of realizing the buyer's vector 12-13.
I wish you profitable trades.

SMLT 1H Swing Long Aggressive CounterTrend TradeAggressive CounterTrend Trade
- short impulse
- unvolumed T1
+ support level
+ volumed 2Sp+
+ weak test
+ biggest volume first buying bar close entry
Calculated affordable stop limit
1 to 2 R/R take profit
Daily CounterTrend
"- short impulse
+ volumed T1
+ support level
+ volumed manipulation"
Monthly Trend
"+ long impulse
+ T2 level
+ support level
+ biggest volume manipulation"
Yearly trend
"+ T1 level
+ support level
+ biggest volume manipulation?"

The correction in crypto assetsHey traders and investors!
The correction in crypto assets continues.
You can look for selling opportunities (for example, in futures) on these assets, as both the daily and hourly timeframes favor the sellers.
Stop-losses are a must!
If buyers on these assets (OPUSDT, ARBUSDT, DOTUSDT) buy up the daily bar from December 19, the priority will shift to purchases.
I wish you profitable trades.

XAUUSD. Analysis of the daily timeframeHey traders and investors!
Let me remind you, on the daily timeframe, there's a range. The upper boundary is 2726.295, and the lower boundary is 2536.855. The current seller's vector 6-7 has reached the first target of 2605.31, and the price has nearly hit the second target of 2581.445. The seller’s daily bar on December 18th showed good volume and spread.
It is risky to look for short trades now since the price is at the lower end of the range. You can search for buying patterns as an idea for the buyer's vector 7-8 with a potential target of 2721.42. However, there are two factors to consider:
1. The seller’s daily bar from December 18th with good volume and spread indicates strong sellers, from which a seller could resume. To find a buying pattern, it would be ideal for the seller to resume from this bar (e.g., on the hourly timeframe) and be overcome by the buyer.
2. The price has not yet touched the buyer's zone (green rectangle on the chart), with its upper level being the second target (2581.445). To find a buying pattern, it would be ideal for the price to enter the buyer's zone and see the buyer's resumption from there.
If both factors are met, the likelihood of a successful buying pattern will be significantly higher—observing the seller's resumption, the touch of the buyer’s zone, and the buyer’s resumption.
I wish you profitable trades.

LLY 1H Swing Long Aggressive Trend TradeAggressive Trend Trade
- short impulse
+ volumed TE / T1
+ support level
+ biggest volume Sp
+ weak test
+ first bullish bar close entry
Calculated affordable stop limit
1 to 2 R/R take profit
Daily Context
"+ long impulse
+ 1/2 correction
- expanding T2
+ support level
+ volumed manipulation"
Monthly Context
"+ long impulse
+ 1/2 correction
+ T2 level
+ support level
- biggest volume manipulation"
Yearly Context
"+ long impulse
- neutral zone"

AFKS Swing 1H Long Conservative CounterTrend TradeConservative CounterTrend Trade
+ long balance
+ 1/2 correction
+ volumed ICE level
+ support level
+ biggest volume 2Sp-
+ weak test
- above first bullish bar close entry
Calculated affordable stop limit
1 to 2 R/R take profit
Daily Context
"- short impulse
+ volumed TE / T1 level
+ volumed manipulation
+ support level"
Monthly Context
"- short impulse
+ biggest volume T1 level
- below 1/2 correction
+ support level
- one bar reversal?!"
Yearly Context
"- short impulse
- neutral zone"

BTCUSDT. Where to expect the buyer’s resumption?Hey traders and investors!
On the 4-hour timeframe, there is a sideways range. The lower boundary is 90,500, and the upper boundary is 104,088.
The buyer effectively broke out above the upper boundary in the 12-13 vector. The seller returned the price to the range, and the buyer resumed from the 103,333 level, forming a test level. Below this test level is the buyer’s zone (green rectangle on the chart, upper boundary of the zone is 102,540).
If the buyer does not defend the 103,333 test level, the next buyer resurgence is possible from the buyer’s zone, most likely in the 100,500-102,000 range.
The third possible place for a buyer’s resurgence is around 50% of the last buyer’s impulse: 98,574 on the 4-hour timeframe and 99,426.5 on the daily timeframe.
Considering the three buyer interest zones and the buyer's trend on the daily timeframe, searching for sell opportunities based on the 13-14 vector within the sideways range, with a potential target of 94,150 (90,500), is risky.
I wish you profitable trades.

Ctxc now what ?
A reaction is expected within the area. It can break down and turn into IFVG, while an upward break may signal the beginning of the rise again. YTD.

BDL - An update and a VSA Learning ExerciseThis is just a learning exercise. We had anticipated a good move from this stock. However, 1230 was the trigger point for the Up move Now let us do a bar to bar analysis.
Refer the box marked “A”. We can see there was a sideways move or a consolidation happening. We can see the prices clustering together and the volume became low. It Indicated accumulation going on.
Refer to the bar marked “B”. It is an up bar with increased volume. This bar was an indication that things are about to change.
Refer to the Bar marked “C”. The next bar is a wide spread bar going past the trigger point, ending near the top. Also, we can see the volume increased volume indicating a high probable Breakout.
And today's bar (marked “D’) opened up above the previous close. The bar did see some selling, but finally it overcame the selling and closed up. Of course, the spread was not, the spread was narrow indicating selling pressure still present.
We can see the stock has started its up move and it is all supported by increased volume and the momentum. The price action momentum is also driven by volume and we can see increased relative strength. All that support further up move and the first obstacle we could see would be 1365, where we may see some more consolidation before further up move. This whole exercise is just for learning purpose.

Gold and silver have corrected to the first targetsHey traders and investors!
Gold and silver prices have reached the buyer's interest zones: 2650-2627 for gold and 30.3165 for silver.
Let’s see if the buyer is strong at these levels or if the price will continue to decline.
A deeper correction would be preferable. Detailed analysis in related posts.
Good luck with your trading and investments!

BDL - On the Recovery ModeCurrently we can see many of stocks which had substantially come down from their highs are in the recovery mode. We will be covering some of these in the coming few days. We will start with the first one which is Bharat Dynamics Ltd.
The stock saw a bearish down move of more than 15% and ended up below the 200 DMA. Now it looks like it is on the recovery mode. It has crossed above the 200 DMA and the short-term moving averages. Also, it has broken the supply line as well. We can see good volume support coming in. All key parameters like the relative strength, money flow, buying pressure and the volume adjusted momentum all seem to be favouring the up move. The stocks saw a quick up move, then it saw a small consolidation and has started resuming the up move. We can see a break of structure on the daily time frame. Now the stock is making a higher high and higher low structure and is likely to continue the up move. We could see a substantial up move and the stock could test the previous high of 1770. Of course, the overall market situation should also support the move. However, the downside is now capped and we can see more upside only.

XAUUSD. Trading within the range.Hey traders and investors!
I expected a correction to 2605.31 and a good buyer's resumption last week, but the correction didn't happen. Let's look at the chart.
A range has formed on the daily timeframe. The upper boundary is 2721.42, and the lower boundary is 2536.855.
The buyer's vector 5-6 has reached the upper boundary of the range. The seller's vector 6-7 is now relevant, with potential targets at 2605.31 (2581.445, 2536.855).
There was a consolidation in the middle of the range, so a buyer's resumption may occur within the 2650-2627 range.
Good luck with your trading and investments!

AAVE and ONDOHello traders and investors!
It's time for a correction in crypto assets. I've selected two assets that look stronger than the market.
AAVE
On the daily timeframe, there is an uptrend. There was a false breakout of the level marking the start of the last buyer's impulse – 240.05.
On the hourly timeframe, there is a sideways range, and the buyer's vector 9-10 is active.
You can look for buy opportunities with targets at 300 (288, 297).
ONDO
On the daily timeframe, the buyer has formed an impulse. There was a small correction, during which a buyer's zone formed yesterday (green rectangle on the chart). The level of the daily test, 1.61094, passes through this zone.
On the hourly timeframe, the price formed a range. The buyer’s vector moved above the upper boundary of 1.68925, but the buyer returned the price to the range, forming a seller’s zone at the top of the range (red rectangle on the chart) and hit the daily test level of 1.61094.
You can look for buy opportunities with targets at 1.95 and 2.0, preferably from the buyer's defense at 1.61094 or 1.46712 if the price returns to those levels.
Good luck with your trading and investments!

XAGUSD. Trading opportunityHi traders and investors!
Overall, nothing particularly interesting is happening in the market from a daily timeframe perspective. If we don't delve into lower timeframes to look for trades, silver can be considered.
Daily Timeframe Analysis
On the daily timeframe, the price has formed a range that began in April. The upper boundary is 32.5185, and the lower boundary is 26.0185. The seller's vector 9-10 is relevant, with a potential target of 26.471 (26.0185). The price has reached the level of 32.16, where the seller might resume (see previous posts). Below, a buyer’s zone has formed with an upper boundary of 31.478, what could become an obstacle for the seller.
4H Timeframe Analysis
On the 4-hour timeframe, the price has also formed a range. The upper boundary is 31.5365, and the lower boundary is 29.643. The buyer’s vector 9-10 has moved beyond the upper boundary of the range.
If the seller returns the price into the range (below 31.5365) and defends this return, the seller’s vector 10-11 will be relevant, with a potential target of 30.3165 (29.643).
If the buyer defends the breakout from the range, the potential target is to update the local high (31.286) and reach 31.5185 (the range boundary on the daily timeframe).
From my subjective point of view, the daily timeframe currently favors the continuation of the buyer's movement. However, a correction down to 30.3165 is possible.
Good luck with your trading and investments!

HUDCO - On the recovery Path ? The next recovery stock which we are going to look at is HUDCO or the Housing and Urban Development Corporation Limited. The stock saw a drop or reversal of 15% and was pushed below the 200 DMA and from there it has been recovering. As you can see now, it is above the 200 DMA and also the short-term moving averages. It has started making a higher high on the daily. It is also making a higher high on the weekly as well. All the supporting key parameters are all positive, the relative strength, the money flow, buying pressure, all are quite positive and is supporting further up move. We can see good increase in the delivery volumes indicating committed buying. So, the stock could test the previous high of 350 levels. Of course, it is not going to be a quick up move, it is going to be a grinding up move, but definitely it is likely to move up. The risk reward ratio also is looking quite good at this moment. So, this is a stock to be watched.

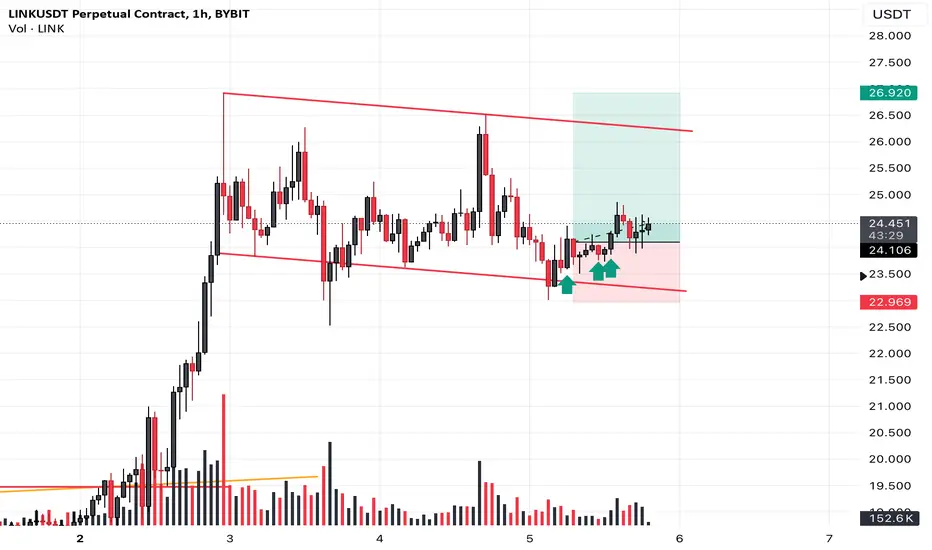
link-- long call
I see overall volume decrease, in addition to that the sellers has a diminished downward result--- a suggestion for seller absorption in the background. i want to see the price behavior around the resistance area.
BTCUSDT. Short term analysisHello traders and investors!
Daily Timeframe Analysis
On the daily time frame, a range was formed on November 14, with the lower boundary at 85,072 and the upper boundary at 93,265.64. The seller's vector 5-6 is currently in play, with a potential target of 86,128.21 (85,072). Yesterday, the seller attempted for the second time to push the price back into the range below 93,265.64, but the buyer is still buying up.
Hourly Timeframe Analysis
On the hourly time frame, the seller has formed an impulse, with the impulse starting at 104,088 and ending at 90,500. Currently, the buyer has pushed the price back above 97,416.59, which is the start of the last buyer's impulse. The first resistance for buyers is 98,828-99,000.
In a situation like this, it’s difficult to give priority to either the buyer or the seller. Formally, as long as the price is above 97,416.59, buying opportunities can be considered. If the price drops below 97,416.59, selling opportunities can be considered.
It’s preferable to see strength from one of the sides (spread and volume), such as in the form of a buyer’s or seller’s zone, and then join the buying from the buyer's zone or selling from the seller’s zone upon their resumption.
Good luck with your trading and investments!
