17.11.25 Morning ForecastPairs on Watch -
FX:EURUSD
FX:EURCAD
OANDA:AU200AUD
A short overview of the instruments I am looking at for today, multi-timeframe analysis down to what I will be looking at for an entry. Enjoy!
W-patterns

GBPAUD / EURUSD / NZDJPY / USDJPY Trade Recap 15.11.25Four positions broken down in this trade recap. A solid short taken on GBPAUD at the beginning of the week which gave me the opportunity to execute on the remaining three other positions. Still ending the week breakeven, understanding my natural sequence and moving into next week with a clear plan of action.
Any questions you have just drop them below 👇

14.11.25 Morning ForecastPairs on Watch -
FX:GBPUSD
A short overview of the instruments I am looking at for today, multi-timeframe analysis down to what I will be looking at for an entry. Enjoy!

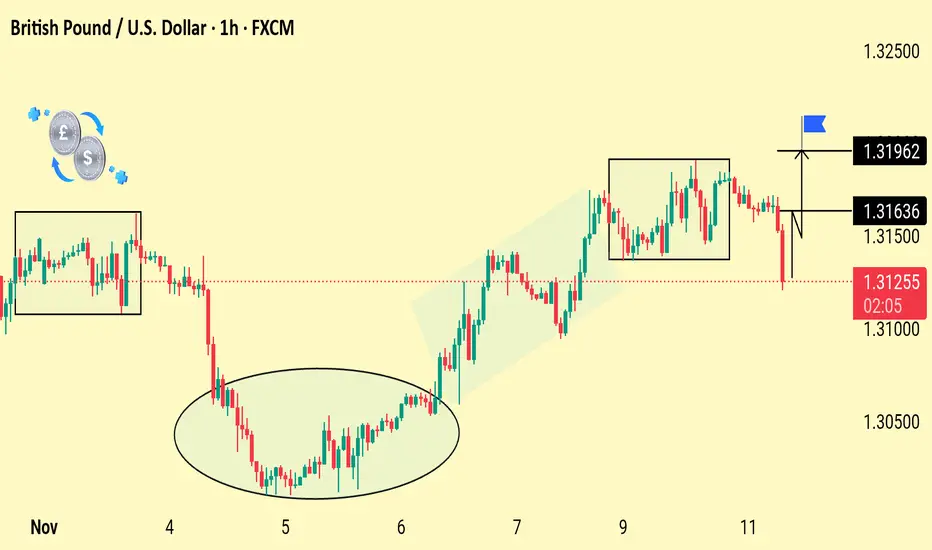
GBP/USD Breakout Watch: Key Levels in FocusGBP/USD is trading inside a consolidation zone after a sharp recovery. A breakout above 1.31636–1.31962 may signal bullish continuation, while failure to hold support increases downside risk.
Price dropped out of the recent consolidation box and is now trading below 1.31636 support. This breakdown shows short-term bearish pressure. If the pair stays below this zone, it may retest lower levels toward the recent lows. Bulls need a quick recovery back above 1.31636 to regain control.
13.11.25 Morning ForecastPairs on Watch -
FX:NZDJPY
FX:NZDUSD
FX:USDJPY
A short overview of the instruments I am looking at for today, multi-timeframe analysis down to what I will be looking at for an entry. Enjoy!

BTC BREAKING NEWS OR BREAKING CHARTS?📰 BREAKING NEWS OR BREAKING CHARTS?
TRUMP IMPOSES TARIFFS, CAUSING A BITCOIN BLOODBATH — $20,000 DRAWDOWN IN 2 HOURS!
Bitcoin was sitting comfortably at $121,000, before a sudden macro shock — triggered by newly imposed U.S. tariffs — sent prices spiraling down to $100,000 in a matter of hours.
Bulls were liquidated. Bears rejoiced.
Now, the market stands at a crossroads: will this become a major dump continuation, or the foundation for a secret pump?
Chart Overview & Structure
On the high timeframe, BTC continues to trade within a rising wedge formation, with price now showing a significant wick rejection from the upper boundary. This move suggests a potential shift in market structure — a moment that’s likely to shake inexperienced traders. The chart reveals a clear supply and demand structure:
Supply Zone: $123,452 – $130,000
D emand Zone: $98,826 – $101,400
These zones define the battlefield between bulls and bears. In addition, eight psychological levels dominate the chart — $100K, $105K, $110K, $115K, $120K, $125K, and $130K — each representing potential liquidity clusters and reaction points.
Adding to the complexity, we can see a golden pocket (0.618–0.65 retracement) forming around $106,000, perfectly aligning with prior swing lows and the midpoint of a large Fair Value Gap (FVG) overhead. This zone could serve as a reversal or continuation point depending on whether price can reclaim and hold above the major support trendline.
Technical Insights
The market has now tapped the rising wedge resistance three times, with the last tap forming a wick above $125K, triggering liquidity before the sharp collapse. This aligns with the classical exhaustion behavior of wedges. Moreover, a potential Head and Shoulders structure is beginning to emerge, with the right shoulder aligning near $115K — a confluence area that may attract strong bearish attention.
For now, price is testing the lower support trendline — a crucial pivot area for determining whether BTC continues to break down toward demand or consolidates for recovery. This structure creates a make-or-break zone that will define the next macro leg.
Bullish Scenario
Despite the panic, this could be a classic liquidity flush — a “flush candle” event designed to wipe out leveraged long positions before a larger move upward. If BTC can maintain structure above the major support line and close above $106K–$110K, it opens the door for a relief rally.
A reclaim of $115K would confirm buyer strength.
Sustained momentum could push BTC back into the $120K–$125K range to retest the broken supply zone.
Breaking through $125K would invalidate the bearish wedge, potentially igniting a run toward $130K+ and even new highs in “Pump-tober.”
In this scenario, the deep liquidation event becomes fuel for a massive short squeeze, driving momentum and reigniting bullish sentiment across crypto markets.
Bearish Scenario
On the flip side, if BTC fails to hold above $106K or decisively breaks below the demand zone at $98K, it would confirm a rising wedge breakdown.
Below $100K, momentum could accelerate toward $95K–$92K — the next liquidity pools and volume gaps.
The Head and Shoulders completion would confirm the bearish reversal structure, further strengthening the downside case.
Macro sentiment, fueled by geopolitical and policy fears, could add weight to the bearish outlook.
A rejection from $115K without sustained reclaim would also reinforce the bearish continuation pattern, with every psychological level above turning into resistance.
Summary
Bitcoin is at an inflection point — the $100K–$115K range will define the next macro move.
The recent wick and structure breakdown hint at weakness, but the flush candle and liquidity sweep also suggest that a bullish rebound could be on the horizon.
In short:
Above $115K → Bullish continuation possible.
Below $100K → Bearish expansion likely.
With volatility at its peak, traders should expect massive liquidity hunts, fakeouts, and emotional traps on both sides.
Whether this becomes the start of a macro correction or a secret accumulation phase before a major pump — the next few daily closes will tell the story.

12.11.25 Morning ForecastPairs on Watch -
FX:NZDJPY
FX:GBPJPY
A short overview of the instruments I am looking at for today, multi-timeframe analysis down to what I will be looking at for an entry. Enjoy!

11.11.25 Morning ForecastPairs on Watch -
FX:GBPAUD (Currently live in a short)
FX:GBPUSD
FX:GBPJPY
A short overview of the instruments I am looking at for today, multi-timeframe analysis down to what I will be looking at for an entry. Enjoy!

10.11.25 Morning ForecastPairs on Watch -
FX:GBPAUD
A short overview of the instruments I am looking at for today, multi-timeframe analysis down to what I will be looking at for an entry. Enjoy!

Bitcoin Faces Rejection — Targeting 101,300 SupportBitcoin (BTC/USD) is showing a potential bearish setup around the 103,000 level, with resistance near 104,500. A pullback is expected, targeting the 101,300 support area for a possible short-term decline.
Title: Bitcoin Bearish Rejection Toward 101,300 Target

ZEN (Horizen) Could Behave Well In The Weeks AheadIts funny how human psychology may repeat Beauty is that charts can visually show you patterns, no matter the timeframe. Its amazing how human psychology may repeat itself. Beauty here is that charts can visually show you human psychology in patterns, no matter the timeframe you're comparing them to.
It has many similar tokenomics as Zcash (ZEC)
DISCLAMER:
Non of this should be take as a financial advise. Be well.

Gold Upholds Trendline Support, Targeting 4010Gold price is following an upward trendline, holding above the support zone near 3984. The next target is set at 4010 if bullish momentum continues.

07.11.25 Morning ForecastPairs on Watch -
FX:EURAUD
FX:AUDJPY
A short overview of the instruments I am looking at for today, multi-timeframe analysis down to what I will be looking at for an entry. Enjoy!

Gold Price Breakout Above Trendline Targets 3980 Gold (XAU/USD) is showing bullish momentum, breaking above the trendline resistance around 4000. Price is currently near 4008, with potential pullback targets around 3980 and 3965 if retracement occurs. Trend remains positive above the rising trendline.

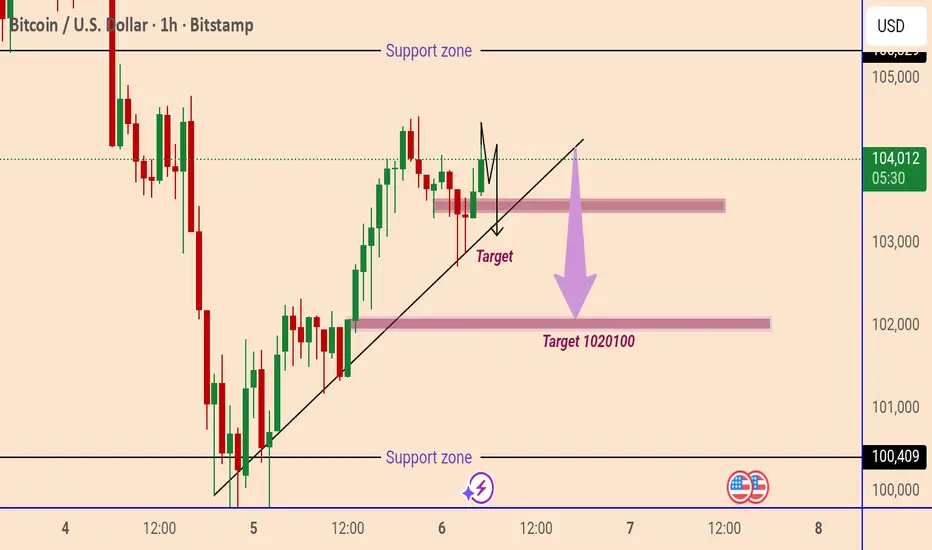
Bitcoin Trendline Breakdown SetupBitcoin (BTC/USD) is trading around $104,010, showing a mild bullish correction. However, the chart suggests a potential downward move if price breaks below the trendline support. The next targets are around $103,000 and $102,000–$102,100, with a major support zone near $100,400.
06.11.25 Morning ForecastPairs on Watch -
FX:EURJPY
FX:EURCAD
A short overview of the instruments I am looking at for today, multi-timeframe analysis down to what I will be looking at for an entry. Enjoy!

EUR/USD Bullish Reversal Toward 1.1510 TargetEUR/USD is trading near 1.1483, holding above the 1.1468 support zone. A bullish move is expected if the pair stays above support, with potential targets at 1.1500 and 1.1510.

Gold Price Targets 3990 After Support ReboundGold (XAU/USD) is trading around 3966, showing bullish momentum after rebounding from the support zone near 3928. The price is moving within an ascending channel, with a short-term target set at 3990. A breakout above this level could push prices toward the next resistance near 4006.

05.11.25 Morning ForecastPairs on Watch -
FX:EURAUD
FX:GBPNZD
FX:AUDJPY
A short overview of the instruments I am looking at for today, multi-timeframe analysis down to what I will be looking at for an entry. Enjoy!

Gold Price Pullback Targets After Recent RallyGold price is trading around $3,980, showing a 1.22% gain on the 1-hour chart. The chart suggests a potential pullback with downside targets at $3,971 and $3,960 after recent bullish momentum.

Gold Price Breaks Support, Targeting 3950 ZoneGold price has broken below the trend line and key support zone, indicating bearish momentum. A retest of the broken support is expected before continuing down toward the target level at 3950.

Bitcoin Support Zone Rebound SetupBitcoin (BTC/USDT) is approaching a key support zone around 103,000–104,000. A potential rebound from this area could trigger a bullish move toward the first target near 105,000 and the second target around 106,500.

04.11.25 Morning ForecastPairs on Watch -
FX:EURAUD
FX:EURCAD
FX:EURUSD
A short overview of the instruments I am looking at for today, multi-timeframe analysis down to what I will be looking at for an entry. Enjoy!
