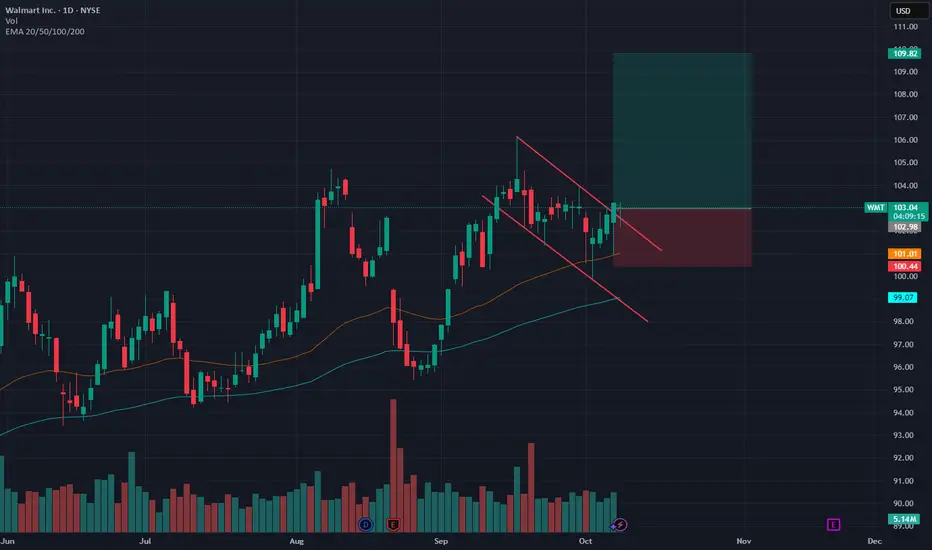
Walmart (NYSE: $WMT) Bulls Eye a Reversal Near Key SupportWalmart’s stock is showing early signs of a potential rebound after testing a crucial support zone near the $100 level. This area has acted as both resistance and support in the past, making it a critical price floor for buyers. The chart displays a well-defined ascending trendline that has held since early 2025, signaling a long-term bullish structure.
Currently trading around $102, Walmart appears to be forming a higher low, which could serve as the base for a new bullish leg. This new leg may lead to a breakout toward $109 and possibly higher if volume confirms renewed buying pressure.
Fundamentally, Walmart continues to benefit from its dominant retail position and strategic investments in e-commerce and automation. The company’s ability to manage supply chains efficiently and maintain stable margins during inflationary periods has strengthened investor confidence. Additionally, its focus on expanding grocery delivery and membership programs has kept revenue growth steady even amid consumer spending shifts.
If the $100–$101 region continues to hold, technical traders may anticipate a bounce back toward the $108–$110 resistance zone. A clean break above that level could open the door for a move to new highs around $114. Conversely, a close below $98 would invalidate the bullish thesis and suggest further downside toward $94.
With strong fundamentals, consistent dividend growth, and a chart structure hinting at a technical reversal, Walmart’s setup appears attractive for medium- to long-term investors watching for confirmation of momentum.
Walmarttrend

PERFECT WALMART LONGNYSE:WMT has shown strength recently, and is now showing signs of an imminent breakout from its consolidation. The previous HTF break of structure at 104.76 is telling of upside potential. Couple this with its bullish consolidation within a downward channel over the last 3-4 weeks, where price has recently strongly rejected a HTF 0.5fib retracement and the daily 50ema.
Above you can see the major Bollinger band constriction on the daily chart, indicating a very large move in price is getting ready to take place. With the confluence of all these technicals I am willing to say the move will be up. I am targeting a 1.618 fib extension which aligns exactly with a price of 110.
The 4hr timeframe above shows rejection of 50ema and an inside pin, all bullish.
Coupled with the 1hr timeframe below showing a break of structure to the upside with a clean rejection of both 50 and 100 ema. We can enter long on the LTF.
Analysing the Spike in Volatility on the Walmart (WMT) ChartAnalysing the Spike in Volatility on the Walmart (WMT) Share Price Chart
On Thursday, the US retail giant reported its quarterly results — which turned out to be broadly better than expected. While total revenue was roughly in line with analysts’ forecasts, earnings per share came in higher at $0.61 versus the expected $0.57.
At the same time, Walmart CEO Doug McMillon stated on Thursday:
"We will do everything we can to keep our prices as low as possible. But given the scale of the tariffs, even at reduced levels, we won't be able to absorb all the pressure, considering the reality of tight retail margins."
This statement may have raised concerns among market participants about the company’s future earnings, contributing to Friday’s drop in the share price to $92.
It also drew the attention of the US President. On Saturday, Donald Trump said that Walmart (WMT) should “swallow the tariffs” instead of blaming them and raising prices.
In response, Walmart reiterated that it will keep prices as low as possible for as long as it can — which has always been the company’s approach.
Technical Analysis of the WMT Stock Price Chart
Looking at the broader market context, we can see that price fluctuations formed a narrowing triangle in late April — a sign that buyers and sellers had reached some agreement around a fair value of approximately $95.50.
In early May, sentiment shifted in favour of the bulls, with this level acting as support (marked by an arrow).
The earnings release triggered a spike in volatility — the ATR indicator is now at a one-month high. The Walmart stock price extremes seen at the end of last week suggest two key levels, roughly equidistant from the $95.50 axis:
→ resistance around $99 (reinforced by the psychological level of $100);
→ support around $92.
Given the above, it is reasonable to suggest that once the market has digested the news, price movements may calm down again. In that case, we may well see another narrowing triangle form on the WMT chart — slightly above the previous one.
This article represents the opinion of the Companies operating under the FXOpen brand only. It is not to be construed as an offer, solicitation, or recommendation with respect to products and services provided by the Companies operating under the FXOpen brand, nor is it to be considered financial advice.

Walmart (WMT) shares reach highest level since early MarchWalmart (WMT) shares reach highest level since early March
As shown on the chart of Walmart (WMT) shares, trading closed yesterday above the $94 mark – a level not seen since the beginning of March. This means that since the start of 2025, Walmart’s share price has risen by approximately 5.5%.
This positive trend stands in stark contrast to the S&P 500 index (US SPX 500 mini on FXOpen), which has declined by more than 8% over the same period.
Why are Walmart (WMT) shares outperforming the index?
Apparently, from the market’s point of view, this is due to the fact that Walmart’s supermarkets are a source of essential goods for Americans, giving the company an advantage in a scenario where the US economy may slide into recession.
According to Mizuho Bank analyst David Bellinger, Walmart is a sensible choice for investors trying to stay afloat in a volatile market. He forecasts that WMT’s share price could rise to $105 – around 15% higher than its current level.
Bellinger notes that Walmart continues to attract price-conscious shoppers and has made significant progress in e-commerce, helping the company remain resilient even amid the prospect of economic slowdown.
Technical analysis of Walmart (WMT) shares
The chart shows that the share price is moving within a long-term upward trend. The black dashed line, which had acted as support for many months, has been broken:
- This suggests that the line may now act as a median.
- Allowed us to widen the channel and find its lower boundary, which is expected to offer support.
Indeed, the lower boundary of the expanded channel provided support in the first half of April, with particular attention drawn to the large bullish candlestick on 9 April (marked with an arrow). According to the NYSE, over 46 million shares were traded on that day – more than twice the average volume. This highlights the strength of demand.
It is possible that WMT shares may continue to outperform the index going forward, forming fluctuations while:
- receiving support from the psychological $90 level (previously a resistance point);
- gradually approaching the median of the aforementioned channel.
This article represents the opinion of the Companies operating under the FXOpen brand only. It is not to be construed as an offer, solicitation, or recommendation with respect to products and services provided by the Companies operating under the FXOpen brand, nor is it to be considered financial advice.

WalmartWe are in the correction, and I think it will continue for more time.
But the Trend is still Bullish in the long-term.
Follow for notifying more Analysis.
Boost, Comment for signal, and more.

Walmart: Within Reach 🙌Ever been to the supermarket and couldn’t reach the topmost rack? Walmart seems to have a similar problem, struggling to let go of the mark at $150.12 to hit the turquoise zone between $152.54 and $161.76. However, we expect the share to touch at this area soon to finish wave B in turquoise. This done, it should turn downwards, returning below $150.12 and slipping further below the support at $136.09 to complete wave (A) in magenta. After a short counter movement back above $136.09, the share should drop below the support at $117.27 and into the gray zone between $116.49 and $105.01 to place the final low of wave IV in gray, which should then initiate a new upwards trend. There is a 37% chance, though, that Walmart could shoot through the turquoise zone and conquer the resistance at $161-76 directly.

WALMART Daily TimeframeSNIPER STRATEGY
This magical strategy works like a clock on almost any charts
Although I have to say it can’t predict pullbacks, so I do not suggest this strategy for leverage trading.
It will not give you the whole wave like any other strategy out there but it will give you huge part of the wave.
The best timeframe for this strategy is Daily, Weekly and Monthly however it can work any timeframe above three minutes.
Start believing in this strategy because it will reward believers with huge profit.
There is a lot more about this strategy.
It can predict and also it can give you almost exact buy or sell time on the spot.
I am developing it even more so stay tuned and start to follow me for more signals and forecasts.


Walmart Buy Walmart using three Trend lines yellow, green and red trend lines . Buy at 132.42 price near the green line .Target of 140 around 5% - Yellow line. Stop Loss is the red line around 1.79% @ If it starts breaking the red trend line . You can also take a Short Position when it crosses red line. . Then it can go Down. Also RSI there seems more room for upward movement. For risk of 1.74 % there is an upside of 5%

WALMART INC. (WMT) DailyDates in the future with the highest probability for price direction reversals
