EMCURE - Fresh breakout ?It has broken out of a 3-month trading range and looking to hit fresh highs. On the Elliott Wave front, this seems to be a Wave 3 with potential targets above 2000.
Wave3

BIDU – Breakout Confirmed | Watching Wave 3Thesis
BIDU has completed a multi-year corrective phase and is now advancing within a developing Wave 3 structure following a confirmed breakout.
Context
- Weekly timeframe
- Prolonged correction since 2021
- Structural transition from downtrend → base → breakout
What I see
- Clean breakout confirmed at the end of December
- Prior support found on the 50-day moving average before expansion
- Successful acceptance above former resistance
- Price holding above long-term trend support
- Structure now showing impulsive characteristics
What matters now
- Wave 3 remains intact while price holds above post-breakout support
- After Wave 3 completes, attention shifts to a controlled Wave 4 pullback
- Confirmed support during Wave 4 would define the next add opportunity
Buy / Accumulation zone
- Initial breakout already played
- Next accumulation opportunity expected on confirmed Wave 4 support
Targets
- Primary upside reference at the 1.618 Fibonacci extension ($225 area)
- Higher extensions remain possible if momentum persists
Risk / Invalidation
- Loss of key breakout support would delay the bullish structure

ZETA – Breakout Confirmed | Primary Wave 3Thesis
NYSE:ZETA is transitioning from long-term accumulation into the early phase of Primary Wave 3 following a confirmed breakout.
Context
- Daily / weekly structure
- Primary Wave 2 completed near $10 (April 2025)
- Wave 1 advanced to ~$22
- Recent phase was a controlled Wave 2 consolidation
What I see
- Price has broken out of the accumulation structure
- Higher highs and higher lows now in place
- Price holding above rising moving-average support
- Former resistance has turned into support
What matters now
- Holding above the breakout level keeps the Wave 3 structure intact
- Pullbacks toward former resistance should be viewed as constructive
- Momentum confirms a shift from accumulation to expansion
Buy / Accumulation zone
- Initial accumulation was completed in the $14–$15 area
- Post-breakout pullbacks into support remain add zones
Targets
- $38 area (structural resistance)
- $65 area (1.618 Fib – Primary Wave 3)
- $100 area (Primary Wave 5 extension)
Risk / Invalidation
- Loss of post-breakout support would delay the Wave 3 scenario

UPS – Weekly Structure | Wave 3 Breakout in ProgressThesis
NYSE:UPS is breaking out from a multi-month consolidation and transitioning into an impulsive Wave 3 structure, supported by improving price action and strong income characteristics.
Context
- Weekly timeframe
- Prolonged corrective phase followed by tightening consolidation
- Price has recently reclaimed key moving averages
- Dividend yield remains elevated, supporting longer-term positioning
What I see
- Price has broken above the 50-week moving average
- Psychological resistance at the $100 level has been cleared
- The upper boundary of the descending wedge has been breached
- Structure is consistent with the early stages of a Wave 3 advance
What matters now
- Holding above the $100 breakout zone is key to maintaining bullish structure
- Follow-through should remain controlled rather than impulsive, consistent with NYSE:UPS historical behavior
- Failure to hold the breakout would likely result in consolidation rather than trend failure
Buy / Accumulation zone
- Retests of the breakout area above $100 remain the primary zone of interest
- Risk is defined against the former wedge resistance
Targets
- Wave 3 reference aligns with the 1.618 Fibonacci extension near the $120 area
- Longer-term structure remains capped by the 200-week moving average overhead
Risk / Invalidation
- A sustained move back below the $100 level would weaken the breakout thesis

TESLA TO BTC & TOTALThis analysis compares NASDAQ:TSLA performance relative to BINANCE:BTCUSDT .
As you can see, Tesla’s stock is showing a bullish stance against Bitcoin and appears to be at the beginning of its Elliott Wave 3.
This chart delivers Four key messages:
1.Bitcoin is expected to decline while Tesla moves higher
2.Bitcoin is expected to drop while Tesla moves into a range
3.Both are expected to decline, but Tesla is likely to fall less than Bitcoin
4.Both rise, but Tesla gains more.
I’d be happy if you shared your thoughts.
NASDAQ:TSLA
BINANCE:BTCUSDT
CRYPTOCAP:TOTAL
BINANCE:BTCUSD

Wave 4 Finishing – Preparing for the Final Wave 5 Impulse (EW)We are currently completing wave 4 — both in the subwave and sub-subwave count — and getting ready for the final impulsive wave 5.
According to Elliott Wave rules, wave 4 cannot overlap with wave 1, which also defines our stop-loss level. As long as this level holds, the bullish structure remains valid.
Wave 4 has retraced between the 0.382–0.5 Fibonacci zone, perfectly matching the expected correction depth. Since wave 2 was extended in time, we expect a shorter and faster wave 4, often characterized by a quick wick and rejection before continuation.
From the indicator side:
RSI, Stoch, and MACD are all oversold and starting to curl up on multiple timeframes — 15m, 45m, and 144m.
The B-leg of the correction was overbought, signaling exhaustion and confirming the upcoming C-leg completion.
With that, we are in position for the start of wave 5, which should complete the macro wave 3.
🎯 Trade Setup:
Entry: Current zone (0.382–0.5 retracement range)
Stop-loss: Below wave 1 invalidation level
Target: Extension of wave 5 from wave 3 to wave 4, We target the 2.618%
Summary:
Wave 4 is finishing, indicators align across timeframes, and all Elliott conditions are in place for a strong push into wave 5.

SounHound Ai looks promisingSoundHound AI NASDAQ:SOUN is a technology company specializing in conversational AI and voice-enabled solutions which will become increasingly crucial in the upcoming AI world.
After an initial runup towards $25 at the end of 2024, it has corrected nicely and now seems ready to climb higher as long as support at $6.52 is holding.
Next resistances at $25 but main target at $38 then $52.

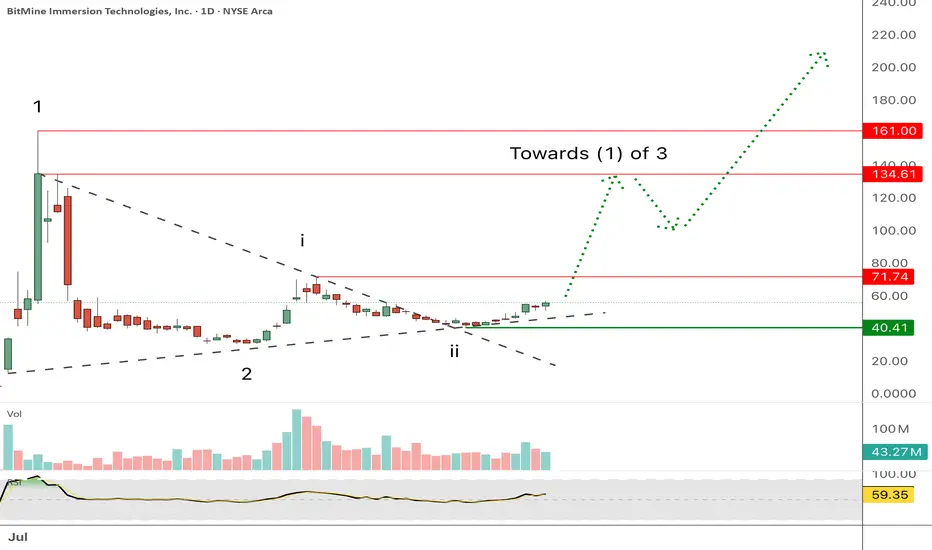
BitMine Immersion Technology looking higherAMEX:BMNR seems ready to resume its uptrend.
This Ethereum holding company lead by Tom Lee and backed by Peter Thiel is betting that Ethereum will be the backbone of the tokenization of the economy in the upcoming AI world.
A break above $71 would open the $134 area as long as support in the $40 region is holding.
The cloud with the help of the Tenkan we will rise!!Shit is about to get real.
I was telling folk to look at BTC @ $19....
This could be the time.
NOT FINANCIAL ADVICE

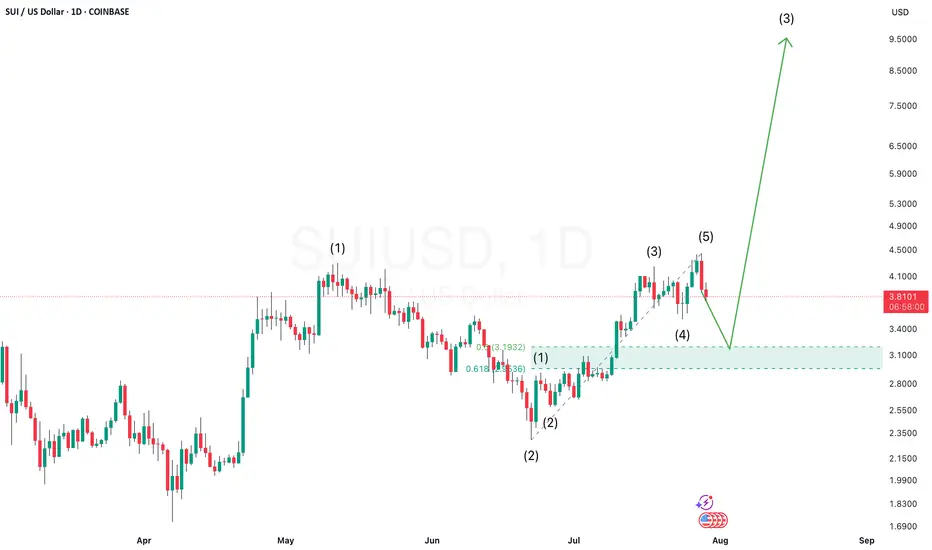
SUIUSD Setting Up for a Potential 1-2, 1-2 Pattern — Wave 3 BlasSUIUSD appears to be forming a classic 1-2, 1-2 Elliott Wave setup — a bullish structure that often precedes an explosive third wave rally.
In this pattern, we first see a motive Wave 1 followed by a corrective Wave 2, then another smaller-degree Wave 1 and 2 within the larger Wave 3. This kind of nested structure shows strong underlying bullish momentum building up in layers.
Once the second minor Wave 2 completes, SUI could launch into a powerful third wave of Wave 3, typically the strongest and most extended move in the sequence. That’s the breakout phase where price accelerates rapidly, often leaving late buyers behind.
Watch for confirmation
Potential Reversal Ahead: Elliott Wave AnalysisHello friends,
Welcome to RK_Chaarts,
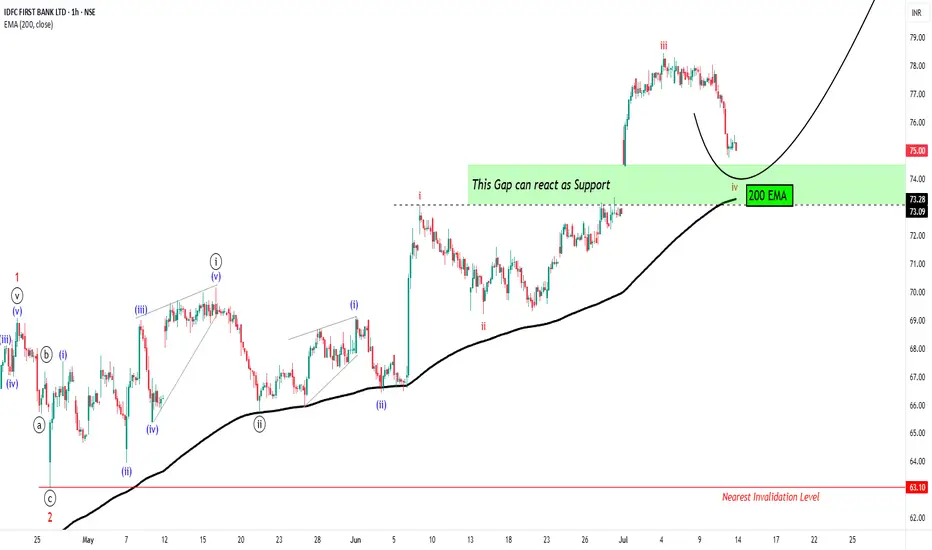
Today we're going to analyze chart of stock named IDFC First Bank, based on Elliott wave theory.
Today, we're analyzing the chart of IDFC First Bank using Elliott Wave theory. On the chart, we've marked the Elliott Waves, indicating that:
- Red wave 1 and 2 (Minor degree) have ended
- Price is unfolding into red wave 3 (Minor degree)
- Black wave ((i)) and ((ii)) (Minute degree) have completed
- Black wave ((iii)) (Minute degree) is ongoing
- Blue wave (i) and (ii) (Minuette degree) have finished
- Blue wave (iii) (Minuette degree) is in progress
- Red wave i, ii, and iii (Subminuette degree) have completed
- Possibly in the correction phase of red wave iv (Subminuette degree)
We observe that the price gapped up, retraced to correct wave iv, and is now supported by the gap zone. Along with 200Exponential Moving Average is also at Gap level which can also provide a good Support to same view.
Our estimate suggests a high probability of a price reversal. However, market uncertainties exist.
Potential price targets: 81, 93, and 100+
Nearest invalidation level: 73.09 (wave iv should not overlap wave i)
Please note that this analysis is for educational purposes only. I'm not a SEBI-registered analyst, and you should consult your financial advisor before trading or investing.
Let's see how the market unfolds. This entire study is shared solely for educational purposes. Thank you so much.
I am not Sebi registered analyst.
My studies are for educational purpose only.
Please Consult your financial advisor before trading or investing.
I am not responsible for any kinds of your profits and your losses.
Most investors treat trading as a hobby because they have a full-time job doing something else.
However, If you treat trading like a business, it will pay you like a business.
If you treat like a hobby, hobbies don't pay, they cost you...!
Hope this post is helpful to community
Thanks
RK💕
Disclaimer and Risk Warning.
The analysis and discussion provided on in.tradingview.com is intended for educational purposes only and should not be relied upon for trading decisions. RK_Chaarts is not an investment adviser and the information provided here should not be taken as professional investment advice. Before buying or selling any investments, securities, or precious metals, it is recommended that you conduct your own due diligence. RK_Chaarts does not share in your profits and will not take responsibility for any losses you may incur. So Please Consult your financial advisor before trading or investing.
KSMUSDT D – Start of Wave 3? After a clear 5-wave impulsive move up, KSMUSDT seems to have completed a deep ABC correction, potentially marking the end of Wave 2.
📉 Wave 1: We had a clean five-wave move from the bottom, which fits classic Elliott Wave structure.
📉 Wave 2: The correction that followed was much deeper than the ideal Fibonacci retracement zone. However, crucially, it never violated the low of Wave 1, which means it still holds valid under Elliott Wave rules. The correction unfolded as a textbook ABC pattern, with Wave C digging deep into the previous structure — showing panic selloff and possibly a final capitulation.
🔄 Key Development Now:
The resistance trendline of the correction has just been broken, suggesting potential momentum shift. This could mark the beginning of Wave 3, which is typically the strongest and most impulsive wave in Elliott Wave theory.
📈 Potential Target for Wave 3: Around the 39.5.80–42.00 area based on Fibonacci projections, but this is an early assumption and requires confirmation by price action and volume.
⚠️ Important Risk Note:
Despite this bullish technical setup, the current market remains risky. The bounce is fresh, and confirmation is still lacking. There's still the possibility of a deeper retest or invalidation of this count if price closes below the base of Wave 1.
🧠 Trade Plan:
- Wait for follow-through confirmation.
- Manage risk carefully — this is an early entry scenario.
- A stop below the recent low (~11.30) would be logical for this wave count.
📊 What do you think? Is this the beginning of a powerful Wave 3, or just another fakeout?
💬 Drop your thoughts or alternate wave counts in the comments!

EUR/USD 1H AnalysisWhat we’ve got here on EUR/USD looks like a clean Elliott Wave setup shaping up.
There’s a strong 5-wave move up that likely forms Wave 1, followed by a simple ABC correction — that gives us Wave 2.
Now price is reacting from that C point, and this could be the beginning of Wave 3, which is usually the most powerful part of the trend.
🟩 Entry Zone: 1.114 – 1.12
🎯 TP: 1.14
🛑 SL: 1.109
⚖️ Risk/Reward Ratio: 1:3
💡 Note: Always manage your risk and confirm with your own analysis before entering any trade.
Keep an eye on it — could be a solid setup if it confirms. Drop your thoughts if you're trading this too 👇

C98/USDT 15M ANALYSISHey Traders! 👋
I'm tracking a potential impulsive Elliott Wave structure on C98/USDT.
📈 Wave Count So Far:
- We completed a clean 5-wave impulsive move up — labeled i through v.
- This was followed by a classic zigzag (ABC) correction, forming what looks like a textbook
Wave 2.
- The corrective structure appears complete, and price is now holding above key support.
🔍 Current Expectation:
I'm now looking for Wave 3 to unfold, which typically brings the strongest momentum in the Elliott Wave sequence.
Trade Setup:
🟢 Entry Zone: 0.06 – 0.0615
🔴 Stop Loss: 0.05923
🎯 Target Price: 0.0652
💡 Note: Always manage your risk and confirm with your own analysis before entering any trade.

XOM to Double!Could be completing a Wave 2 correction formation. Appears to be a Reverse Head and Shoulders with a neckline just above 120. If, in fact, we are beginning a 3rd Wave, a 1.618 of Wave 1 move would put XOM at 240.

#btc #btcusd #elliottwave long buy setup wave 3 25Jan25This count is based on my assumptions so anything can happen not a trading or financial advice just for educational purposes only kindly do your own ta thanks trade with care good luck.

Elliott wave theory. Already 5 waves done!Looking for Impulse Down.
EurAud Wave 1,2,3,4 & 5 done, Will it go on to finish waves A, B, and C? I am anticipating wave C will be completed as well. Elliott wave theory. Make sure you have your own rules on RR and follow them. This is just a trading idea to help you gain better knowledge. If you have any question ask me in comments.
Learn & Earn!
Wave Trader Pro

#btc #btcusd #elliottwave long buy setup wave 3 29Dec24This count is based on my assumptions so anything can happen not a trading or financial advice just for educational purposes only kindly do your own ta thanks trade with care good luck.

#xauusd #elliottwave long buy setup wave 3 of 5 12Dec24This count is based on my assumptions so anything can happen not a trading or financial advice just for educational purposes only kindly do your own ta thanks trade with care good luck.

#xauusd #elliottwave short sell setup wave 3 12Dec24This count is based on my assumptions so anything can happen not a trading or financial advice just for educational purposes only kindly do your own ta thanks trade with care good luck.

#btc #btcusd #elliottwave long buy setup wave 3 9Dec24This count is based on my assumptions so anything can happen not a trading or financial advice just for educational purposes only kindly do your own ta thanks trade with care good luck.

#xauusd #elliottwave long buy setup wave 5 of 3 of 3 of 1This count is based on my assumptions so anything can happen not a trading or financial advice just for educational purposes only kindly do your own ta thanks trade with care good luck.

#Audusd #elliottwave long buy setup wave 3 4h 28Nov24This count is based on my assumptions so anything can happen not a trading or financial advice just for educational purposes only kindly do your own ta thanks trade with care good luck.
