XAU/USD | Potential for Short-Term AppreciationKey Levels to Watch for Gold (XAU/USD) based on the latest technical structure as of Monday, February 9, 2026:
⚡Intraday Resistance (200-Hourly SMA): This indicator represents crucial immediate resistance. Although the price is approaching this level, the downward sloping SMA indicates persistent selling pressure. A solid close above this level will spark renewed optimism among buyers, pushing the price higher.
⚡Further Recovery Target ($5,090 - $5,100): If gold manages to overcome the 200-hourly SMA, the next target is the psychological $5,100 area. A clear break above this level would confirm a recovery from the recent correction and pave the way towards the previous record high.
⚡Critical Support Level ($4,940 - $4,980): This consolidation area must be maintained to maintain the short-term bullish structure. A rejection at the 200-hour SMA followed by a decline below this zone would shift control back to bears and expose deeper support around $4,831.
Conclusion:
Gold is in a direction-determining phase near the 200-hour SMA. Successfully breaking through this resistance would strengthen the bullish outlook ahead of the Nonfarm Payrolls (NFP) release on Wednesday.
Waveanalyis

EUR/USD | Price Shows Moderate Upward MomentumEUR/USD moved within a narrow range around 1.1815 during today's Asian trading session.
Investors are in a "wait and see" mode ahead of the release of important Eurozone inflation data this afternoon and tomorrow's European Central Bank (ECB) policy meeting.
✅ Europe Focus: Awaiting HICP Data & ECB Meeting
Sentiment towards the euro currently depends heavily on inflation indicators and the direction of monetary policy:
- ⚡January HICP Estimates: Eurozone headline inflation (HICP) is projected to decline to 1.7% YoY (from 1.9%), while core inflation is expected to remain stable at 2.3% YoY. If this data is lower than expected, the euro risks weakening as markets speculate about an earlier ECB interest rate cut.
- ⚡ECB Meeting (Thursday): Markets expect interest rates to remain broadly unchanged. However, the main focus will be Christine Lagarde's press conference to see if the ECB will begin to soften its rhetoric in response to the decline in inflation below the 2% target.
✅US Focus: Services Sector & Kevin Warsh Nomination
The US Dollar (USD) maintains its strength as a safe-haven asset amidst domestic dynamics:
- ⚡"Warsh Effect": The nomination of Kevin Warsh as the next Fed Chair continues to support the USD. Warsh is seen as a more disciplined figure on inflation, which has triggered an increase in US bond yields.
- ⚡Labor & Services Data: The ADP Employment Change report (8:15 PM WIB) and the ISM Services PMI (10:00 PM WIB) tonight will be the main catalysts for volatility. Strong services data (consensus forecast at 53.8) will further strengthen the Dollar's position.
- ⚡Risk Sentiment: Still volatile geopolitical tensions (US-Iran) and trade tariff issues continue to maintain demand for the Dollar as a hedge.
✅ EUR/USD Technical Analysis (Intraday)
Technically, the pair is attempting to establish a support base after falling from its 2021 high last week.
- ⚡Critical Support ($1.1775 - $1.1800): This one-week low serves as a key defensive line. If this level is breached, EUR/USD risks sliding towards 1.1650.
- ⚡Immediate Resistance ($1.1870 - $1.1910): The euro needs to break above this area to ease selling pressure and retest the psychological level of 1.2000.
- ⚡RSI Momentum: The relative strength indicator is in the 42-45 range, indicating continued seller dominance but not yet reaching extreme oversold conditions.

EUR/USD is benefiting from the Greenland diplomatic crisis.The euro has recovered most of its January losses and is now targeting a critical resistance area.
⚡Psychological Support (1.1700): EUR/USD's success in holding above 1.1700 confirms a shift in short-term sentiment from bearish to consolidative with an upward bias.
⚡RSI (58 - 60): Is in the positive zone but not yet overbought, giving the euro room to attempt a further rally.
✅ Key Levels to Watch
⚡Major Resistance ($1.1750 - $1.1800): A breakout of 1.1750 would pave the way for EUR/USD to test the 1.1800 area (early January peak). A successful settlement above 1.1800 would officially end this month's downtrend.
⚡Immediate Support ($1.1700): This level must be held. A daily close below this level would bring the pair back to the neutral zone around 1.1660.
⚡US Jobless Claims & PCE (Thursday): Tomorrow's employment data and PCE inflation will be the real test for the dollar. If US data is significantly stronger than expected, the euro could suddenly lose its upward momentum.

USD/JPY Still Awaits the Next CatalystTechnically, the pair is testing key correction levels after retreating from its 18-month high.
⚡Fibonacci Level (61.8%): USD/JPY found strong support near this retracement level. Holding above this area is crucial to maintaining the long-term upward structure.
⚡Fibonacci Resistance (50%): The 157.80 area is now a key point. If the price can remain stable above this level, the opportunity to retest the 159.00 level will be wide open.
🧭 Key Levels to Watch 🧭
⚡Key Resistance ($158.55): A breakout of the 100-hour SMA is needed to confirm that the correction phase is over and the price is ready to reach a new record.
⚡Critical Support ($157.20 - $157.33): This level (including the 20-day EMA) must be held. A break below this level would open the door to a deeper decline towards 156.00.
⚡This Week's Focus: The market will be closely watching the US PCE data (Thursday), the Fed's favorite inflation indicator, to determine the direction of the dollar's interest rate.

Silver Pulls Back After Double Top TestSilver futures bounced off resistance at $82.67 on Tuesday. According to our primary scenario, the next key move will be for price to break through this level, which would open the way toward the red Target Zone between $92.25 and $111.28. In that area, we expect the prominent top of the green-labeled wave to form, followed by a larger corrective move. Based on this outlook, traders could consider entering short positions within the $92.25 to $111.28 range, using a stop set 1% above the upper boundary of the zone. Alternatively, it’s possible that the green wave alt. already peaked at $82.67 and price is now correcting directly below support at $69.26. If this scenario plays out—which we assign a 35% probability—a direct pullback into the alternative green long Target Zone between $53.26 and $47.16 would be expected.

XAU/USD | Bearish When $4,425 Confluence Support Is Breached⚡Critical Confluence Level ($4,425)
⚡Key Support: The $4,425 level is currently a key focus as it represents the confluence point between the 100-hour SMA and the 38.2% Fibonacci Retracement of the recent price rally.
⚡Breakout Scenario: If the price closes decisively below this level, it is expected to trigger further technical selling, which could drag Gold down towards the psychological level of $4,400.
⚡Stability: Holding the price above the 38.2% level is crucial to stabilize the faltering market sentiment.

BITCOIN: Slips LowerBitcoin has experienced another bout of selling in recent hours but remains above the $92,000 level. Our primary outlook still calls for a significant move lower as part of green wave C—specifically, into the green Target Zone between $62,250 and $51,212, where we expect the low of the larger orange wave a to form. After that, we anticipate an extended (though corrective) b-wave rally, which could potentially push back toward the $100,000 mark. Only after this move do we foresee the final leg down in the ongoing wave-(ii) correction.

XAU/USD | Consolidation Towards Bullish Structure⚡Consolidation Zone (4436 - 4458): The price is currently "squeezed" in this area. This is a no-trade zone for conservative traders.
⚡Bearish Scenario (Healthy Correction): According to your plan, confirmation of a 1H Close below 4436 is crucial. The 4420 - 4407 area is a strong demand zone. If the price breaks through this level, we may see a liquidity grab towards 4378 - 4360 before the medium-term bullish trend resumes.
⚡Bullish Scenario (Trend Continuation): Stability above 4458 indicates that buyers are still dominant. However, the real confirmation is a 1H Close above 4475, which would pave the way towards the psychological level of 4500 and beyond.

USD/JPY | Medium-Term Uptrend PotentialThe price is currently trading at 156.47, attempting to break through the upper boundary of your zone at 156.71.
However, the recent weak US service sector (ISM) and job openings (JOLTS) data released tonight is putting pressure on the dollar, supporting your bearish scenario.
⚡ Execution Scenario
Bearish Confirmation (Primary Entry): As per your plan, wait for the 4-Hour (4H) candle to close below 155.74. This will confirm that sellers have taken full control.
- TP 1: 154.34
- TP 2: 153.18
⚡Final Target: 152.40 (strong liquidity area).
Correction Scenario (Caution): If the price rebounds and stabilizes above 156.71, this short-term bearish structure will be invalidated, and USD/JPY could retest the 158.00 level.

Gold Prices Fall Due to Profit TakingGold XAUUSD's movement was quite weak during the New York session, likely triggered by weekend profit-taking.
Liquidity was also limited at the end of the week.

Bias Remains Bullish, But Bearish Potential RemainsAlthough Gold recorded a daily correction (into negative territory), the long-term market structure remains constructive. The uptrend remains dominant as long as the price maintains its position above critical support levels.
✅ Key Upward Resistance Levels
If buyers successfully take control after this consolidation phase, the targets are:
- $4,550: All-Time High. This is the nearest psychological and technical hurdle.
- $4,600: A major psychological figure that will become a new long-term target if a record breakout occurs convincingly.
✅ Key Downward Support Levels
If selling pressure continues during this "digestion period," the following levels should be watched:
- $4,430: Initial support (December 23rd low).
- $4,338: Next downside target (December 22nd low).
- $4,300: A psychological round number and the December 17th low.
Conclusion: Technically, Gold is in a healthy correction phase from overbought conditions.
As long as the price doesn't fall below $4,300, the prospect of a rally towards a new record of $4,600 remains wide open, especially if supported by uncertainty regarding the Fed's independence and slow progress in the Ukraine peace process.

GBP/JPY | Potential for Medium-Term CorrectionGBP/JPY experienced selling pressure for the second consecutive day, trading around 210.50. Despite the correction, the price remains near the 17-year high (211.00) reached last Monday. The market is currently caught in a tug-of-war between the yen, supported by the Bank of Japan's policy stance, and the pound, supported by the Bank of England's cautious stance.
✅ Factors Supporting the Japanese Yen (JPY)
- October BoJ Minutes: The newly released document showed broad agreement among officials to continue raising interest rates if economic forecasts are met.
- 30-Year High: Given that the BoJ just raised interest rates to 0.75% in December and is open to further tightening, the JPY has improved yield appeal.
- Geopolitics: Global uncertainty (Venezuela, Ukraine, the Middle East) continues to fuel safe-haven flows into the yen.
✅ Factors Supporting the British Pound (GBP)
- Hawkish Interest Rate Cut: Although the Bank of England (BoE) cut interest rates to 3.75%, the very tight vote (5-4) suggests the committee is in no rush to ease further.
- Expectation Revision: Investors are now scaling back speculation of aggressive interest rate cuts next year, providing a strong foundation for the GBP.
✅ Technical & Strategy Guide
- Consolidated Sentiment: The current decline is still considered a healthy correction. Strong follow-through selling is needed to confirm that the price has truly peaked in the 211.00 area.
- Thin Volume: Light year-end trading could lead to unexpected volatility or subdued (choppy) price movements.

XAU/USD | Prices Move Within a Positive RangeGold is currently trading in positive territory. Based on the four-hour chart (H4), the bullish outlook remains intact as the price remains above key trend indicators.
✅ Bullish Confirmation Signal
- 100-Day EMA: The price is firmly supported above the 100-day EMA ($4,220), indicating that the medium-term uptrend remains very valid.
- RSI (14-Day): Is above the midline (50.0), reflecting strong short-term bullish momentum.
✅ Key Upward Resistance Levels
If the price is able to consistently stay above the upper Bollinger Band ($4,305), the next targets are:
$4,350: Immediate target (high reached on December 15th).
$4,381: All-Time High. A breakout of this level would take Gold to new, untouched price territory.
✅ Key Support Levels
If selling pressure appears (consecutive red candles appear), the levels to monitor are:
$4,271: First support (low on December 16th).
$4,220: 100-Day EMA. This is a crucial resistance level; a close below this level could shift the bias from bullish to neutral or bearish.

XAUUSD | Bullish Bias Still DominantGold (XAU/USD) technical analysis indicates a bullish bias, supported by a key breakout and rising moving averages.
However, the current positive momentum is stretched and showing signs of fading, suggesting potential consolidation or choppy trading.
✅ Dominant Bullish Signal
Key Trigger: Last week's breakout through the $4,245-$4,255 supply zone is seen as a key trigger for bulls.
Intraday Direction: The short-term moving averages are sloping higher, maintaining an intraday bias pointing north.
Market Structure: The broader setup remains supportive as falling prices attract demand around dynamic support.
Upward Confirmation: If buyers reassert control and the MACD histogram expands again, the rally could extend towards a retest of the all-time high (around $4,380).
Bullish Stance Continues: A sustained hold above the rising short-term moving averages will maintain the bullish tone.

XAUUSD | Opportunity To Continue Buying If Correction RecursGold's strong overnight move has confirmed a new bullish breakout above its two-week trading range.
With the daily oscillator in positive territory and far from overbought, the path of least resistance for Gold prices remains to the upside.
✅ Bullish Scenario
Upside Confirmation: A bullish breakout above the $4,245-$4,250 barrier has been confirmed.
Upside Target: The $4,300 round figure now acts as an immediate hurdle. Above it, Gold could:
- ⚡Rise to the next relevant hurdle in the $4,328-$4,330 region.
- ⚡Extend further to challenge the all-time high around the $4,380 zone (October peak).
- ⚡Major Upside Trigger: Continued buying beyond the $4,400 round figure will be seen as a new trigger and set the stage for a larger uptrend extension.
✅ Corrective Downward Scenario (Buying Opportunity)
Buy-the-Dip Opportunity: Any price pullback should be viewed as a buying opportunity.
Initial Key Support: Losses are expected to be limited near the resistance breakout, now support, at $4,245 – $4,250.
Next Support: If $4,250 is breached, losses will be limited near the $4,220 – $4,218 region, followed by the $4,200 mark.
Bias Reversal: A convincing break below the $4,170 – $4,165 support area may shift the bias in favor of bearish traders and pave the way for deeper losses.

GBPUSD | Prices Continue Uptrend✅ Short-Term Price Direction (H4):
After a sharp decline from its peak, the H4 movement indicates a strong short-term uptrend from the recent low around 1.2100 - 1.2200. The price has created a series of clear Higher Highs (HH) and Higher Lows (HL).
The price is currently consolidating below Short-Term Resistance around 1.3100 - 1.3200, which is also the Low Volume Node (LVN) on the Daily Volume Profile. This indicates potential uncertainty after the rapid rise.
This consolidation is occurring within the newly formed High Volume Node (HVN) area on the H4 (around 1.2900 - 1.3000), which serves as strong Short-Term Support.
Short-Term Bias: Bullish (Upward), as the HH and HL structures on the H4 are still intact.
✅ H4 Key Levels:
- Short-Term Resistance (Consolidation Top): Around 1.3100 - 1.3200.
- Short-Term Support (HVN/HL): Range 1.2900 - 1.3000 (Important).
- H4 Value Area Low: Around 1.2700.
✅ Potential Scenarios
- Strong Bullish Scenario: Price successfully breaks through and maintains above the Short-Term Resistance at 1.3200, paving the way for a test of the Daily POC at 1.3400 - 1.3500.
- Correction/Reversal Scenario: A break and close below the Short-Term H4 Support (1.2900) will invalidate the H4 bullish bias and could lead to further declines to test the H4 Value Area Low at 1.2700 and the Daily Key Support.

XAUUSD | Consolidation and Anticipation of Fed Data📈 Gold Market Analysis: Consolidation and Anticipation of Fed Data
The gold market (XAU/USD) experienced a relatively flat and sideways trading session on Monday, consolidating between the key levels of $4103 and $4055. This movement occurred after the precious metal experienced a sharp 2% decline in the previous trading session, reflecting investor caution.
Investors are currently adopting a wait-and-see approach, awaiting the release of important economic data from the United States. This data is crucial because it will provide new clues regarding the Federal Reserve's (Fed) interest rate policy path. Expectations regarding monetary tightening or, conversely, a rate cut will significantly impact US bond yields and the value of the US dollar, which in turn will determine the direction of gold prices.
📌 Technical Outlook and Key Levels
Gold is currently consolidating firmly within a key pivot range.
Bearish Update:
The primary bearish focus lies at the $4055 support level.
A clear breakout and close of the 1-hour candle (1H close) below this support is expected to trigger a further wave of bearish momentum.
The next downside target is the minor support level of $4013, followed by the more significant support at $3979.
Sustaining the price below $4055 will maintain a downside bias.
Bullish Update:
To reverse momentum, gold needs to break through the key resistance level at $4103.
A convincing breakout, confirmed by a 4-hour candle (4H close) closing above $4103, would signal a shift in momentum to the bullish side and a price recovery.
This would pave the way towards the next resistance target located at $4148.

USD/JPY Has a Bearish Trading BiasThe USD/JPY pair is currently stable, with the Japanese Yen (JPY) strengthening slightly against the weaker US Dollar (USD). This JPY strengthening halted the previous day's sharp decline, but the overall movement of USD/JPY is limited by conflicting fundamental factors.
1. Market Fundamental Factors
A. Support for the Japanese Yen (JPY)
BoJ Hawkish: The minutes of the Bank of Japan's (BoJ) September meeting released on Wednesday maintained market expectations for an imminent interest rate hike.
Intervention: Speculation that Japanese authorities might intervene to prevent further JPY weakness also offered support.
B. Limits to JPY Strength and Support for USD/JPY
BoJ Uncertainty: Investors remain uncertain about the exact timing of the BoJ's next interest rate hike. This uncertainty is fueled by expectations that the new Prime Minister, Sanae Takaichi, will pursue an aggressive fiscal spending plan and resist policy tightening.
Global Risk Sentiment: A moderate recovery in global risk sentiment tends to weaken the safe-haven JPY.
Strong USD: The US dollar (USD) held steady near its highest level since late May on the back of the US Federal Reserve's hawkish stance, which helped limit USD/JPY's decline.
2. USD/JPY Technical Analysis
USD/JPY has been struggling below the key resistance level of 154.40-154.45 for over a week. This zone serves as a pivot point that determines the direction of price movement.
A. Bullish Scenario ⬆️
Trigger for a Rise: A sustained breakout and acceptance above 154.40-154.45 will be a signal for bulls.
Next Target: Spot prices will aim to reclaim the psychological 155.00 level.
Continued Target: Continued buying will open the way to the 155.60-155.65 resistance level, before rising further towards the 156.00 level.
B. Bearish Scenario ⬇️
Initial Support: The 153.65 area is expected to offer support, followed by the overnight low around 153.00 - 152.95.
Selling Trigger: Acceptance below 153.00 could trigger technical selling.
Downside Target: The corrective decline will accelerate towards the intermediate support level of 152.55 - 152.50, and extend towards the 152.00 round number and last week's low at 151.55.
USDJPY remains bearish below the pivot zone, with the next directional move to be confirmed by a breakout from the current consolidation range.

Tesla: Guided by the Point of Control🔎Understanding How Stocks React at Key Volume Profile Levels
In this post, let’s study how a stock can react around important Volume Profile levels and how we, as traders, can take advantage of this behavior.
🔘 A Quick Look at Volume Profile
The Volume Profile shows how much trading took place at each price level. Think of it like a sideways histogram that highlights where buyers and sellers were most active. It helps identify price zones that the market accepted (heavy trading) and those it rejected (light trading).
In between a Volume Profile is the Point of Control (POC) - the price level where the highest trading volume occurred. This is often considered as the market’s fair value zone, where buyers and sellers found the most agreement.
The POC tends to act like a magnet for price. When price moves too far away from it, it often returns to test that level since it represents strong trading interest. That’s why traders use POC zones to mark key supports, resistances, and potential entry areas.
In short:
The Volume Profile shows where trading happened. The POC shows where it mattered the most.
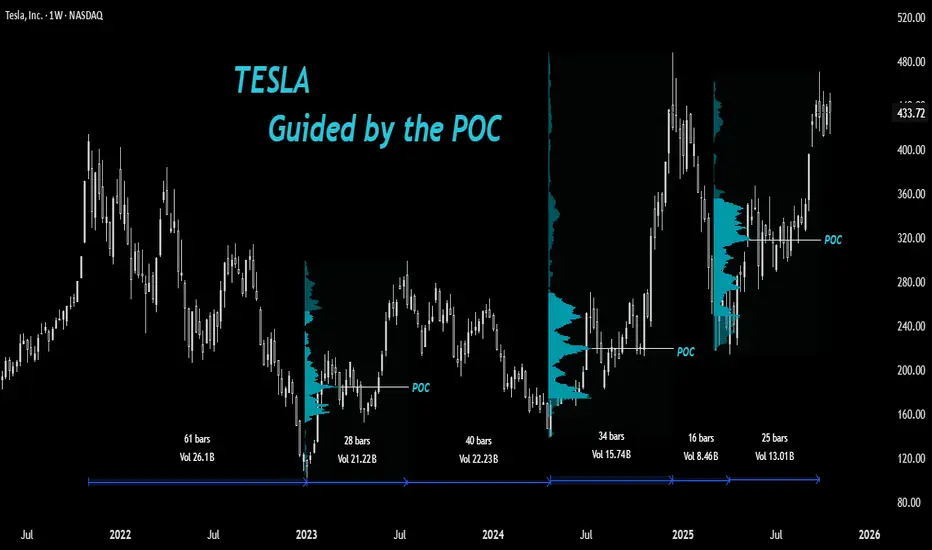
🔘 Overview: TSLA’s Story
After printing a high of $414 in 2021, Tesla (TSLA) has been trying to decisively break that level for almost four years. It made two attempts - first in December 2024, which was quickly faded, and again in September 2025.
🔘 The Fall and Bottom Formation
The stock went through a major bearish phase from $414 down to $101 in 2022 - a massive 75% drop. Then came a sharp V-shaped rally from the bottom - a 194% rise over about 28 weeks, retracing roughly 60% of the entire fall in a short span.
🔘 Why It’s Hard to Catch the Bottom
Catching a stock at the exact bottom is one of the hardest things in trading. No one really knows when the real bottom is forming.
At that point, fear is high, sentiment is negative, and the trend still looks weak. Most traders wait for confirmation - but by then, the bottom is already behind.
Catching the exact low becomes more like a luck than skill. No doubt 'smart traders' focus on catching the early reversal and not the perfect bottom, there are others who wait for pullback opportunities to a fair price.
🔘 April 2024 Bottom Formation
After rallying sharply, TSLA began to pull back from around $300 in July 2023. Traders who had missed the earlier move were waiting patiently with their limit orders for a healthy correction.
But the question was - where should those limit orders be placed?
◽️At the breakout zone around $218?
◽️Near the 50% or 61.8% Fibonacci retracement?
◽️Or below the April 2023 low near $152 for a possible liquidity grab?
The truth is - nobody actually knows the exact level because nothing works all the time.
However, the POC can often help identify a probable fair value zone where accumulation tends to happen.
Although we can’t pinpoint the exact level where a pullback will end, the area 'around' the POC often serves as one of the most reliable zones to accumulate a bullish stock.
And that’s exactly what happened in April 2024. The stock dipped below the previous rally’s POC, grabbed liquidity under $152, and then reversed sharply.
🔘 The Sharp Rally to New Highs
After that, TSLA entered a strong bullish phase, rallying from the April 2024 low to new highs above $414 in December 2024 - a massive 252% rise.
If you observe the Range Tool on the chart, you’ll notice a pattern - bearish phases take longer, while bullish rallies happen faster.
A question here arises: Was this rally sustainable above previous highs?
🔘 The Quick Fall
In January 2025, the stock saw a sharp fall from $488, wiping out 78% of the previous rally.
Interestingly, this decline didn’t stop at a typical breakout retest level - instead, it halted exactly at the POC of the prior bullish rally and began consolidating there.
Since then, the stock has climbed back near its previous highs.
But note this - the January 2025 fall lasted only 16 weeks, while the recovery has taken over 25 weeks without new highs, suggesting a slight loss of upside momentum compared to earlier rallies (early 2023 and late 2024)
🔘 What to Watch Next
If TSLA pulls back again in the future, we can draw a new Volume Profile over the latest bullish leg to locate its POC (I have drawn till the current high of the rally)
That level could once again serve as a potential fair value area and possibly repeat the same price behavior we’ve seen before.
What is your thought on point of control as a tool for investment purpose?
Share your views and hit the boost for more educational posts in future.
📣Disclaimer:
Everything shared here is meant for education and general awareness only. It’s not financial advice, nor a recommendation to buy, sell, or hold any asset. Do your own research, manage your risk, and make sure you understand what you’re getting into.
Your money, your responsibility; and if you’re unsure, ask a qualified financial professional. (Or at least run it by your pet - they’re great listeners 🐶).
Axis Bank Long Good RRAxis Bank if doesn't goes below 1230 can start one move upwards to 1296 to 1320.

Mastering the Elliott Wave Pattern🔵 Mastering the Elliott Wave Pattern: Structure, Psychology, and Trading Tips
Difficulty: 🐳🐳🐳🐋🐋 (Intermediate+)
This article is for traders who want to understand the logic behind Elliott Waves — not just memorize patterns. We’ll cover the structure, trader psychology behind each wave, and practical tips for applying it in modern markets.
🔵 INTRODUCTION
The Elliott Wave Theory is one of the oldest and most respected market models. Developed by Ralph Nelson Elliott in the 1930s, it proposes that price doesn’t move randomly — it follows repeating cycles of optimism and pessimism.
At its core, Elliott Wave helps traders see the bigger picture structure of the market. Instead of focusing on one candle or one setup, you learn to read the “story” across multiple waves.
2021 BTC TOP
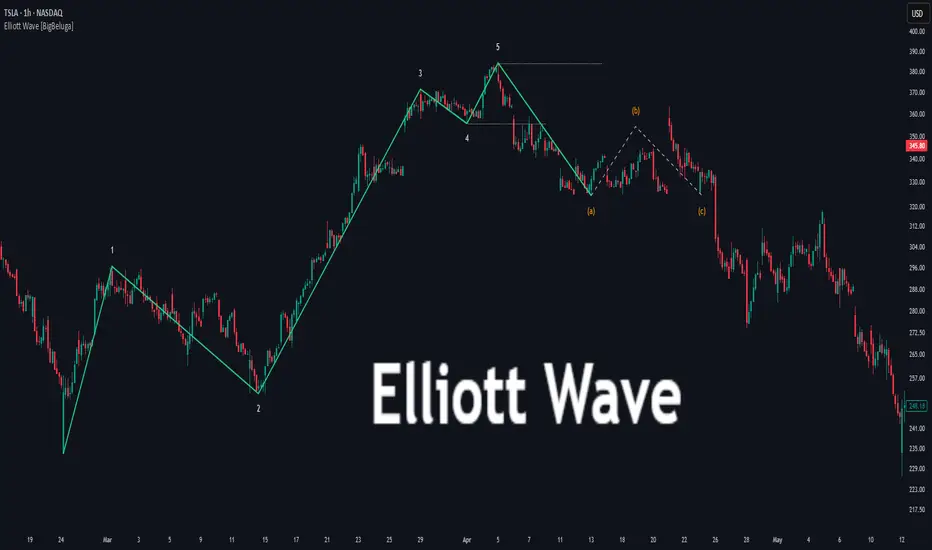
TESLA Stock
🔵 THE BASIC 5-WAVE STRUCTURE
The foundation of Elliott Wave is the Impulse Wave — a 5-wave pattern that moves in the direction of the trend.
Wave 1: The first push, often driven by smart money entering early.
Wave 2: A correction that shakes out weak hands but doesn’t retrace fully.
Wave 3: The strongest and longest wave — fueled by mass participation.
Wave 4: A pause, consolidation, or sideways correction.
Wave 5: The final push — often weaker, driven by late retail traders.
🔵 THE CORRECTIVE 3-WAVE STRUCTURE
After the 5-wave impulse comes a 3-wave correction , labeled A-B-C.
Wave A: First countertrend move — often mistaken as a dip.
Wave B: A false rally — traps late buyers.
Wave C: A stronger decline (or rally in bearish market), often equal to or longer than Wave A.
Together, the impulse (5) and correction (3) form an 8-wave cycle .
🔵 PSYCHOLOGY BEHIND THE WAVES
Each wave reflects trader psychology:
Wave 1: Smart money positions quietly.
Wave 2: Retail doubts the trend — “it’s just a pullback.”
Wave 3: Mass recognition, everyone piles in.
Wave 4: Profit-taking and hesitation.
Wave 5: Final retail FOMO.
A-B-C: Reality check, trend unwinds before cycle resets.
🔵 TRADING WITH ELLIOTT WAVES
1️⃣ Spot the Trend
Identify whether the market is in an impulse (5-wave) or correction (A-B-C).
2️⃣ Use Fibonacci for Validation
Wave 2 usually retraces 50–61.8-78.6% of Wave 1.
Wave 3 often extends 161.8% of Wave 1.
Wave 5 is often equal to Wave 1.
3️⃣ Trade the Highest-Probability Waves
Wave 3 (trend acceleration) and Wave C (correction completion) are often the cleanest opportunities.
4️⃣ Don’t Force It
Not every market move is Elliott Wave. Use it as a framework, not a rulebook.
🔵 COMMON MISTAKES
Over-labeling: Trying to force waves where they don’t exist.
Ignoring timeframes: Waves may look different across scales.
Trading every wave: Not all waves are high-probability setups.
🔵 CONCLUSION
The Elliott Wave Theory isn’t about perfection — it’s about perspective. It helps traders understand market cycles, recognize crowd psychology, and anticipate major turning points.
Use Elliott Wave as a map , not a prediction tool. When combined with confluence — volume, liquidity zones, or trend filters — it becomes a powerful edge.
Do you trade with Elliott Waves? Or do you think they’re too subjective? Share your experience below!
APEUSDT – 1D AnalysisHey traders! 👋
Looking at APEUSDT on the daily chart, we can see that the market has completed a clear 5-wave impulse to the downside. After that strong bearish move, the resistance line was broken, which gave us the first signs of a potential reversal.
From there, we formed a smaller 5-wave impulse upwards, which could very well be wave A of an ABC zig-zag correction. Following that, wave B unfolded in what looks like an irregular correction.
👉 Now, I’m watching closely for wave C to unfold, which should take the form of another 5-wave impulse. According to Elliott Wave guidelines, wave C often equals the length of wave A. However, in this case, wave A was already quite extended, so I wouldn’t be overly optimistic with projections. The minimum correction target has already been reached, but structurally we’re still missing wave C – so I expect it to play out, potentially in the form of a rising wedge.
The good news is that the structure will become clearer as it develops, and we can adjust targets dynamically once price action confirms the pattern. For now, I’m eyeing the green zone as a possible target area for wave C.
📊 Potential Trade Levels:
Entry zone: 0.60 – 0.65 USDT
Stop Loss: 0.51 USDT
Target: 0.99 USDT
⚠️ Important reminder: This is not financial advice – just sharing my Elliott Wave perspective and how I’m viewing the structure right now. The market may develop differently, so please manage your own risk and adjust accordingly. Trade safe, friends! 🙌

Volume Spread Analysis - Understanding Traps & ConfirmationDespite the fact that the so-called “Big Players” in the game of ups and downs we call the market have the power to manipulate it in ways some cannot even imagine, what they ultimately seek is a healthy market. I’ve mentioned in previous posts that the market behaves like a living organism — and like any organism, it must be healthy in order to grow.
In simple terms, the traps institutional players set are there because they need cash flow — liquidity — to achieve that growth. But why do they need to use traps at all? The answer lies in the numbers: one institutional player is equivalent to hundreds, if not thousands, of uninformed or poorly trained retail traders. So, to sustain growth, they are not just inclined but sometimes forced to create traps.
Now imagine this: in a market with enormous capital, one big player is equivalent to 100 retail traders. If 25% of those traders were skilled — truly good at the game — think of how much more cash flow would occur, and how much healthier and more stable that growth could be.
But don’t be fooled — while big players may benefit from a small portion of skilled retail participants, it’s not their actual goal. Still, it wouldn't hurt them either, as long as liquidity and volatility are preserved. In fact, a higher percentage of skilled players could deepen liquidity and reduce the need for extreme manipulation.
However, if too many retail traders become skilled, the game tightens. Profit margins shrink. The edge that institutions hold becomes harder to maintain. And in such a scenario, consistent profitability becomes more difficult — for everyone.
As I’ve emphasized in previous ideas, there is a way to understand institutional traps — and one of the keys is learning how to interpret the Relative Strength Index (RSI) properly. However, since RSI is by nature an oscillator, its signals require confirmation. And what better tool to use for confirmation than Volume — specifically through the lens of Volume Spread Analysis (VSA)?
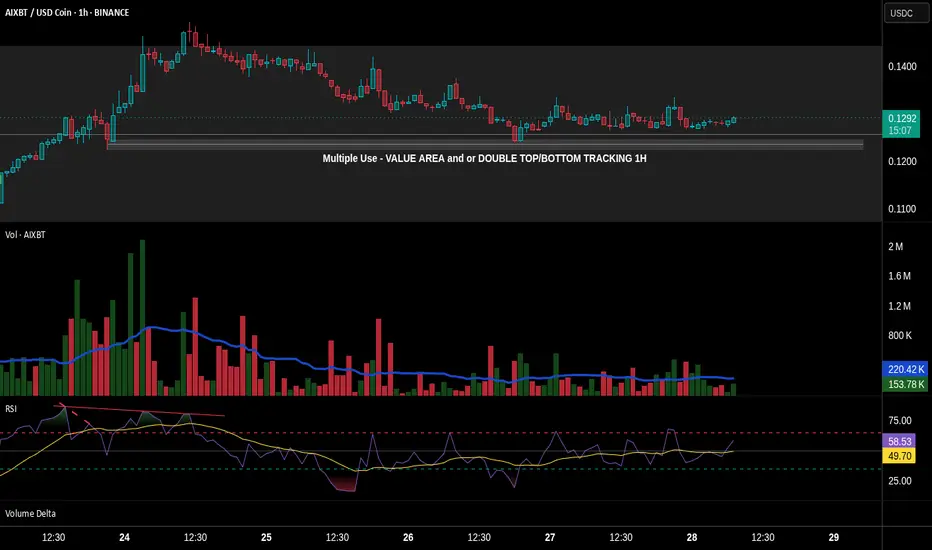
In this post, we’ll partially explore how these traps are revealed, using basic tools available on TradingView. We'll also uncover a potential trap in the chart of AIXBT/USD Coin from Binance, using the 1-hour time-frame.
🔹 1. Pre-Top Volume Cluster
Let’s begin at the very top of the chart. Just before this top, we can spot a bullish volume cluster — four consecutive volume spikes with rising price. In VSA, such a cluster often suggests that the current trend is reaching exhaustion.
⚠️ Important Note: Not all clusters mark a reversal. Even if we see one or two bearish candlesticks after-ward — even if they are engulfing — that alone does not confirm the reversal. The real signs are already present in the volume indicator.
As I’ve said in the past, in previously posted ideas: Big Players always leave footprints. Learning to read those footprints is the language every serious retail trader must eventually understand. And one of the clearest footprints is what we’ll discuss next.
🔻 2. The Buying Climax
A Buying Climax is a tell-tale sign of professional distribution — it appears (in our case) as a large bullish volume spike accompanied by a bearish candlestick, signaling the potential end of a rally.
In our AIXBT/USD Coin chart, we observe two buying climaxes:
• The first comes at the end of the bullish volume cluster, followed by a bearish candle.
• The second follows right after, repeating the same bearish confirmation.
🧠 Even though price was making a new Higher High — these repeated climaxes on increasing volume suggest supply is entering the market, and the uptrend is likely unsustainable.
✅ Conclusion
This is just one piece of the larger puzzle, but even basic tools like RSI and Volume, when read in the context of structure and intent, can reveal traps set by institutional hands. The more we train ourselves to see these signs, the closer we get to trading in harmony with the market’s true rhythm — not against it.
Now let’s take a look at another signal that hints at a possible reversal. But before we continue, keep in mind: what I’m about to describe doesn’t always play out in the simplified way I’ll mention here. The market behaves differently at any given moment — so this kind of analysis always requires a careful and adaptive approach.
This time, I’m referring to a smaller bearish cluster, made up of three volume spikes, each of them clearly above the 20-period Moving Average — and appearing just before the bullish cluster I highlighted earlier.
• The fact that the first spike in this bearish group breaks above the MA is a strong signal that bearish pressure is stepping in.
• The fact that all three spikes remain above the MA adds weight to that signal.
However — and this is crucial — just like I mentioned before, this alone doesn't confirm a reversal. It still requires confirmation.
Even though this smaller bearish cluster forms a new low, and even though it aligns with a bearish RSI divergence marked with a dashed trend line, it’s not a signal to enter a trade. Why? Because volume confirmation is missing. And that's exactly why RSI alone isn't enough. It can point to weakness — but not confirm the turn.
True confirmation only comes with the next bullish volume spike, which:
• a) breaks above the MA,
• b) is higher than the first bearish spike in the previous cluster,
• c) appears with an engulfing candlestick, and
• d) is supported by an RSI plot that follows the move.
This collective behavior — the interaction between price, volume, and momentum — is not random. It’s one of the many harmonies that exist in the market’s structure. And learning to recognize these harmonies is key to understanding when the market is genuine — and when it's trying to trap you.
🔚 Conclusion
All of this leads me to one conclusion — based not just on theory, but on direct experience.
We’ve all seen the countless videos across platforms where retail traders explain things like RSI divergences as if they’re guaranteed signals. But the truth is: not all of these videos are made by successful traders — and blindly following them can be dangerous.
Early in my trading journey, I made that exact mistake. I followed those “educational” videos without question, and nearly blew my account in the process.
Can you imagine what would happen if someone entered a trade solely based on the divergence we discussed — without waiting for confirmation?
If you’ve followed this chart example to its end, you already know the answer.
Worse, this kind of psychological frustration often leads to even bigger mistakes — especially if you haven’t applied one of the simplest protective tools: the Stop Loss. And sadly, many traders skip it.
So let this be a reminder:
A divergence is not a signal. Confirmation is everything.
Let’s now take things a step deeper — by partially revealing something that remains known only to a small circle of elite traders.
Something that’s rarely discussed in public — yet sits hidden in plain sight.
Many traders know that Volume Spread Analysis (VSA) is based on the teachings of Richard Wyckoff and expanded through Tom Williams in Master the Markets. And yes — the most of VSA’s power comes from those principles.
But that’s only part of the story. What did these two big names revealing in secret code using multiple paragraphs and terminologies, but purposely do not reveal it in simple words in a few lines. And they are doing the right thing. Because if I said to myself that if everyone knew that then the market might crashed, then for sure they had that thought as well
What truly sets VSA apart, and what gives it its real power, is that it operates in two distinct languages.
🧩 The Hidden Language of VSA — What Most Don’t See
Let’s now go a step deeper — by partially revealing something known only to a few traders who’ve spent enough time observing the market beyond surface-level signals.
Something that’s often overlooked, yet has always been in plain sight.
We all know that VSA stands for Volume Spread Analysis.
And we commonly refer to “spread” as the distance between the open and the close of a candlestick. This is what many traders fixate on — the relationship between price movement and volume.
But that’s only part of the story.
What did names like Wyckoff and Tom Williams really reveal?
They spoke in code — long paragraphs, obscure terminology, layered ideas — never quite saying "this is the hidden key" in a few plain words.
And they were right to do so.
Because I’ve thought the same thing myself:
If everyone knew this… if it was simplified and passed around like a hack… the market could collapse into chaos.
If I’ve had that thought, I’m certain they did too.
So instead, they left trails. Patterns. Puzzles.
They left the second language in the open — but made sure only those with patience, discipline, and time in the charts would ever truly hear it.
There are things the open and close can’t tell you, but...
That… is part of what I meant earlier when I said VSA speaks in two languages.
Some of you already sense what I’m pointing toward.
For the rest — keep watching.
You’ll know it when you see it.
And once you do, you’ll never unsee it again.
Let’s begin with what most traders already know.
We say "spread" in VSA to refer to the range between the open and the close of a candlestick. This spread, in relation to volume, tells us whether a candle shows strength or weakness.
• A wide spread on high volume may signal professional activity.
• A narrow spread on high volume could suggest absorption or hidden effort.
This is the first language — the most commonly taught, and the most widely shared.
But what about the second?
Here's where things get interesting.
Let’s revisit our AIXBT/USD Coin chart, and specifically the large engulfing candlestick that forms around 18:30, just after the very top.
Now ask yourself:
• 🔍 Where did this candle open?
• 📍 What previous zone did it revisit or retest? What’s the story behind on that retest?
• Have you noticed the macro scale Hidden bearish divergence between RSI & PA?
What you're seeing is not just a rejection.
It’s a trigger zone — a price level left behind earlier by institutional activity.
This candle, with its precise open, combined with the volume behavior, is no coincidence. It's not just a rejection — it's a setup, part of a pre-engineered trap. By stealing what Tom Williams said: Big players are simply saying to uninformed traders – “thank you for your money”.
The interaction of price levels over time, the zones formed by previous activity, and how volume behavior aligns with those zones to signal intent.
Most traders never see this and even fewer can interpret it.
Why This Matters
That engulfing candlestick is not just a visual cue — it's a multiple level footprint.
It confirms everything we discussed earlier about how the market is manipulated — often in ways most traders can’t even begin to imagine. Two opposite forces within a zone. One prevails while the other reveals a future!
So now, let this sink in:
To truly master VSA, one must learn to read both languages.
The visible structure, and the hidden context.
One without the other is incomplete.
Now you know why Confirmation is so crucial.
That’s all for now. I hope that all the above paragraphs were able to give you a hint of how things work! And remember: Everything I write is just a small glimpse of the whole that needs to be considered.
Until next time — stay safe, trade wisely, and never stop learning.