Possible long swing on GBPJPYAfter the huge bullish surge in price which formed the up trend, price has the possibility of retracing to the indicated buy zone and the reversing back up to create a higher price.
This a swing trade that is expected to take many hours. Patience is the key to see how this plays out.
Target is 3.39rr
Wave Analysis

Cummins buy Guys cummins buy and 2 weeks target 4400. Looks like indian budget will help to back to 4400

Coinranger|EURUSD. Uncertainty at 1.17375. Continued🔹Yesterday, the DXY failed to achieve a reversal, and today there's nothing left to do one.
🔹Davos continues.
🔹All the interesting news on the euro has already been released at the time of this post issue.
The levels are the same:
Below:
Will be recalculated on Monday.
1.16827 - the first wave down on m15
1.16470 and 1.16200 - a potential first wave down on h1
Above:
1.17658 - 1.17788 - the first potential wave in a new uptrend. This is a full set on m15
1.17917 - additional level above on m15 (not marked on the chart)
So far, the story looks more like growth, but there's simply nothing to support a serious one. Therefore, we're moving within the old markings.
------------------
Share your opinion in the comments

Coinranger|GBPUSD. Uncertainty around 1.34730. Continued🔹Yesterday, the DXY failed to achieve a reversal, and today there's nothing left to do one.
🔹Today at 12:30 UTC+3, preliminary UK manufacturing and services PMI. Davos continues.
Levels:
Below:
These are still holding, will reassess them by Monday.
1.34113 or 1.33930 - first potential wave down
1.33637 - a full set down
1.33106 - first downside extension
Above:
1.35269 - this is the first extension of the wave set from above. We're almost certainly taking it.
1.35671 - this is the second extension for the set from above. This one is potential, but I leave it here.
-------------------
Share your thoughts in the comments!

AUDCAD Will Go Lower From Resistance! Short!
Please, check our technical outlook for AUDCAD.
Time Frame: 1h
Current Trend: Bullish
Sentiment: Oversold (based on 7-period RSI)
Forecast: Bullish
The market is on a crucial zone of demand 0.943.
The oversold market condition in a combination with key structure gives us a relatively strong bullish signal with goal 0.939 level.
P.S
Overbought describes a period of time where there has been a significant and consistent upward move in price over a period of time without much pullback.
Like and subscribe and comment my ideas if you enjoy them!

USDJPY 30-Min — Volume Buy & Sell Reversal Triggered⚡Base : Hanzo Trading Alpha Algorithm
The algorithm calculates volatility displacement vs liquidity recovery, identifying where probability meets imbalance.
It trades only where precision, volume, and manipulation intersect —only logic.
✈️ Technical Reasons
/ Direction — LONG / Reversal 158.320 Area
☄️Bullish momentum confirmed through strong candle body.
☄️Structure shifted with higher-low near key demand base.
☄️Volume expanding confirms order-flow alignment upward.
☄️Buyers reclaimed imbalance with sustained clean break.
☄️Algorithm detects rising momentum under low liquidity.
✈️ Technical Reasons
/ Direction — SHORT / Reversal 159.020 Area
☄️Bearish rejection confirmed through sharp candle body.
☄️Lower-high forming beneath resistance supply region.
☄️Volume decreasing confirms exhaustion in price rally.
☄️Sellers regained imbalance with heavy top rejection.
☄️Algorithm detects fading demand and shift to control.
⚙️ Hanzo Alpha Trading Protocol
The Alpha Candle defines the day’s real control zone — the first battle of momentum.
From this origin, the Volume Window reveals where the next precision strike begins.
⚙️ Hanzo Volume Window / Map
Window tracked from 10:30 — mapping true market behavior.
POC alignment exposes institutional bias and breakout potential zones.
⚙️ Hanzo Delta Window / Pulse
Delta window monitors real buying vs. selling power behind each move.
Tracks volume aggression to expose who controls the candle — buyers or sellers.
When Delta aligns with Volume Map, momentum becomes undeniable.

GBP/CAD BEARS ARE GAINING STRENGTH|SHORT
Hello, Friends!
Previous week’s green candle means that for us the GBP/CAD pair is in the uptrend. And the current movement leg was also up but the resistance line will be hit soon and upper BB band proximity will signal an overbought condition so we will go for a counter-trend short trade with the target being at 1.851.
Disclosure: I am part of Trade Nation's Influencer program and receive a monthly fee for using their TradingView charts in my analysis.
✅LIKE AND COMMENT MY IDEAS✅


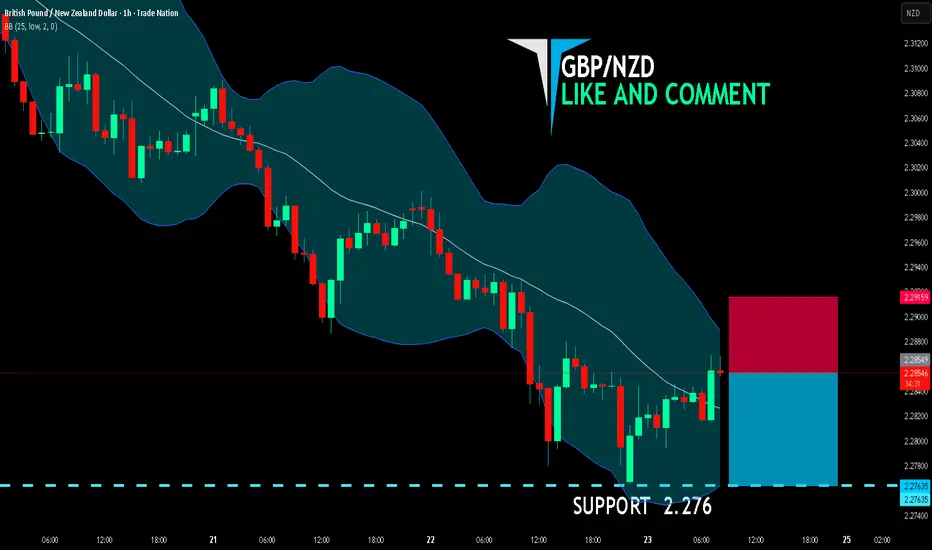
GBP/NZD SELLERS WILL DOMINATE THE MARKET|SHORT
GBP/NZD SIGNAL
Trade Direction: short
Entry Level: 2.285
Target Level: 2.276
Stop Loss: 2.291
RISK PROFILE
Risk level: medium
Suggested risk: 1%
Timeframe: 1h
Disclosure: I am part of Trade Nation's Influencer program and receive a monthly fee for using their TradingView charts in my analysis.
✅LIKE AND COMMENT MY IDEAS✅
XAUUSD | 30M – Bullish Continuation After Demand RetestOANDA:XAUUSD
Gold remains structurally bullish after a strong upside expansion. The recent pullback into demand was met with immediate buying interest, suggesting institutional participation. As long as price holds above the marked demand zone, continuation toward higher resistance levels remains the higher-probability scenario.
Key Scenarios
✅ Bullish Continuation 🚀
Hold above 4,820 – 4,830
Upside targets:
🎯 Target 1: 4,945
🎯 Target 2: 5,020 – 5,050
❌ Bullish Invalidation ⚠️
Clean break and close below 4,800
Would shift structure into deeper correction
Current Levels to Watch
Support 🟢: 4,800 – 4,830 (Demand Zone)
Resistance 🔴: 4,945 → 5,020+
Trend Bias: Bullish while above demand
⚠️ Disclaimer: This analysis is for educational purposes only. It is not financial advice.

Coinranger|SOLUSDT. Potential reversal to 135🔥News
🔹The International Economic Forum continues. US GDP is at 16:30 (UTC+3). US PCE data for November and October will be released at 18:00 (UTC+3) – this is still important due to possible recalculations for later months.
🔥SOL
🔹Time to update the Solana chart:
1️⃣A potential set of upward wave markers has appeared above: 133, 135, 138.
2️⃣Below, 124 and 122 remain significant levels. They could still play out during a potential flat phase.
For now, the priority is a continued upward pullback. There is also a possibility of a flat at 131 - 124, but not yet.
-------------------
Share your opinion in the comments


GOLD - Pullback before growth after Asian momentum FX:XAUUSD is correcting after hitting a historic high ($4,900), due to the de-escalation of tensions between the US and the EU. Profit-taking is observed, but the trend remains bullish...
Fundamental background:
- Trump has cooled down: tariffs are temporarily suspended, as is the forceful seizure of Greenland. Negotiations are likely to continue. The market reacted quite aggressively to yesterday's “swings” led by Trump.
Today, data on PCE inflation and US GDP for the third quarter will be released, which may provide new momentum.
Further dynamics will depend on inflation data: weak indicators may renew interest in defensive assets, while strong ones may increase pressure.
Resistance levels: 4838, 4850, 4880
Support levels: 4813, 4800, 4777
Technically, after the Asian momentum, gold may form a correction of 50% of the total movement. I consider the 4813-4800 area (liquidity area) to be a zone of interest. And as zones of interest at the top, I consider the 4850 area — the liquidity pool.
Best regards, R. Linda!

Liquidity Above 5,000 Tested — Gold Sets Up Smart Money RotationOANDA:XAUUSD | Daily Smart Money Plan – H1
Gold continues to trade in a mature bullish structure after a strong multi-day expansion, with price now pressing into psychological and technical premium territory above 5,000.
Today’s volatility is being amplified by a hot macro driver: renewed speculation around the future Fed leadership and its potential impact on rate expectations, keeping both USD sensitivity and safe-haven flows in focus.
However, from a Smart Money perspective, H1 price action shows clear signs of deceleration, not acceleration. Instead of clean continuation, Gold is reacting near external liquidity highs — a typical environment for distribution, rebalancing, and engineered pullbacks, rather than emotional breakout chasing.
Market Structure & Liquidity Context
Higher-timeframe trend remains bullish, supported by a rising structure and prior BOS.
Recent CHoCH confirms a shift from impulsive expansion into controlled rotation.
Price has tapped external buy-side liquidity near the highs, signaling potential short-term exhaustion.
FVG and Fibonacci discount levels below price define the most probable draw on liquidity.
Market behavior suggests premium delivery → discount mitigation, not straight-line continuation.
➡ Headlines may create volatility, but liquidity dictates direction.
Key Trading Scenarios
🔴 Sell Reaction at Premium (Primary Scenario)
5010 – 5012 | SL: 5020
Confluence:
External buy-side liquidity
Psychological round number
Overextended premium pricing
Weak acceptance or rejection here favors a corrective rotation toward value.
🟢 Buy Reaction at Discount (Scenario A)
Fibo 0.236 | 4917 – 4915 | SL: 4910
Shallow retracement within bullish structure
Ideal zone for continuation if momentum resets cleanly.
🟢 Buy Reaction at Deep Discount (Scenario B)
Fibo 0.786 | 4800 – 4798 | SL: 4790
Deeper liquidity sweep
Strong Smart Money re-entry zone if premium fully unwinds.
Invalidation
Sustained H1 acceptance and hold above 5020 invalidates the corrective bias and opens continuation toward higher expansion targets.
Expectation & Bias
This is not a breakout-chasing environment.
Liquidity comes before direction
Acceptance confirms continuation
Rejection favors rotation
Execution > prediction
💬 Will Gold accept value above 5,000 after the Fed narrative — or rotate back to discount first?

XAUUSD – H2 Technical Outlook| LanaXAUUSD – H2 Technical Outlook: Trendline Continuation After a Healthy Pullback | Lana✨
Gold remains in a strong bullish structure on the H2 timeframe. The recent push higher looks like an impulsive expansion, and the current retracement is best read as a controlled pullback to rebuild liquidity, not a bearish reversal.
As long as price respects the rising structure, Lana’s bias stays bullish (buy the dip).
📈 Market Structure & Trend Context
The broader trend is still bullish, with momentum staying inside an ascending channel.
Price has already shown a clear “run” into buyside liquidity during the mid-range consolidation, followed by a continuation leg.
The current pullback is occurring from the highs and is pulling back into structure — a classic setup for re-accumulation before continuation.
🔍 Key Technical Zones (from the chart)
Primary pullback support: the ~4800 structural line
This is the cleanest “line in the sand” for the bullish thesis on the chart.
Re-entry / reaction zone: the purple demand block near the recent highs (retest zone)
This is where price may rebalance before attempting the next breakout.
Higher-timeframe support levels below:
4580.180
4508.503
4409.421
4333.528
These are deeper supports if the market ever shifts into a larger correction.
🎯 Trading Plan (H2 Structure-Based)
✅ Primary Scenario: Buy the Retest Zone (higher probability continuation)
Buy Entry: 4882 – 4888 (retest into the purple demand zone)
SL: 4872 – 4878 (8–10 points below entry)
TP Targets (scaled exits):
TP1: 4955 (current swing area / first rebound objective)
TP2: 5000 (psychological milestone + channel pressure point)
TP3: 5035 – 5050 (continuation extension inside the channel)
TP4: 5075 – 5100 (upper channel projection / breakout follow-through)
✅ Alternative Scenario: Deeper Pullback Into Structure (value buy)
If price loses the retest zone and continues lower:
Buy Entry: 4802 – 4810 (structural support line)
SL: 4792 – 4800 (8–10 points below entry)
TP Targets:
TP1: 4880 – 4890
TP2: 4955
TP3: 5000
TP4: 5035 – 5050
🌍 Macro Context (Brief)
Headlines around Trump mentioning a potential China visit in April and China’s response emphasizing stable relations can shift risk sentiment short-term.
If markets interpret it as easing tensions, gold may see profit-taking pullbacks. If uncertainty remains, gold can stay supported as a hedge. Either way, expect headline-driven volatility, which makes structured pullback entries more favorable than chasing highs.
✨ Lana’s Approach
Lana is not chasing the top. The focus is on buying pullbacks into structure, letting price confirm, and scaling out into targets as the trend continues.

Gold at $5k? RSI divergence vs. breakout – which comes first?Gold is just $30 away from the historic $5,000 level, and silver is approaching $100 for the first time ever. But before you chase the breakout, we need to talk about the RSI divergence flashing on multiple timeframes and what it means for the next move.
In this video, we analyse the technical setup as gold approaches the most critical resistance level of this bull run. We explain why the "no safe haven" thesis—with the dollar collapsing on Greenland tensions and the yen crashing past 158 after the BOJ decision—is flooding capital into precious metals. But we also map out the warning signs that suggest $5K could trigger heavy profit-taking.
Key topics :
Measured move complete : The corrective leg projects to 4,930, which we just hit. Similarly, the Elliott Wave net distance (Waves 1-4) also targets the same level—two confluences at resistance.
Accelerated channel : Gold is trading in a parabolic, accelerated channel. As long as we hold 4,680 (61.8% Fib on daily) and 4,770 (61.8% Fib on 4H), the bias remains bullish.
RSI divergence : Weekly, daily, and 4-hour charts all show bearish divergence. Price is making new highs, but momentum is not confirming—classic topping behaviour.
The $5K test : Next upside targets are 5,012, 5,100, and 5,200. But $5K might be where sell orders are stacked. A failure here could trigger a sharp correction to 4,770-4,800.
Risky counter-trend Play : For the brave, a short at $5K with a stop at $5,050 and a target at $4,770 (61.8% support). But remember: "The trend is your friend."
Are you buying the dip or fading the $5K level? Let us know in the comments!
This content is not directed to residents of the EU or UK. Any opinions, news, research, analyses, prices or other information contained on this website is provided as general market commentary and does not constitute investment advice. ThinkMarkets will not accept liability for any loss or damage including, without limitation, to any loss of profit which may arise directly or indirectly from use of or reliance on such information.

DASHUSDT | Don't FOMO buy now...Here is where you enterHello traders,
DASH has went ape mode the last couple of days reaching 70% in a single day peeking at $96.85. Buying here would not be very smart. Price is already overextended.
I can see that price has already formed a complete 5 impulsive waves and now is about to do an ABC correction.
My zone of interest to re-buy again would be between $53-$63
DASH goal's in this cycles will surpass $300 with ease.
Good Luck!

Eli Lilly Target $1,258-1,316 in final waveStock price is in a bullish impulse
Last wave 5 is in progress
Target is calculated as 50-61.8% of waves 1-3 move added to the valley of wave 4
It is highlighted with the blue box in $1,258-1,316 area
It perfectly aligns with the trend channel resistance
Invalidation is below the bottom of wave 4 < $1,013
It is expected to see the Bearish Divergence in wave 5

INTC: Wave 5 Truncated at 54.32– Correction Wave Targets 38-42Published: Jan 23, 2026 | Bearish Reversal Confirmed
INTC's rally peaked at 54.32 (Jan 22 high) after Q4 earnings beat, but conservative Q1 guidance triggered profit-taking and a -12% post-market plunge. The break below 44.02 invalidates the prior Wave 5 impulse count, confirming truncation and shifting to a corrective phase (ABC or expanded flat).
Primary Count (Bearish Correction):
Wave 5 truncated at 54.32; structure fails.
Current: Wave (A) or Wave 4 deep correction underway.
Targets: 38-42 (50-61.8% retracement, 1-3 months); extension risk to 35-36 if momentum weakens.
Support: 44 (short-term), 40 (secondary), 38 (major).
Alternative Count (Red Line – Deeper Risk):
If 44.02 break holds: Consolidates into larger Wave 3 completion at 54.32.
Wave 4 target: 35-38 (61.8% retrace).
Subsequent Wave 5 target: 58-65 (Q3-Q4 2026).
Trade Plan:
Bearish bias. Avoid longs until 38-42 oversold bounce.
Disclaimer: This analysis is for educational purposes only and is not investment advice. Please do your own research (DYOR) before making any trading decisions.

Positional TradingIntroduction to Positional Trading
Positional trading is a trading style where positions are held for an extended period—ranging from a few weeks to several months—to benefit from medium- to long-term price movements. Unlike intraday trading, which focuses on short-term price fluctuations within a single trading session, positional trading is designed for traders who want to participate in larger market trends without the need to monitor markets constantly. This approach is especially popular among working professionals and investors who prefer a balance between active trading and long-term investing.
At its core, positional trading combines elements of both technical and fundamental analysis. Traders aim to identify strong trends, enter at favorable price levels, and hold their positions patiently until the trend shows signs of exhaustion or reversal.
Key Characteristics of Positional Trading
One of the defining features of positional trading is the holding period. Positions are not closed quickly; instead, traders allow enough time for the underlying trend to fully develop. This reduces the impact of daily market noise and minor price fluctuations.
Another important characteristic is relatively lower trading frequency. Since trades are fewer, transaction costs such as brokerage fees and taxes are generally lower compared to intraday or high-frequency trading. This makes positional trading more cost-efficient over time.
Risk management is also central to positional trading. Because positions are held overnight and across market events, traders must account for gap-ups and gap-downs. Wider stop-loss levels are typically used, but position sizing is adjusted to keep overall risk under control.
Positional Trading vs Other Trading Styles
Positional trading sits between swing trading and long-term investing. Swing traders usually hold positions for a few days to a couple of weeks, focusing on short-term momentum. Long-term investors, on the other hand, may hold assets for years based primarily on fundamentals.
Positional traders bridge this gap by using technical setups to enter trades while aligning with broader fundamental or macroeconomic trends. This hybrid nature allows traders to capture meaningful price moves without committing capital for very long durations.
Role of Technical Analysis in Positional Trading
Technical analysis plays a crucial role in positional trading. Traders use higher time-frame charts such as daily, weekly, and sometimes monthly charts to identify trends and key levels. Commonly used tools include moving averages, trendlines, support and resistance levels, and chart patterns like triangles, flags, and head-and-shoulders formations.
Indicators such as Relative Strength Index (RSI), Moving Average Convergence Divergence (MACD), and Average Directional Index (ADX) help traders assess momentum and trend strength. In positional trading, indicators are used more for confirmation than for frequent entry and exit signals.
Importance of Fundamental Analysis
While technicals help with timing, fundamental analysis provides conviction. Positional traders often analyze company earnings, growth prospects, sector performance, and macroeconomic factors such as interest rates, inflation, and government policies.
For example, a trader may take a positional long trade in a stock showing strong technical breakout while also benefiting from improving earnings visibility or sector-wide tailwinds. This alignment between fundamentals and technicals increases the probability of trade success.
Risk Management and Position Sizing
Risk management is one of the most critical aspects of positional trading. Since stop-losses are generally wider, traders must reduce position size to maintain a fixed percentage risk per trade. A common approach is to risk only 1–2% of total trading capital on a single position.
Trailing stop-losses are frequently used to lock in profits as the trend progresses. This allows traders to stay in winning trades longer while protecting accumulated gains. Discipline in following stop-loss rules is essential, as emotional decisions can quickly erode profits.
Psychological Aspects of Positional Trading
Positional trading requires patience and emotional stability. Traders must be comfortable with short-term drawdowns and periods when the market moves sideways. The ability to stick to a trading plan without reacting impulsively to daily price fluctuations is a key success factor.
Because trades last longer, positional traders are also exposed to news events and market sentiment shifts. Managing fear during temporary corrections and avoiding greed when prices move favorably are constant psychological challenges.
Advantages of Positional Trading
One major advantage of positional trading is time efficiency. Traders do not need to watch the market continuously, making it suitable for those with full-time jobs. The focus on larger trends also offers the potential for higher reward-to-risk ratios compared to short-term trading.
Additionally, positional trading reduces stress caused by rapid decision-making. By relying on higher time frames and well-defined setups, traders can approach the market in a calmer and more structured manner.
Limitations and Risks
Despite its advantages, positional trading is not without risks. Overnight positions expose traders to unexpected news, geopolitical events, and earnings surprises. Market gaps can lead to losses beyond predefined stop-loss levels.
Another limitation is capital lock-in. Since trades remain open for weeks or months, capital cannot be easily redeployed into other opportunities. This requires careful planning and portfolio diversification.
Conclusion
Positional trading is a disciplined and strategic approach aimed at capturing substantial market trends over medium- to long-term horizons. By combining technical analysis for precise entries and exits with fundamental insights for broader context, traders can improve their probability of success. Effective risk management, emotional control, and patience are essential pillars of this trading style.
For traders seeking a balanced method that avoids the intensity of intraday trading while remaining more active than long-term investing, positional trading offers a practical and rewarding path—provided it is executed with consistency, discipline, and a well-defined trading plan.


Gold will spike UPUP FX_IDC:XAUUSD OANDA:XAUUSD BIST:XAUUSD1! FXOPEN:XAUUSD FOREXCOM:XAUUSD
Gold already break !
BUY now

US–China Trade War: Economic, Market, and Geopolitical ImpactsOrigins and Core Issues of the Trade War
The US–China trade war was primarily driven by concerns in the United States regarding persistent trade deficits, alleged unfair trade practices, intellectual property theft, forced technology transfers, and state subsidies to Chinese firms. China, on the other hand, viewed US actions as attempts to contain its economic rise and technological ambitions. As tariffs escalated on hundreds of billions of dollars’ worth of goods, trade relations deteriorated, and trust between the two largest economies weakened.
Unlike traditional trade disputes focused purely on tariffs, this conflict also targeted strategic sectors such as semiconductors, telecommunications, artificial intelligence, and clean energy. This broadened scope transformed the trade war into a long-term structural rivalry rather than a temporary negotiation phase.
Impact on Global Trade and Supply Chains
One of the most profound effects of the US–China trade war has been the restructuring of global supply chains. Companies heavily dependent on China for manufacturing began diversifying production to other regions such as Vietnam, India, Mexico, and Southeast Asia to reduce tariff exposure and geopolitical risk. This phenomenon, often described as “China+1” or “friend-shoring,” increased costs in the short term but improved resilience over time.
Global trade volumes experienced volatility as tariffs disrupted established trade flows. Intermediate goods became more expensive, affecting manufacturers worldwide. While some countries benefited by attracting new investments, the fragmentation of supply chains reduced overall efficiency and increased inflationary pressures across multiple economies.
Effects on Economic Growth and Inflation
Both the US and China faced economic consequences from the trade war. Higher tariffs raised input costs for businesses and consumer prices for households. In the United States, tariffs functioned as an indirect tax on consumers, contributing to inflationary pressures. In China, export-oriented industries faced reduced demand, affecting manufacturing output and employment in certain sectors.
Globally, the trade war weighed on economic growth by dampening business confidence and investment. Uncertainty over future trade rules caused firms to delay capital expenditure. International organizations repeatedly revised global growth forecasts downward during periods of heightened trade tensions, highlighting the broader macroeconomic impact.
Financial Market and Currency Impacts
Financial markets reacted sharply to trade war developments, with equity markets experiencing increased volatility around tariff announcements and negotiations. Sectors exposed to global trade—such as technology, automobiles, and industrials—were particularly sensitive. Investors frequently shifted toward defensive assets like government bonds and gold during escalation phases.
Currency markets were also affected. The Chinese yuan experienced periods of depreciation, partly offsetting the impact of US tariffs on Chinese exports. This led to accusations of currency manipulation and added another layer of tension to the conflict. Emerging market currencies, especially those linked to global trade, experienced spillover effects due to shifting capital flows and risk sentiment.
Technology Decoupling and Strategic Competition
Perhaps the most lasting impact of the US–China trade war is the acceleration of technological decoupling. Restrictions on technology exports, semiconductor equipment, and advanced computing capabilities limited China’s access to critical inputs. In response, China intensified efforts to achieve technological self-sufficiency through domestic innovation and state support.
This decoupling has global implications. Multinational technology firms face fragmented markets with different standards, regulations, and ecosystems. Innovation costs increase as companies duplicate supply chains and research efforts. Over time, the world risks splitting into competing technological blocs, reducing collaboration and slowing global innovation.
Impact on Emerging Markets and Developing Economies
Emerging markets experienced mixed outcomes from the trade war. Some countries benefited from trade diversion and increased foreign direct investment as firms sought alternatives to China. India, Vietnam, Indonesia, and Mexico emerged as notable beneficiaries in manufacturing and exports.
However, many developing economies suffered from reduced global trade growth and heightened financial volatility. Countries dependent on commodity exports to China or the US faced demand fluctuations. Additionally, rising protectionism globally encouraged other nations to adopt similar measures, weakening the multilateral trading system that many developing countries rely on.
Geopolitical and Institutional Implications
The US–China trade war weakened confidence in the global trade architecture, particularly the World Trade Organization (WTO). Unilateral tariffs and retaliatory actions undermined dispute-resolution mechanisms and encouraged bilateral or regional trade arrangements instead of multilateral cooperation.
Geopolitically, trade policy became a tool of strategic influence. Allies and partners were often pressured to align with one side, complicating international relations. Economic security, national resilience, and supply-chain sovereignty became central themes in policymaking, blurring the line between economics and geopolitics.
Long-Term Structural Changes
In the long run, the US–China trade war is reshaping globalization itself. Rather than complete deglobalization, the world is moving toward a more fragmented and regionalized form of globalization. Efficiency is increasingly balanced against resilience and national security considerations.
Corporations now incorporate geopolitical risk into strategic planning alongside traditional financial metrics. Governments are more willing to intervene in markets to protect strategic industries. These shifts suggest that the trade war’s legacy will persist even if tariffs are reduced or agreements are reached.
Conclusion
The US–China trade war is not merely a dispute over tariffs but a defining feature of a broader economic and strategic rivalry. Its impacts span global trade, supply chains, inflation, financial markets, technology development, and geopolitics. While some economies and sectors have found opportunities amid the disruption, the overall cost has been higher uncertainty, reduced efficiency, and slower global growth. As the world adapts to this new reality, the challenge lies in managing competition without undermining global economic stability and cooperation.
