SOLUSDT - 30M ANALYSISHey traders!
Based on the recent price action, SOL has finished a clean 5-wave impulse down, which usually signals the start of a correction. Right now the structure looks very much like a developing Zig-Zag:
- Wave A has played out,
- Wave B is close to completing,
- and I’m watching for a break of the B-wave resistance to confirm the start of Wave C to the
upside. If that happens, the next target zone sits around 146–150.
However, it’s important to keep the alternative in mind:
Wave B can still form as an expanded flat, meaning price could dip lower and even take out the Wave 5 low before reversing. If that happens, the bullish ABC idea is still possible — it just becomes a deeper setup.
So for now:
Keep an eye on how price behaves around the B resistance level, stay patient for confirmation, and don’t forget your risk management.
This is not financial advice — always DYOR.
Waveanalysiss

GBPJPY – Targeting the Green WCL After BC RetracementPrice completed a clean green impulse and started a corrective red sequence.
The plan: wait for a retracement into the red BC zone, which overlaps a bearish order block. If price reacts from that region, I’ll ride the next leg down toward the red C target and the green wave’s Whole Correction Level (WCL).
However, note the developing bullish flag pattern — if price breaks above red B, that flag activates and the bearish setup becomes invalid. A breakout there could extend the larger bullish trend.
Strengths:
– BC retracement aligns with a strong order block.
– WCL and C-target overlap, creating a high-probability draw on liquidity.
– Clear invalidation above red B protects the setup.
Weaknesses:
– GBPJPY volatility could trigger premature sweeps.
– A confirmed flag breakout would fully invalidate this setup.
Narrative:
Trading the correction inside a possible flag — shorting structure, not emotion. If the flag fires, I’ll flip bias with it.

USD/CHF – Building the LaunchpadAfter a clean impulse higher, USD/CHF is dipping right into the zone where demand was born — the BC + WCL overlap , sitting on top of the daily imbalance .
This area (around 0.7975 ) feels like the kind of zone where price takes a breath before the next leg.
As long as 0.7923 holds, I’m hunting for longs toward 0.8270–0.8300 .
That’s the HTF target and the last unmitigated supply area above.
If the zone cracks, I’ll let it go — no need to fight the flow.
Solid structure, clean logic, fair R:R. Let’s see if the launchpad fires.
Disclaimer: This post is for educational purposes only and does not constitute financial advice.

EUR/USD – The Rhythm ResetsPrice formed a clean A–B–C correction and tapped into the BC zone around 1.1570–1.1550 .
I’m watching this area for a possible reload — structure still bullish while 1.1539 holds.
Targeting the C extension near 1.1640 if momentum confirms.
If it breaks, I’ll wait for the next rhythm — no chase.
Disclaimer: This post is for educational purposes only and does not constitute financial advice.

AUD/USD – Looking for buys off the 4H BC zoneAfter completing a clean bearish correction, price shifted bullish on the 4H.
I’m waiting for a retrace into the BC + Order Block zone (0.6490) to go long.
Targeting 0.6560 , stop below 0.6463 .
If 0.6460 breaks cleanly, setup’s invalid.
R:R ≈ 1:2.6 — let’s see if demand holds 👀
Disclaimer: This post is for educational purposes only and does not constitute financial advice.

META — Possible Macro Peak, Bearish Year AheadMeta may have completed its long-term C wave after reaching new all-time highs at the top of the macro channel.
The structure now shows emerging bearish sequences on lower timeframes , hinting that the next yearly cycle could be corrective or bearish rather than impulsive.
While the theoretical WCL sits far below (around 350–400), such a deep retracement would imply a 50% drop — an extreme but technical possibility.
A more realistic path could be a 20–30% macro correction as the market digests Meta’s extended rally and rebalances valuation.
Key Points:
Macro C wave completed at the upper channel boundary.
Lower timeframe sequences turning bearish.
WCL remains the ultimate downside target, though not the base case.
Expect a potentially bearish or corrective year ahead for Meta, within the long-term bullish structure.
Invalidation:
If price reclaims the 780–800 zone and breaks above the red B high, bearish structure fails.

EUR/GBP – Corrective C Wave in PlayPrice already tapped the black BC, suggesting the first correction leg is done.
Now, the pink wave’s C target aligns perfectly with both the descending trendline and the order block — a strong confluence zone likely to induce liquidity before a deeper retracement of the black wave.
Setup remains valid as long as the black B isn’t broken. A break above B would invalidate the sequence and shift market structure bullish.
Strengths:
Trendline + order block + C target alignment
Internal correction forming cleanly within larger structure
Clear invalidation and strong confluence logic
Weaknesses:
Liquidity sweeps may occur before confirmation
Requires patience for MSS confirmation before entry

AUDUSD – corrective math in motion.Price retraces into the prior order block that broke structure, completing a textbook ABC correction inside a premium zone. Liquidity pools just above IDM hint at a sweep before continuation toward 0.63.
Strengths :
Confluence between wave symmetry, premium retracement, and liquidity structure. Clear invalidation point above IDM keeps risk defined.
Weaknesses :
AUD fundamentals (RBA policy shifts, USD softness) could disrupt structure-based setups. No confirmed momentum shift yet on lower timeframes — patience required.
SmellyTaz — decoding chaos .

ADAUSDT — Dual Wave ConfluenceTwo independent cycles now point to the same liquidity zone.
The wine wave (macro) has entered its BC retracement phase, and its BC target aligns perfectly with the green micro-wave’s C-target , forming a rare dual confluence at the same level. This overlap creates a liquidity magnet — a structural point where both wave systems expect equilibrium before a bullish expansion.
Price is currently reacting inside the BC demand zone , finalizing the correction before expansion toward the macro C projection at 0.7575 .
The alignment between both scales confirms that momentum and liquidity are synchronized for continuation.
Strengths :
Perfect alignment of macro BC and micro C targets
Discount entry within structural demand
Defined invalidation below BC low
High asymmetric RR toward 0.7575
Weaknesses :
Requires bullish displacement confirmation from demand zone
Possible short-term inducement before expansion
Invalidation if structure breaks below BC
Bias : Bullish continuation
Target : 0.7575 (macro C projection zone)

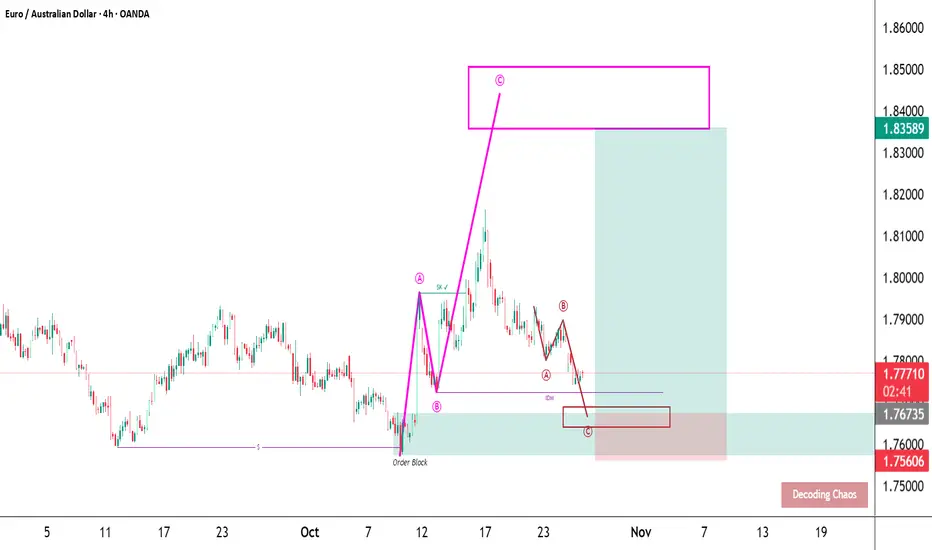
EURAUD – structure breathes in waves.Price retraces toward a clean order block within a discount zone after a strong impulsive leg. Correction is forming a precise ABC pattern, likely to complete near 1.767 before the next wave resumes toward 1.835.
Strengths:
Wave symmetry, confluence with order block, and IDM liquidity structure all align. Setup maintains bullish context from higher timeframe while defining risk clearly below C.
Weaknesses:
Momentum confirmation pending; daily RSI could signal exhaustion if recovery stalls. EUR fundamentals remain sensitive to data shocks that can distort technical structure.
SmellyTaz — decoding chaos.
GBPJPY — Eyeing Reaction from 204.00Price swept buy-side liquidity and shifted structure, leaving a refined 15M order block nested inside a 1H breaker and aligned with the 4H bearish flow.
I’m watching that zone for lower-timeframe confirmation to join the next move down.
If the zone holds, it’s a continuation setup. If it breaks, I step aside — no bias, just structure and probability.
Liquidity feeds the patient.

SHIBUSDT 4H Potential 10% Drop – Wave 4 Incoming? Hey traders,
On the 4H timeframe, SHIBUSDT seems to be completing Wave III of a classic 5-wave impulse structure. We can clearly identify:
- Wave I and II behind us
- Wave III topped out recently with a strong push upward
- Now expecting a Wave IV correction to unfold
What supports this setup:
- Wave II was an irregular correction (note how Wave B pushed above Wave A).
- According to Elliott Wave alternation rules, if Wave II is complex/irregular, Wave IV is likely to be a simple ZigZag (ABC) correction.
- Zigzags are typically sharp and quick, which fits the momentum of the current market structure.
🕵️♂️ What’s next?
- The potential correction target lies in the marked rectangle zone (around -10% to -13% drop
from the recent top).
- On lower timeframes (like 7min or 10min), we’ll be watching for a support break to confirm
the start of Wave IV.
- If the support is broken with confirmation, that may offer an opportunity to enter a short
position — as long as it fits within the personal risk parameters.
📌 Disclaimer: This is not financial advice. Trading is risky — always manage your risk, do your
own research, confirm your setups, and never blindly follow others. Stay safe and smart.
🧠 Are you planning to catch this correction? Or waiting for the final Wave V? Let me know in the comments 👇

C98USDT – Potential Impulse Wave 3 in Progress? | Elliott WaveHello traders! 🚀
Sharing a fresh Elliott Wave setup I'm currently monitoring on C98USDT (4H TF). The price structure is unfolding clearly and may be in the early phase of a classic 5-wave impulse.
After an impulsive move up completing Wave (1), the market corrected in a textbook ABC pattern down into a key demand zone, finishing Wave (2). We’re now seeing strong bullish momentum suggesting the beginning of Wave (3) – the longest and most aggressive wave in Elliott theory. ⚡
Trade Setup:
🟢 Entry Zone: 0.043 – 0.046
🔴 Stop Loss: 0.03913
🎯 Target Price: 0.05955
💡 Note: Always manage your risk and confirm with your own analysis before entering any trade.
Let me know your thoughts and wave count below! 👇
Happy trading! 🚀

KSMUSDT D – Start of Wave 3? After a clear 5-wave impulsive move up, KSMUSDT seems to have completed a deep ABC correction, potentially marking the end of Wave 2.
📉 Wave 1: We had a clean five-wave move from the bottom, which fits classic Elliott Wave structure.
📉 Wave 2: The correction that followed was much deeper than the ideal Fibonacci retracement zone. However, crucially, it never violated the low of Wave 1, which means it still holds valid under Elliott Wave rules. The correction unfolded as a textbook ABC pattern, with Wave C digging deep into the previous structure — showing panic selloff and possibly a final capitulation.
🔄 Key Development Now:
The resistance trendline of the correction has just been broken, suggesting potential momentum shift. This could mark the beginning of Wave 3, which is typically the strongest and most impulsive wave in Elliott Wave theory.
📈 Potential Target for Wave 3: Around the 39.5.80–42.00 area based on Fibonacci projections, but this is an early assumption and requires confirmation by price action and volume.
⚠️ Important Risk Note:
Despite this bullish technical setup, the current market remains risky. The bounce is fresh, and confirmation is still lacking. There's still the possibility of a deeper retest or invalidation of this count if price closes below the base of Wave 1.
🧠 Trade Plan:
- Wait for follow-through confirmation.
- Manage risk carefully — this is an early entry scenario.
- A stop below the recent low (~11.30) would be logical for this wave count.
📊 What do you think? Is this the beginning of a powerful Wave 3, or just another fakeout?
💬 Drop your thoughts or alternate wave counts in the comments!

EUR/USD Elliott Wave Outlook – Expanded Flat Playing Out?EUR/USD appears to be unfolding a classic expanded flat correction for wave (4):
Wave A formed as a 3-wave zigzag
Wave B retraced beyond the start of A — a key trait of expanded flats
Now looking for a 5-wave C-leg decline toward the 1.1122 – 1.1002 area
Aligned with 1.0–1.618 extensions of A
RSI + MACD divergence adds bearish confirmation at the B top
Potential bullish reversal zone into late June / early July
As long as price holds below the B high (~1.1650), the bearish path in wave C remains in play.
📍 Target zone: 1.1122–1.1002
📈 Bias: Bearish short-term, bullish long-term (wave 5 up next)

DEEP 2H AnalysisHey traders! 👋
I’m watching a potential Wave 3 impulsive move forming on DEEP/USDT that could present a strong bullish opportunity. Let’s break it down 👇
🔹 Structure Overview:
We’ve completed a five-wave impulse upward (Wave 1 ✅), followed by an irregular corrective Wave 2 (ABC correction). This setup opens the door for a classic Elliott Wave 3, which tends to be the strongest leg in the sequence.
🟩 Entry Zone: 0.195 – 0.205
🎯 TP: 0.256
🛑 SL: 0.182
⚖️ Risk/Reward Ratio: 1:3
📌 Remember:
Take care of your risk and money management. Always size your positions according to your plan.
💬 What do you think? Does this count look solid to you, or are you seeing a different wave scenario? Drop your thoughts below ⬇️

$TSLA Sales Slump but is Support Near?Is Tesla ( NASDAQ:TSLA ) facing a sales slump and an overpriced valuation? In this video, we dive into the latest Tesla stock analysis, starting with the declining sales numbers and why the current valuation might be raising red flags for investors. We then break down the weekly chart, spotlighting a potential breakdown retest as NASDAQ:TSLA price nears key support levels around the 243 weekly SMA. What was once resistance could now flip to support—find out how! Zooming into the daily chart, we explore the 280 price level where the 200 SMA is and outline a possible 5-wave pattern completing at 243, followed by a correction toward Goldman Sachs’ 320 target and Bank of America’s 380 forecast. But could a deeper drop to 200 be on the horizon? Get the full technical analysis, price targets, and insights to navigate NASDAQ:TSLA ’s next move in this must-watch stock market update!

Dollar vs. Yen - Long Term Swing Trading Idea - 08-th Jan 25'USDJPY from 20-th Dec' 2024 to 6-th Jan 2025 created A-B-C-D-E formation which is 4-th wave.
Then from 156.25 area till 158.55 created 5 waves and finished the trend.
Our expectations for the next few days are the price to retrace at least 250 pips till zone of 156.00 and there will find support. Long term idea is to reach 153.00 level in period of one month.
EURUSD is at weakest and creating a swing low at levels over 1.0250-1.0300. If EURUSD bounce back to 1.0600 that will confirm the USDJPY trading idea for weaker dollar in next few weeks.
Trading idea parameters are as follows.
Entry: 158.50
Stop 159.50
Target 153.20

USDJPY SELL: My First 2025 trade. Good morning traders and Happy New Year.
This is my first 2025 trade: USDJPY Sell. Analysis or commentary will come later.
Cheers and Happy trading.

USDJPY: Bearish Break in FocusHello Traders,
Below is my analysis of USDJPY currency pair from H1 perspective.
Trend & Sentiment
USDJPY is in a strong downtrend, forming lower highs and lows. The recent break below 153.819 confirms bearish momentum, with sellers firmly in control.
Key Levels
Resistance: 153.962 (Minor), 154.653 (Major)
Support: 153.276
Possible Movement
Bearish Continuation: Likely toward 152.466 (target) as long as the price stays below 154.653.
Retracement Risk: Minor resistance at 153.962 may cap any short-term bounces.
Reversal Signal: A break above 154.653 could shift momentum to bullish.
Conclusion
The outlook remains bearish with a focus on 152.466, while resistance at 154.653 defines the trend's invalidation point.
Do let me have your thoughts.
Cheers and happy trading!

#USOIL Next Move By We Trade Waves (21 Jan 2024)Hey Traders, This is USOIL Analysis and update for all of you.
What we can see is market to make one small up move, complete the complex structure and fall.
If you have missed our last stream on TradingView, you can watch the recording here:
www.tradingview.com
DO NOT JUMP IN - Jumping in without using stop loss or risking big or following anyone blindly leads to big losses, never do that. Always wait for your setups and use proper risk management!
If you want us to post more charts, setups and explain more about the next move, make sure to follow us, like and comment.
We are sharing our point of view on what could be the next move in the markets based on our We Trade Waves wave analysis concept so this is a directional bias and not signals...
DO NOT FORGET "We Trade Waves" 4 GOLDEN RULES:
1) Do not over-risk
2) Do not over-trade
3) Do not trade without stop loss
4) Never ever add to losing position
DISCLAIMER: We Trade Waves is not a signal service. Instead, it involves sharing our perspective and detailed analysis based on our unique wave analysis concept. We cannot be held responsible for any financial gain or loss that may result from following our analysis.
Trade with care
We Trade Waves Team

BTCUSDT 5th wave downward of an ending diagonalAccording to my wave count, BTCUSDT is finishing an 5th wave expanded in an ending diagonal to complete wave 5 of the actual bearish impulsive wave of this cyclical bear market.

BNBUSDT Igniting the most profitable waveBNBUSDT is about to make the most profitable wave for position / swing traders at this actual peak as the price action tends to break-down the ending diagonal, in which the price just complete the final (5th wave) leg. All explained at the chart.
