BTCUSDT DAILY : HIT THE FVGHi Guys, Hope you well. and have good weekend
As we have been waiting for a while, Bitcoin from our green box, which was a very good PRZ location, was able to grow well. Now we can see the prices of 34,500 and even 36,000 according to the excellent liquidity ranges, and similar to these imbalance areas in the Tether chart, which I will do in the next analysis. The expectation of the market is to reach the 35000 range with the weakness of the trend and then move towards the long-term upward trend.
SecondChanceCrypto
⏰25/JUNE/23
⛔️DYOR
Always do your research .
If you have any questions, you can write them in the comments below.and I will answer them.
And please don't forget to support this idea with your likes and comments.
Wavesusdt

Waves Getting Ready for 70%+ bullish Wave Seems Like Getting Ready For Massive Bullish Impulse Formed & breaking Descending Channel in h8 tf Incase Of Successful Breakout Expecting 70 to 75% Bullish Wave

WAVESBTCWAVESBTC
The situation for WAVESBTC is quite interesting - the coin has broken through its support line and is trying to find a new bottom. . WAVES should be considered for purchase only after the appearance of significant news or positive changes in the project. We do not recommend entering large volumes now. In case of any news, we will inform about everything in the channel.
If you like the idea, don't forget to subscribe and rate like👍

WAVESUSD Channel IdeaAn idea considering a channel upwards on waves and subsequent price reversal at bottom of channel
Inverted H&S in circles

WAVESUSDT → The price comes out of the wedge. Expect impulseWAVESUSDT makes a retest of the strong support area of 1.500 and breaks the resistance of the descending wedge. This set-up, if positive, could strongly reverse the market.
The price tests the liquidity of the support area and forms a rebound from the 1.500 level. In phase two, the price breaks the wedge resistance and is in a consolidation format.
A local resistance of 1.669 is forming on the junior timeframe. If the bulls can overcome this resistance zone, an impulse may form, which will only push the price after exiting the wedge.
The moving averages act as resistance. The price might soon test the MA-50.
Strong support: the descending boundary of the wedge, level 1.500
Strong resistance: 1.669, 1.800, 2.350
I expect consolidation above the level of 1.500 and breakout of 1.669 with further growth of the price to 2.350, then to 5.000
Sincerely R. Linda!

WAVES : NEW UPTREND T: $3.28 WAVES seems to enter a new uptrend.
We will follow this coin for more confirmations on the below target to see if it's able to gain.
Important target:$3.28

Long iead for WAVESUSDTWe have identified and executed the following trading idea:
Buy signal #WAVE/USDT🚦 (Long)
3x Multiplikator ℹ️ Cross/ Isolated
Market / Limit Order 5%
Buy 1.885 - 1.860
Target 1: 1.903
Target 2: 1.923
Target3: 1.949
Stop: 1.827

waves going to die 0waves going to die 0. 13 mounts losing x20 btc pair and still down.. it will be delist on binance..

WavesUSDT“Half of me is filled with bursting words and half of me is painfully shy. I crave solitude yet also crave people. I want to pour life and love into everything yet also nurture my self-care and go gently. I want to live within the rush of primal, intuitive decision, yet also wish to sit and contemplate. This is the messiness of life - that we all carry multitudes, so must sit with the shifts. We are complicated creatures, and ultimately, the balance comes from this understanding. Be water. Flowing, flexible and soft. Subtly powerful and open. Wild and serene. Able to accept all changes, yet still led by the pull of steady tides. It is enough.”

WAVESUSDT looks like a level breakdownHello everyone. I noticed an interesting graph at WAVESUSDT. The thing is that firstly, the coin behaves better than the market and does not fall much when the rest go to correction. We are also standing at the resistance level. In past times, the price barely touched this level or immediately the entire growth was blocked. Now we are pushing the level well and the price does not think to go down. Therefore, this situation is similar to further breaking through the level and going to the goal at 2,4. The stop is small, we put it at 2,162.

WAVESUSDT 2H HR MTWAVES
The beginning of the second upward wave
Correction to the 0.618 Fibonacci area
The second touch supports the dirty floor
TP
Move up to the 0 Fibonacci area

WAVESUSDT forecastso far the price action is being contained inside the parallel channel, it needs to stay there otherwise it will need a recount.
for me the asset is still in the process of correction and it's possible that we are still missing a wave X and Wave Y.
only if it breaks the channel to the upside will I say it's bullish we can probably see a bigger rally up.

waves is bullishHi, dear traders. how are you ? Today we have a viewpoint to BUY/LONG the WAVES symbol.
For risk management, please don't forget stop loss and capital management
When we reach the first target, save some profit and then change the stop to entry
Comment if you have any questions
Thank You

WAVESUSDT at range low, likely to aim for range high at 2.162The price is trading between daily support and weekly resistance. For past few days, it has built another narrow daily range between this daily support and weekly resistance. Currently the price is at low of this range and likely to aim for the range high at 2.162.
Double Top: Target reached.Hello Trades,
Am sorry for not sharing this idea earlier before the breakout, but I was waiting for anyone to share it but I found no one shared it !
You still can count it as an educational idea.
-
if you zoom out on your 1h Chart, You will see a double top pattern formed and already broken, thats why waves got about 20% down in the past few days.
-
Educational:
The double top is one of the most popular patterns in trading. It's a reliable reversal pattern that can be used to enter a bearish position after a bullish trend. It consists of 2 tops at nearly the same level with a valley in between, which creates the neckline. The second top does not break the level of the first top, so the price retested this level and tried to make a higher high, but failed. Price breaking the neckline and closing below it would complete the pattern.
Conservative traders look for additional confirmation and aggressive traders may enter a bearish position from the second top. The target can be estimated by measuring the height of the pattern and projecting this downwards from the neckline. Common stop levels are just above the neckline, halfway between the neckline and the tops or above the tops. The double bottom is the bullish version of this pattern that can form after a downtrend.
-
Thumb up for updates
Follow for calls on different coins
-Remember: am not a financial advisor, whatever I publish you have to do what you see on your chart and what you agree with.

[UPDATE] Wyckoff on WAVESHello Traders,
This is a quick update on waves for the targets !
I hope you made some profits from this idea <3
Thumb up for more on WAVES
Follow for more on ALTCOINs.
Have a nice day !!
-
Educational :
The distribution schematic has similar phases to the accumulation schematic, but with many of the same events along the way happening in the opposite direction.
Phase A - Arriving with the Markup Phase of the cycle is the Preliminary Supply (PSY), which demonstrates the first opportunity to sell for strong profit is nearing. The Buying Climax ( BC ) where the Composite Operator and bears first sell-off, creating a new resistance line. Price drops until a new Automatic Reaction (AR) occurs, bouncing the price up again to a Secondary Test (ST).
Phase B - Similar to Phase B of the Accumulation Schematic, in that, this is now where the Composite Operator will sell off its investments and realize profits from the previous schematic phases. Again, bear traps and bull traps may occur between the trading range. An Upthrust (UT) may also occur, briefly surpassing the BC , and setting a new resistance line.
Phase C - Just as with the Accumulation Schematic, this phase may or may not occur. An Upthrust After Distribution (UTAD) could find the market a new high. Whether or not this happens, Phase D eventually takes place.
Phase D - This is the last point for investors to sell at higher prices before the price begins to capitulate. Usually, a Last Point of Supply (LPSY) is found within the trading range, then a buy/sell reaction occurs, and another LPSY is located at or below the support line, triggering Phase E.
Phase E - The downward capitulation begins with a clear drop under the trading range as investors sell off, diminishing demands and tanking the price.
------

WAVESUSDT well-known paternHello everyone. As a whole, the mood in the market is certainly good. Many coins outbid local highs. Specifically for WAVESUSDT, we formed the "head and shoulders" pattern. Last time in February, we played this pattern only in short by 30%. Now you can look long at the level of 2,688. You can put a stop on the trend line, which is pressing to the level of - 2,293.

Waves 2023catching the vibe is thought to be a thing of the past but it seems not, catch this wave to the moon around 2025. bullish divergence looks frothty

WAVES/USD Main trend. Accumulation and distribution zones. Logarithm. Main trend. Time frame 1 month.
Are you scared in the market right now? If yes, then rejoice and change your fear into a positive. After all, if you're scared, then other market participants are similarly scared, and this is an understanding of the surrender zone.
Linear schedule . 1 month.
Accumulation and distribution. The average price of recruitment and resetting.
In this trading idea, I will describe how a big player works and manipulates the price of an asset. You need to understand the mechanism of market play according to cycles and the psychology of people's behavior in the market in different phases of the cycle.
The big player in the asset accumulation zone "makes volatility," allowing you to earn locally (he buys into you). On pamp, you sell coins with a profit of +50%, +100% +200% is not particularly important.
After all, the point is for you to sell coins at a profit or a loss. The less liquid the instrument, the wider the range, and vice versa. Then the same coin is sold to you or others like you in the next cycle, but at a profit of +10,000% or more.
For a major player, the % monopoly on coins of the total market turnover is important. A large percentage of the total turnover gives an opportunity to influence the price in its favor, in other words, to control the price of the cryptocurrency.
As a rule, most do not buy in accumulation, they are afraid. They wait for those who are supposed to sell to them to say, "Fools, it's time to buy in triple-dollars."
Accumulation.
You make a lot of money not on the pump but in the growth of the price in a strong trend. It takes time, sometimes a very long time, to accumulate a position in a certain range. On some liquid U.S. stocks, it takes a year or more to gain a position. On cryptocurrencies, this process is much faster, but sometimes this stage of the process is time-consuming.
Most market participants, who are doomed to lose all the time, do the opposite. Projecting into trading what they are in real life. Anything that has to do with money reinforces this effect. Buy expensive (aimed at buying), sell cheap (aimed at selling). Do not inherit this tendency.
Distribution of coins (sale of coins).
Similarly, it takes a long time to reset a large position in an acceptable price range as well. This example of working on this cryptocurrency illustrates this creative process well. It is a creative process because it is work according to the plan, but from the situation that develops, you need to inspire the mice to willingly crawl into the mousetrap with a smile on their face.
We need to keep the price (price level range) and let them earn +30%, +100% +200% is necessary to get everyone used to super-highs. Make a substitution in the concept of “super highs” and “bottom”. And simultaneously, you gradually unloaded your position. Believing hamsters will willingly buy "from the bottom" thereby you will not burn a lot of money to keep the “faith level”. You have to understand the mindset of the majority and their desires.
Most people can't think for themselves, they pass off other people's insinuating thoughts as their own. Such is the psychology of the lower classes. Destructive desires, low intelligence and ideological significance. They do their thing. Intelligence in the crowd evaporates, herd cloning thinking is turned on. It's contagious...
After about 60-70% of the position is sold out in an acceptable range, the dumping of the rest of the asset begins. By moving the price down to the desired new set of positions, you gradually "kill the faith" of the lazy hamster in a bright future. As a rule, the crowd is drained at the very bottom, when it was told to sell, or correctly said, instilled with the idea to get rid of the “unpromising”.
You must know in advance where and at what % of the allocated sum you will fill the position and under what conditions. There should be discipline in everything, and you should determine in advance your future actions according to your trading algorithm, rather than an emotional component.
Closer to the main position set zone-another price increase (optional) to unload another 10-20% of the position. In this coin this was done in the last cycle. Often you can see that this is done differently. Imitation of the accumulation channel, when the remaining extra part of the position is unloaded (not all of it). This method allows deceiving not completely stupid people, namely traders who analyze only price charts and understand the internal processes.
People see an imitation of accumulation. This, by the way, is difficult to understand. After all, skillful work always hides "traces of the crime" in the buying/selling lane. And only experience allows you to determine that. For example, I once got into such a situation due to my inattention, but a timely exit upon confirmation of a breakdown of channel support partially leveled the situation. Unsuccessful experience is also extremely important, you need to make the right conclusions and continue to develop in this area as a player or even as an operator.
In the next cycle of accumulation-pumping-dumping-accumulation, the process naturally repeats itself, if the organizers have enough rationality to support the project. A fool is not a mammoth, he will not go extinct. That's why this market makes super profits. It's very simple.
I copied the entire text from my educational article 2020 , on the same coin.
Profit over +500% since publication.
Maximums as shown +12,300% or $60.66
WAVES/USD Main Trend. What "fuel" doesn't see. Process .
Now there are problems with the USDN Stablecoin near the surrender zone
Importantly, you have to understand that this is DEX WAVES Stablecoin, which is the point of "untethering." Amazingly, I haven't come across anywhere in the comments disgruntled and understanding why this is being done. Is the market to blame, as in LUNA-UST? All accidents of this magnitude are not. On the Internet, in the comments of victims encountered only negative (gave up, anger at losing money, “killed faith”) or conversely positive (the desire to save your money). Any trader understands the essence of cheating.
Any stabelcoin is an altcoin whose stability depends on people's belief in its stability, and the willingness of its creators to maintain that belief in stability.
WAVES/USD Secondary trend. Wedge. Capitulation. Locally. Time frame 1 day.
Locally. Time frame 1 day.

✴️ Waves Of Growth (Update)We've seen some growth since our last update.
WAVESUSDT found resistance yesterday at MA200, a rejection happened but the current price remains above EMA100/50 and EMA10.
Bear volume was high yesterday but the fact that no considerable drop happened favors the bulls.
The MACD is crossing north above zero for the first time since February 2022.
When this happened last year a major bullish wave took place.
It seems this year it will be the same.
86%+ first target at EMA300.
267% second target as this move develops.
Patience is key.
The bottom was very likely set December 30.
Namaste.

WAVESUSDT heading for weekly resistance 3.2-3.5 rangeWAVESUSDT still having some potential to go up and tap the weekly resistance. That resistance will push the price down.
The weekly support is also marked where it will find the support when the price will be pushed down from the weekly resistance.

WAVES🌊 tsunamiWassup guys! Waves broke the dam in form of this triangle📐 and I think there is chance for "splash" to 3.07 and even higher, but we could see some correction first. I traded the initial breakout but one can set BUY LIMIT order to previous range high to catch🎣 the potential pullback. As always ... don't chase the market, let the market come to you.
ENTRY : local high @ 2.515
STOPLOSS (SL) : local low @ 2.315
TARGETS (TP) : height of the triangle projected from midpoint of the local range (BUY LIMIT - STOPLOSS) @ 3.07 but I see also lower hurdles @ 2.82 and 2.95.
REWARD RISK RATIO (RRR) : 1.5 | 2.15 | 2.75
INVALIDATION : when SL level hit
Check my other stuff in related ideas.
Please boost🚀, comment🗣️, follow me✒️, enjoy📺!
⚠️Disclaimer: I'm not financial advisor. This is not a financial advice. Do your own due dilingence.

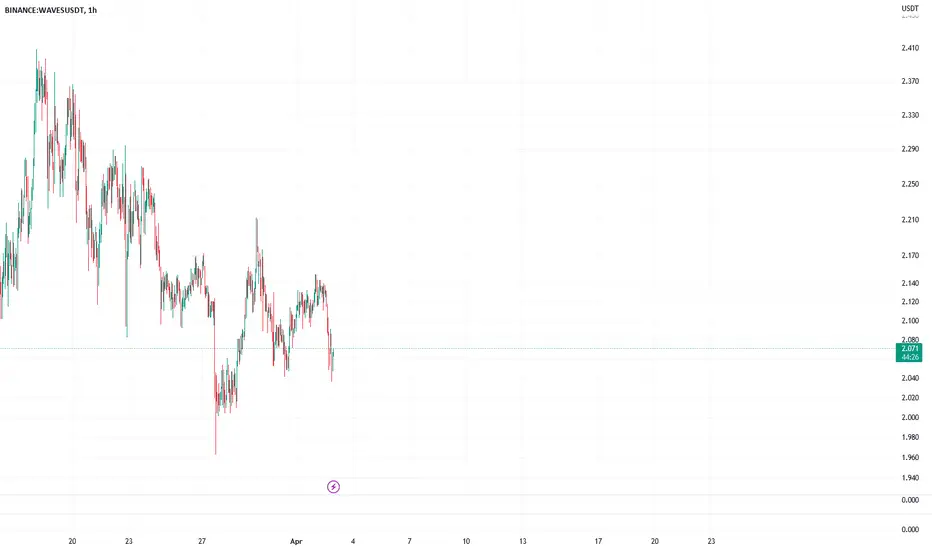
LONG WAVES AREA ON BINANCE FUTURESI think waves are an interesting thing in analysis, there is a buy order area at 2$ with a risk ratio of 2.34, this is quite satisfying if it works. with stoploss area at 8%
