XAU USD - Corrective wave ABC?Updte to previous post.
Still long, awaiting the corrective structure to occur - firstly to break and hold under $4000 (key level).
Downward channel - to $3800 which is another area of interest - reason being, it holds high volume at a structure point under $3800. So, we sit tight and await the corrective pattern to emerge and complete.
Daily chart image shows my thought pattern and an opportunity I am waiting for price to revert to.
I'm referring to the Daily price chart and key counts are in line with Wave counting and supply and demand curve trading levels based on fair value gap intervals of weekly trading sessions plotted to a daily chart at intervals of 60.
Current wave - 3 of 5 in the Elliott wave count.
Experiencing ABC corrective structure.
Master Key for zones
Red = Three Month
Blue = Monthly
Purple = weekly
Pink = Consolidative box example (Daily)
Orange = Daily
Risk Warning
Trading leveraged products such as Forex, commodities and CFDs, carries with it a high level of risk and so may not be suitable for every investor. Prior to trading the foreign exchange, commodity or CFD market, consider your investment objectives, level of experience and risk appetite. You should never risk more than you can afford to lose. If you fail to understand or are uncertain of the risks involved, please seek independent advice and remember to conduct due diligence as criteria varies to suit the individual.
Below are some of the take aways from the video - please listen again incase any detail is missed.
Do you enjoy the setups?
Professional analyst with 8+ years experience in the capital markets
Focus on technical output not fundamentals
Focus on investing for long term positional moves
Provide updates where necessary - with new updated ideas tracking the progress.
If you like the idea, please leave a like or comment.
To all the followers, thank you for your continued support.
Thanks,
LVPA MMXXIV
Wavetheory

NIKE — $31–$11 bottom | Before SuperCycle Wave 3 hits ~$1000⚡ NKE: Micro Wave 4 Bounce Before the Final Flush 👟🔥
Nike ( NYSE:NKE ) has been in a SuperCycle Wave (2) correction since topping near $179 in 2021. This isn’t a collapse — it’s a structured reset that should run into 2027 , forming a large ABC correction before the next SuperCycle Wave (3) bull phase begins.
Right now, price action is inside a micro Wave 4 move within the ongoing Wave A. Micro waves 1, 2, and 3 have completed, and waves A and B of this current wave 4 are also done. What’s likely next is a short-term bounce toward $82 , where equal highs and liquidity sit, before a final Wave 5 decline finishes Wave A around the 0.236 Fibonacci retracement near $31 .
From there, expect a Wave B rebound followed by Wave C down toward the 0.382 retracement around $11 , which could complete the full SuperCycle Wave (2) correction. That zone may become the macro accumulation area ahead of the next explosive SuperCycle rally.
The $82 region aligns with a liquidity grab in Smart Money terms — a trap for breakout buyers before price descends into the deeper $31–$50 institutional value range , matching demand zones from 2016–2018.
This phase is less about panic and more about patience. Once the 2021–2027 correction ends, Nike could begin a multi-year rally that redefines its valuation.
The swoosh isn’t breaking — it’s recharging for its next leap. 👟⚡
#NKE #Nike #ElliottWave #SmartMoneyConcepts #WaveTheory #Fibonacci #PriceAction #MarketCycle #TechnicalAnalysis #TradingViewAnalysis #StocksToWatch

Hellena | SPX500 (4H): LONG to resistance area of 7000.Colleagues, I believe that the upward movement is not over yet and at the moment the formation of wave “3” is taking place, but the chart shows a gap that should be closed.
Therefore, I believe that the price can go into correction of the small wave “4” to the area of 6823, but the priority is still the upward movement, as I believe to the resistance area of 7000.
Fundamental context
U.S. business activity strengthened in October: the S&P Global PMI rose to 54.8, indicating expansion in both manufacturing and services sectors.
However, uncertainty persists — business sentiment and export performance have weakened, while the partial government shutdown limits data visibility.
At the same time, the Federal Reserve is expected to continue rate cuts as the economy shows signs of slowing.
Manage your capital correctly and competently! Only enter trades based on reliable patterns!

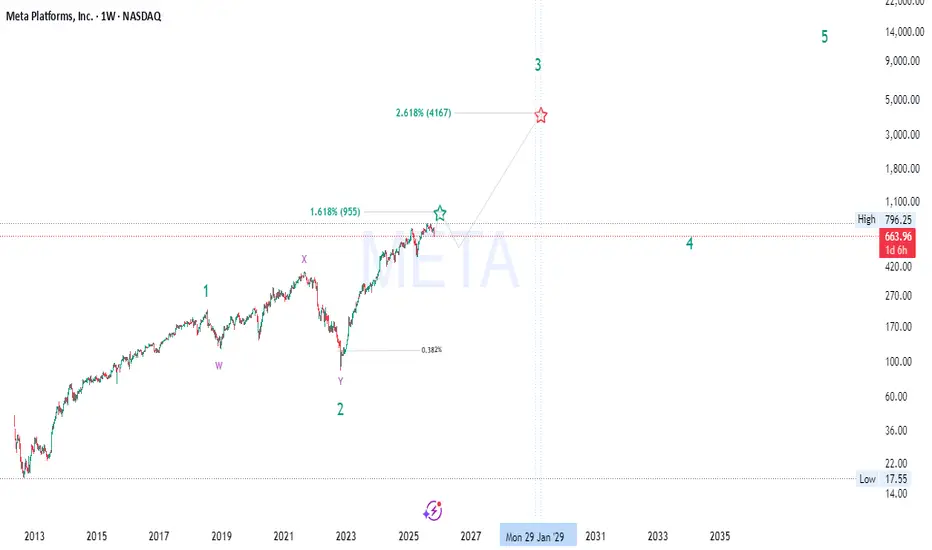
META’s Hidden Fibonacci Path to 4000+ — Don’t Miss Wave 3🚀 META Long-Term Elliott Wave + Smart Money Macro Outlook
🌊 Elliott Wave Structure (662→955→4000+)
META appears to be progressing through a major impulsive 5-wave supercycle on the weekly timeframe:
Wave 1: The initial breakout from accumulation (2015–2021), fueled by growth in advertising dominance and metaverse expansion narratives.
Wave 2: Deep corrective W–X–Y structure into the 2022 low around $90 — a classic multi-year liquidity sweep and re-accumulation phase.
Wave 3 (in progress): This is typically the strongest and most extended wave , with Fibonacci projections aligning near the 2.618 extension ≈ $4,160 , targeting 2028–2029 based on current momentum.
Wave 4: Expected to form a macro re-distribution or range between ~$900–$1,000 before the final parabolic Wave 5, likely extending toward $10K+ .
💡 Wave Confluence:
1.618 Fib extension of Wave 1 → Wave 3 aligns around $955 , acting as the first major resistance (and your current high zone).
2.618 Fib extension → next macro target $4,160 , confirming bullish impulsive momentum.
🧠 Smart Money Concepts (SMC)
The 2022–2023 bottom represents a “Displacement + Re-accumulation” phase , with institutions absorbing liquidity beneath previous demand zones.
Current price action (mid-2025) shows a premium range reaction , where smart money is likely taking partial profits before the next accumulation leg.
Expect a retracement into the 0.382–0.5 Fib zone ($420–$500) to rebalance inefficiencies before continuation toward macro Wave 3 targets.
Key Reaccumulation Zone: $420–$500 — watch for BOS (Break of Structure) confirmation and liquidity sweeps below equal lows.
🔍 Fibonacci Alignment
0.382 retrace marks ideal Wave 4 re-entry.
1.618 & 2.618 extensions align perfectly with the Wave 3 and 5 confluences — textbook impulsive expansion.
Each extension zone has been confirmed with prior liquidity sweeps and displacement candles, increasing Fibonacci reliability 📈.
📊 Market Structure & Price Action
META maintains a strong bullish market structure of Higher Highs (HH) and Higher Lows (HL) since 2023.
The recent 9% correction (-$69) is likely a short-term liquidity grab — not structural weakness.
As long as price holds above $420 , macro bullish market structure remains intact.
Volume profile shows heavy accumulation between $300–$450 , suggesting smart money is still positioned long-term bullish.
💰 Fundamental Confluence
META’s fundamentals are catching up with technicals:
Massive AI CapEx and ad recovery boosting EPS growth 📊
Metaverse burn rate shrinking , improving profitability
Share buybacks providing a floor for price corrections
Macro environment supports tech leadership rotation , and META remains a key beneficiary of the AI + social data synergy cycle 🔄
🔮 Market Cycle View
We’re entering the “Expansion Phase” of the broader innovation cycle.
2018–2022 = Accumulation/Disbelief
2023–2025 = Early Markup / Smart Money Entry
2025–2029 = Public Participation Phase (Wave 3) 💥
Post-2029 = Euphoria / Distribution (Wave 5) 😱
⚙️ Key Levels to Watch
Support Zones: $420 – $500 (Wave 4 re-entry)
Resistance Levels: $955 → $4,160 (Wave 3 targets)
Invalidation: Sustained break below $300 on weekly close
📈 Summary
META remains one of the strongest macro bullish charts in big tech — with perfect alignment across Elliott Wave, SMC, Fibonacci , and fundamental cycle theory .
We’re currently witnessing the mid-phase of Wave 3 , with institutional repositioning before the next vertical leg. Patience and precision around the reaccumulation zone ($420–$500) could provide the golden setup before the next expansion wave 🚀🌕
#META #ElliottWave #SmartMoneyConcepts #Fibonacci #Wave3 #BullMarket #AIStocks #TechnicalAnalysis #TradingView
NZDJPY — Waiting for the Sweep Before the ImpulseThe market is setting its own stage.
The green ABC correction is approaching its final C-leg — right into a cluster of confluence: trendline support, an internal order block, and a liquidity pocket resting beneath the prior lows.
I’m waiting for that final sweep into the OB/trendline area before stepping in to ride the pink impulsive C-leg toward the upper channel and buyside liquidity zone near 88.6 – 88.8 .
The plan is simple:
– Let the algorithm complete its cleanup below.
– Watch for an MSS and fair-value-gap confirmation.
– Ride the next displacement toward the liquidity resting above.
Invalidation:
If price violates the order block decisively and structure fails to shift, the setup expires.
Strengths:
– Clear multi-timeframe wave alignment (green correction → pink impulse)
– Strong OB + trendline + liquidity sweep confluence
– High reward potential once the pink C-leg activates
Weaknesses:
– Early entries before sweep risk being trapped
– Yen volatility can disrupt lower-timeframe confirmations
Summary:
Patience before precision. I’m waiting for the sweep to finish — then decoding the next wave of chaos.

Hellena | EUR/USD (4H): SHORT to the support area 1.15419.The situation is quite interesting. I would not like to recommend selling, but judging by the waves, the price should update the minimum of 1.15419 and complete the wave "C" of higher order near the level of 1.15000.
Then the triangle (ABCDE) will continue to develop. And as much as I don't want to, I will insist that the price will continue the downward movement at least to the support area of 1.15419.
Fundamental context
The dollar continues to be under pressure - markets are increasingly laying expectations of a soon Fed rate cut due to signs of a slowdown in the US economy. At the same time, the euro is receiving moderate support due to stability in the eurozone and investors' interest in alternative assets outside the dollar.
In fact, this may lead to some sideways movement, which will be expressed in the triangle (ABCDE).
Manage your capital correctly and competently! Only enter trades based on reliable patterns!

XLMUSD — Bullish Continuation Valid While Red B HoldsFrom the top-down view, XLM completed a deep corrective structure that bottomed inside the previous WCL (blue box). The current sequence builds a new bullish cycle , with the red ABC wave mapping cleanly against both structural and liquidity geometry.
Price reacted strongly from the red BC demand zone , producing a local yellow ABC micro-sequence. The setup anticipates continuation toward the upper WCL region (0.38 – 0.42) .
The re-entry area sits near the mid-trend retest—confirmation required via MSS + FVG displacement.
Invalidation:
This idea remains bullish until the red B low is broken . Violation of that pivot voids the wave count and resumes the broader correction.
Strengths: – Multi-timeframe alignment (macro + micro)
– BC demand reaction with displacement
– Defined invalidation under red B (lowest-risk logical stop)
Weaknesses:
– Correlation drag if majors retrace
– Shallow pullbacks may induce premature MSS signals
Summary:
Bulls control the rhythm while red B stands. Break B — and the music stops.

ADAUSDT — Dual Wave ConfluenceTwo independent cycles now point to the same liquidity zone.
The wine wave (macro) has entered its BC retracement phase, and its BC target aligns perfectly with the green micro-wave’s C-target , forming a rare dual confluence at the same level. This overlap creates a liquidity magnet — a structural point where both wave systems expect equilibrium before a bullish expansion.
Price is currently reacting inside the BC demand zone , finalizing the correction before expansion toward the macro C projection at 0.7575 .
The alignment between both scales confirms that momentum and liquidity are synchronized for continuation.
Strengths :
Perfect alignment of macro BC and micro C targets
Discount entry within structural demand
Defined invalidation below BC low
High asymmetric RR toward 0.7575
Weaknesses :
Requires bullish displacement confirmation from demand zone
Possible short-term inducement before expansion
Invalidation if structure breaks below BC
Bias : Bullish continuation
Target : 0.7575 (macro C projection zone)

Hellena | SPX500 (4H): LONG to resistance area of 6777.Price made a sharp and strong move to the 6503 level, making wave “4” quite large, but this move did not break the structure.
I think that now the price is in the big wave "5" and middle wave "2".
I think that there will be an upward movement with the purpose to renew the maximum of the wave "3" of higher order.
Therefore, I expect the price in the resistance area of 6777.
Fundamental context
After the sharp drop, the market quickly recovered — investors are once again turning to risk assets amid growing expectations of upcoming Fed rate cuts.
Inflation data came out under control, and corporate earnings have been stronger than expected, boosting confidence in the U.S. economy.
With the dollar losing momentum and bond yields easing, the S&P 500 now has room to extend its move upward toward the resistance area near 6777.
Manage your capital correctly and competently! Only enter trades based on reliable patterns!

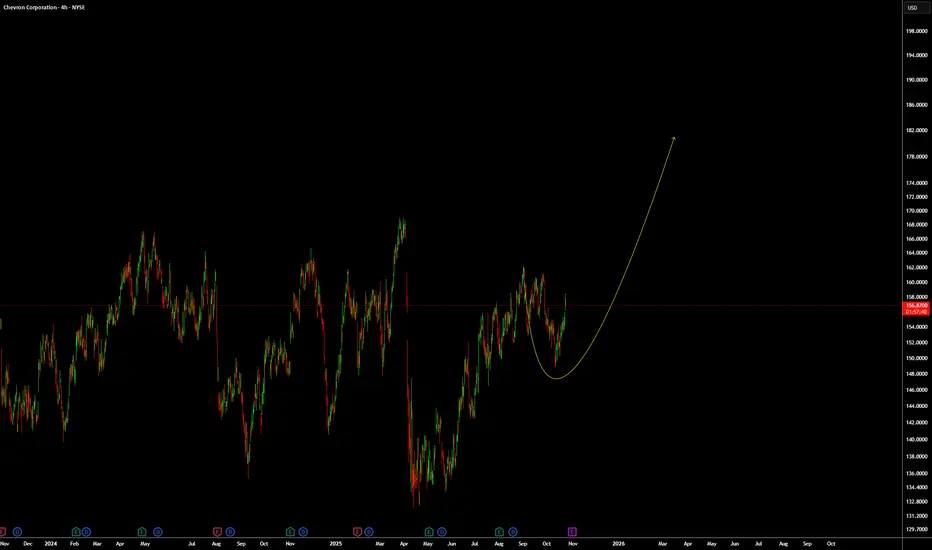
Update for CVX: Looking for an up move/wave.
As discussed before in our previous post, NYSE:CVX looks like it will go up, it did go up so if you are in manage your trades. We can see pushing higher and lets see how far will it go.
For reference, this is our previews chart:
Always remember WTW 4 Golder Rules:
1) Do not jump in
2) Do not over risk/trade
3) Do not trade without Stop Loss
4) Never ever add to a losing position!
Trade with care
We Trade Waves
WTW Team
Disclosure: We are part of Trade Nation's Influencer program and receive a monthly fee for using their TradingView charts in our analysis.
Mphasis bearish scenerioNSE:MPHASIS looks bearish for the next 6 months approx. as it has entered wave C

Hellena | GOLD (4H): LONG to 61.8% Fibo of 4265.Dear colleagues, in the new forecast the idea remains the same - the upward momentum (12345) is not yet complete.
At the moment I see the end of the formation of the corrective wave “4” at the level of 4000, as stated earlier, and the beginning of the upward movement in wave “5”.
I do not want to set distant targets, because their achievement may take time, so let's start small - the nearest target is the resistance area at 4265 - the area beyond the 61.8% level of wave “4”. I think that this is the nearest target that we should expect.
Fundamental context
Earlier this week, gold experienced a sharp pull-back after its recent record highs. Nothing to panic about — it’s simply a technical correction: investors are taking profits after a rapid and extended rally. Key drivers like central bank buying and lower rate expectations remain intact, so the broader bullish story is still alive. In fact, this brief dip may offer a better entry point before the next leg up.
Manage your capital correctly and competently! Only enter trades based on reliable patterns!

Hellena | GOLD (4H): SHORT to support area of 4040.Gold is actively rising and I believe that before the impulse ends we should see the correction that many are expecting.
As of today, I see the completion of the higher order wave “3” and the approaching start of the correction in wave “4”. It makes no sense to put any distant plans in the correction and I think that the support area of 4040 looks quite attractive.
Fundamental context
Gold continues its rally and recently broke new highs, fueled by expectations of U.S. rate cuts, global uncertainty, and safe-haven demand. Central banks are still actively increasing their gold reserves — this structural demand adds support even if price pullbacks occur.
Supply growth is modest — mining output is constrained, and recycling of gold is not enough, which limits the downward pressure on prices.
Given this backdrop, the chance of a correction rises as momentum stretches — but the underlying fundamentals remain favorable for further upside once the correction completes.
Manage your capital correctly and competently! Only enter trades based on reliable patterns!

Hellena | Oil (4H): SHORT to support area of 54.00.As I continued to watch oil I realized that the structure I built in the last forecast is still in place. I think we should expect a correction in wave “4” to the 59.3 area, then a continuation of the downward movement at least to the 54.00 support area. This will be the completion of the downward impulse.
I do not exclude the probability of lengthening of wave “3” and in this case there will be no correction and the price will immediately reach the target.
Fundamental context
The oil market remains under pressure as supply continues to outpace demand, raising the risk of a surplus. Forecasts for 2025-2026 indicate higher production growth while consumption slows.
Rising inventories and a shift in the futures curve into contango suggest growing storage levels and weaker near-term demand.
Under these conditions, downside pressure persists, keeping the probability of a further decline high.
Manage your capital correctly and competently! Only enter trades based on reliable patterns!

Hellena | Oil (4H): SHORT to support area of 56-57.Colleagues, price is actively moving in a downward direction and I believe the move is not yet complete.
Earlier I saw this move as a big correction, but now the structure is more of an impulsive one. This means that the price is moving in the wave “3” of the higher order (Red), which should be completed soon.
For this to happen, the price needs to complete the correction in the wave “4” of medium order and then update the low, reaching the support area of 56-57.
The extension of wave “3” is possible - then the price will reach the target without correction.
Fundamental context
Global oil inventories are forecast to rise through 2025, putting downward pressure on prices despite efforts by some producers to restrain output.
OPEC+ has been increasing production again, which adds to the supply burden.
Meanwhile, demand forecasts have been trimmed amid softer economic growth indicators in key consuming regions.
Major banks have lowered long-term price expectations for crude — the balance is tilting toward a more bearish outlook.
Manage your capital correctly and competently! Only enter trades based on reliable patterns!

Hellena | EUR/USD (4H): LONG to the resistance area 1.16827.Colleagues, the recent continuation of the downtrend has made me reevaluate my wave analysis a bit.
If everything is correct, we are now witnessing a correction - triangle (ABCDE).
In this case, wave “C” should not update the minimum of wave “A”. This means that I expect the upward movement to start either from the current values or after the correction is completed around 1.14876.
Then I expect the beginning of the upward movement at least to the resistance area of 1.16827 - the middle line of the triangle.
Fundamental context
The U.S. dollar is showing signs of weakness — recent labor data came out softer than expected, and markets continue to price in further Fed rate cuts. This reduces demand for the dollar as a safe-haven asset.
At the same time, the ECB is likely to keep its current policy unchanged, as there’s limited room for additional easing. That gives the euro a slight fundamental advantage.
Manage your capital correctly and competently! Only enter trades based on reliable patterns!

Hellena | GOLD (4H): LONG to resistance area of 4104.Colleagues, gold is going up steadily and right now it is hard to say where the correction will be. If we look at the wave structure, I expect the completion of the higher order wave “3” and the middle order wave ‘5’. because wave “5” completes the impulse - it complicates the concept of where exactly this wave will end. I think the psychological level of 4100-4105 is suitable for this target.
I expect the price to reach the 4104 resistance area.
Fundamental context
Gold recently broke above $4,000, driven by strong safe-haven demand amid global uncertainty and expectations of U.S. rate cuts.
Central banks continue to accumulate gold, supporting demand structurally.
Deutsche Bank raised its 2026 target to $4,000, citing a weak dollar and sustained global demand.
Given the strength and stretched momentum, a pullback is plausible — but the exact timing remains unclear.
Manage your capital correctly and competently! Only enter trades based on reliable patterns!

Hellena | Oil (4H): SHORT to support area of 58.884Colleagues, it appears that the downward movement is not over and I see several reasons to continue to look short.
The higher order wave “C” is looking to complete the correction and I expect the start of the middle order wave “3” to see the low update and reach the support area at 58.884.
Fundamental context
Oil remains under pressure as supply increases and demand outlook weakens. OPEC+ decided to slightly raise output for November, while U.S. inventories keep growing. Crude lost about 8% last week, and EIA now expects lower prices by the end of the year — all of which supports the idea of a continued downside move within wave “3” toward the 58.884 support area.
Manage your capital correctly and competently! Only enter trades based on reliable patterns!

Hellena | SPX500 (4H): SHORT to support area of 6646 .Colleagues, in the last forecast I was counting on price reaching the 6550 area, but that plan turned out to be a long term plan. I see the sense in making some shorter term targets.
The closest target I see is the 6646 support area, where wave “4” ends. This is a corrective movement, so it is necessary to realize that the price may continue to fall after reaching the target.
Fundamental context
U.S. inflation remains elevated — CPI rose to about 2.9 % YoY, with core inflation around 3.1 %. At the same time, the labor market continues to cool, and corporate earnings show mixed results. Combined with the Fed’s cautious stance and ongoing fiscal uncertainty, this creates pressure on the stock market.
Manage your capital correctly and competently! Only enter trades based on reliable patterns!

BTCUSDT – ABC Correction Hey traders 👋
Bitcoin might be setting up for a strong move downwards after completing what appears to be a 5-wave impulse structure on the higher timeframe.
There’s also a clear RSI bearish divergence, suggesting that bullish momentum is fading and a correction could be near.
I’m currently expecting a medium-term ABC corrective phase, though it’s still uncertain whether it will develop as a classic zig-zag or a flat/flag-type correction.
🎯 Trade Plan (Short Setup)
- Entry Zone: 112,000 – 118,000 USDT
- Stop Loss: above 125,000 USDT
- Take Profit 1: 75,000 USDT
- Take Profit 2: 52,000 USDT
- Final Target (Wave C): around 43,000 USDT
⚡ Notes:
If BTC breaks below the previous wave 4 area with strong momentum, that would add more confirmation to the corrective scenario. However, if the market maintains higher lows, we could still see an extended B-wave or even a continuation of the uptrend.
📘 Reminder:
This is not financial advice — always DYOR and manage your risk properly.

LINKUSDT – Possible Reversal After 5 Waves UpLINK has just completed a clear 5-wave impulsive move to the upside. With Wave V looking complete, there’s now a high probability of a corrective phase.
I’m watching for a potential drop towards the 17.5 USDT zone, which would be a significant percentage move from current levels.
📊 Potential Trade Levels:
Entry zone: 24.5 – 23.2 USDT
Stop Loss: 27.030 USDT
Target: 17.171 USDT
This scenario could unfold as an ABC correction.
⚠️ Disclaimer: This is just a personal trading idea based on Elliott Wave analysis, not financial advice. Please manage risk and do your own research before trading.

GBP JPY - Wave D forming?Daily chart image shows my thought pattern and an opportunity I am waiting for price to revert to.
I'm referring to the Daily price chart and key counts are in line with Wave counting and supply and demand curve trading levels based on fair value gap intervals of weekly trading sessions plotted to a daily chart at intervals of 60.
Current wave -
Wave A: The first correction test (200+) - where a rejection into the impulse high - to form a weekly supply.
- Wave B: Deep testing of the lows into 184 territory, but keeps the rising channel weekly in tact.
- Wave C: Technical rebound exactly to the higher wick on the max top of the supply and settled in the marked zone - of a large volume of sell orders.
- Now to Wave D formation: 190? or below 189*? showing the weekly trend down to where the wav could end?
Master Key for zones
Red = Three Month
Blue = Monthly
Purple = weekly
Pink = Consolidative box example (Daily)
Orange = Daily
Risk Warning
Trading leveraged products such as Forex, commodities and CFDs, carries with it a high level of risk and so may not be suitable for every investor. Prior to trading the foreign exchange, commodity or CFD market, consider your investment objectives, level of experience and risk appetite. You should never risk more than you can afford to lose. If you fail to understand or are uncertain of the risks involved, please seek independent advice and remember to conduct due diligence as criteria varies to suit the individual.
Below are some of the take aways from the video - please listen again incase any detail is missed.
Do you enjoy the setups?
Professional analyst with 8+ years experience in the capital markets
Focus on technical output not fundamentals
Focus on investing for long term positional moves
Provide updates where necessary - with new updated ideas tracking the progress.
If you like the idea, please leave a like or comment.
To all the followers, thank you for your continued support.
Thanks,
LVPA MMXXIV

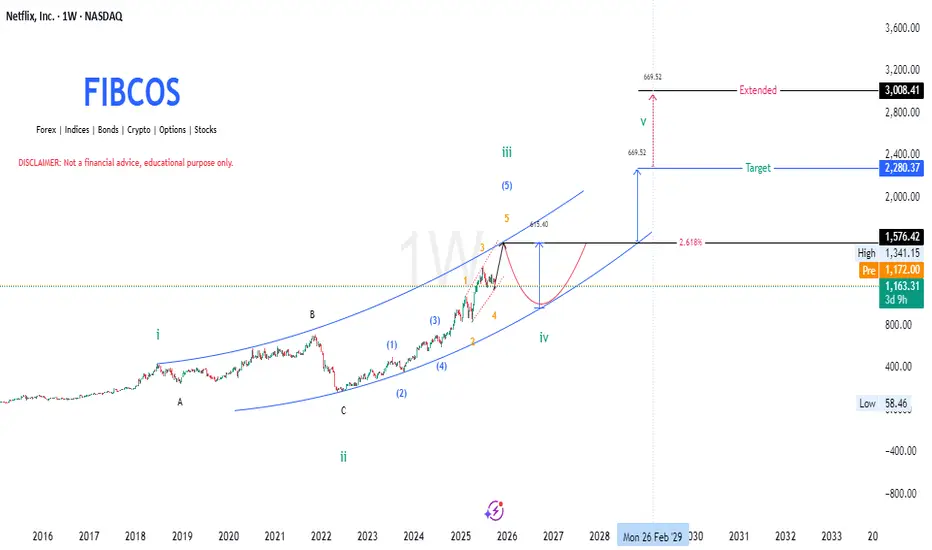
Netflix (NFLX) - Descriptive Analysis by FIBCOS📘 NFLX 2009–2029 Descriptive Analysis
This is a detailed Elliott Wave Theory -based outlook for Netflix (NFLX) stock from around 2009 to the projected future of 2029, and it incorporates Fibonacci retracement & extensions, Smart Money Concepts (SMC) , and Price Action structure within a channel.
Let’s break this down chronologically and structurally:
🌀 Wave Theory Confluence (Elliott Wave Structure)
The long-term structure of Netflix (NFLX) from 2009 to the projected 2029 period follows a classic Elliott Wave cycle, now realigned with the cycle top in mid-2018 and the macro correction ending in mid-2022.
1. Cycle Wave i (2009–2018):
NFLX entered a powerful multi-year rally, forming five sub-waves within this first major impulse. This long rally ended in mid-2018 , marking the top of Cycle Wave i .
2. Cycle Wave ii – ABC Correction (2018–2022):
From the 2018 top, the price entered a prolonged and complex 4-year correction, unfolding as a classic A-B-C corrective structure.
Wave A began the decline with a sharp markdown.
Wave B was a fake recovery, leading to Wave C, a deeper liquidation into mid-2022 , completing the correction.
This phase aligns with a major redistribution cycle where smart money exited positions, and retail investors were caught in hope rallies.
3. Cycle Wave iii (2022–2025):
After finding a bottom in mid-2022, the stock launched a new impulsive rally , forming five sub-waves (1–5) of a powerful Wave iii
Momentum accelerated in wave 3 of iii (typical in Elliott Wave), and the structure is now peaking as of late 2025, around $1,576.42.
This marks the expected completion of Wave iii, with signals pointing toward a correction.
4. Cycle Wave iv (Expected 2025–2027):
A corrective wave iv is expected to unfold, possibly returning toward the lower bound of the long-term ascending channel.
According to the principle of alternation , since wave ii was deep and complex, wave iv may be shallower or more sideways.
5. Cycle Wave v (Expected 2027–2029):
After the wave iv correction, a final impulsive leg — Wave v — is expected to push the price higher, targeting around $2,280.37 , with a potential extended move to $3,008.41 .
This will complete the macro 5-wave cycle that began in 2009.
📐 Fibonacci Confluence
The Fibonacci structure supports these wave formations:
The 2.618 extension of the previous impulse wave (measured from the 2022 bottom) projects a price target near $2,280.37 , aligning with historical extension zones.
The extended target at $3,008.41 aligns with the upper boundary of the long-term channel — often reached during euphoric final waves.
Prior retracements during wave ii and the anticipated retracement in wave iv fall into common Fibonacci pullback zones (0.382–0.618).
Fibonacci tools confirm that price has behaved symmetrically within the wave cycles, and provide high-probability zones for both correction and expansion.
🧠 Smart Money Concept (SMC)
From a Smart Money perspective, the chart reflects a complete institutional cycle:
Distribution Zone (2017–2018):
Smart money exited during the late stages of Cycle Wave i. This aligns with the cycle top in mid-2018 , often accompanied by overvaluation and high optimism.
Re-Accumulation Phase (2018–2022):
The 4-year correction allowed institutional players to accumulate at discounted prices during wave C. Retail was largely shaken out, and liquidity was swept multiple times.
Expansion Phase (2022–2025):
From the 2022 bottom, price moved sharply upward in a clean impulse (Wave iii), confirming institutional interest. Gaps, strong breakouts, and efficient trends reflected low-resistance expansion driven by smart money.
Future Distribution (2029?):
Around the projected $2,280–$3,008 range (Wave v), expect distribution signs —including deviation from trend, order block mitigation, and liquidity grabs. These are typical before a larger market reset.
Smart Money Concepts help explain the why behind each wave: fear and euphoria don’t happen randomly — they are often orchestrated phases of value transfer.
📊 Price Action Structure
The long-term price action of NFLX reinforces the wave count and market psychology:
2009–2018 (Wave i):
Price action showed a steady trend of higher highs and higher lows , with smooth breakouts and momentum-driven runs.
2018–2022 (Wave ii correction):
A breakdown in structure occurred. Lower highs and a wide, overlapping correction defined this multi-year distribution. Key support levels were breached and retested as resistance — a classic bearish shift in structure.
2022–2025 (Wave iii):
Clean, impulsive movement resumed. Breakouts, bullish flags, and retests marked key continuation zones. Market structure flipped back bullish with efficient rallies.
2025–2027 (Wave iv expected):
A retracement is likely toward previous demand zones , possibly aligning with wave 4 of the lower-degree impulse, respecting Elliott’s guideline of wave 4 often retracing to the territory of wave 4 of the previous degree.
2027–2029 (Wave v projection):
Anticipate price pushing into new highs, with potential overextension . However, bearish divergence and slowing momentum could foreshadow the macro top.
This structure shows how technical behavior mirrors emotional and fundamental phases — from greed to fear, and back again.
📆 Timeline Summary (2009–2029)
2009–2018:
Powerful multi-year impulse forms Cycle Wave i , ending in mid-2018.
2018–2022:
A deep, multi-legged ABC correction forms Cycle Wave ii , ending in mid-2022.
2022–2025:
Explosive impulsive rally forms Cycle Wave iii , currently completing around $1,576.42.
2025–2027 (Expected):
A corrective pullback forms Cycle Wave iv , likely more sideways or shallow in structure.
2027–2029 (Expected):
Final rally completes Cycle Wave v , with price targets between $2,280.37 and $3,008.41 , ending the macro Elliott structure.
🔚 Conclusion
With the cycle top revised to mid-2018 and the correction ending mid-2022 , the chart structure becomes even more aligned with classic Elliott Wave theory and Smart Money behavior.
Netflix’s long-term chart is a perfect confluence of:
Elliott Wave structure (impulse → correction → impulse),
Fibonacci precision,
Institutional manipulation (SMC), and
Clear price action behavior.
The roadmap to 2029 shows exciting bullish potential, but also highlights the need for caution near projected macro top zones — where institutional distribution may quietly unfold again.
📘 DISCLAIMER: This is a structural, educational market outlook. Not financial advice. Please do your own due diligence and risk management.
#Netflix, #NFLX, #Nasdaq #WaveTheory, #Fibonacci, #SmartMoney, #PriceAction