ZRO Weakness Into 4H FVG — Watching for Reversal Toward $1.50ZRO / USDT is showing weakness and continues to decline toward the 4H FVG zone at $1.24–$1.21. This area will be important to watch for a potential reaction. If price shows strength from this FVG, a reversal toward $1.50 can follow. Manage risk wisely and wait for confirmation.
Weakness

AI Stocks Started Sneezing… and Indices May Have Caught a Chill?The NASDAQ (a.k.a. the AI theme park) just printed a much lower monthly low.
ES? It dipped… but only politely.
That mismatch matters. When tech acts tired, the broader market usually needs caffeine — or a correction.
The Indicators Are Whispering… and They Don’t Sound Bullish
The CCI is saying “lower highs,” while price is saying “higher highs.”
Classic divergence.
The MACD histogram is fading like holiday lights at 4 a.m.
Momentum? Not dead — just yawning.
Three Levels That Could Decide Whether Santa Shows Up
Think of December like a video game boss fight with three phases:
6,525.00 → First alarm bell. Break it and the mood changes.
6,239.50 → “Bear trap danger zone.” Plenty could happen here.
4,430.50 → The deep level nobody wants to talk about, but everyone should mark.
If ES finds its footing near 6,239.50, Santa still has a shot.
If not… well… Grinch season might come early.
ES & MES Contract Specs + Margins
E-mini S&P 500 Futures (ES)
Tick size: 0.25 index points = $12.50
Approx. margin (as of now): ~$22,400 per contract
Micro E-mini S&P 500 Futures (MES)
Tick size: 0.25 index points = $1.25
Approx. margin (as of now): ~$2,240 per contract
Margins vary by broker and can change with volatility, but these figures reflect current exchange-level requirements.
Risk Management: The Only Real Holiday Magic
ES and MES give traders the same view of the market but with different intensity levels.
December is emotional, fast, and occasionally rude — so size positions like someone who wants to enjoy the holidays, not stress through them.
Pick a zone → define the invalidation level → cap your dollar risk → choose ES or MES accordingly.
Simple. Calm. Holiday-friendly.
Final Thought
Santa hasn’t canceled the rally yet. But AI stocks aren’t exactly singing Christmas carols either.
If the tech giants recover, December could still sparkle.
If they don’t… the sleigh might need a repair shop.
Either way: chart levels > seasonal hope.
Trade safe — and maybe hide a cookie for the market, just in case.
Want More Depth?
If you’d like to go deeper into the building blocks of trading, check out our From Mystery to Mastery trilogy, three cornerstone articles that complement this one:
🔗 From Mystery to Mastery: Trading Essentials
🔗 From Mystery to Mastery: Futures Explained
🔗 From Mystery to Mastery: Options Explained
When charting futures, the data provided could be delayed. Traders working with the ticker symbols discussed in this idea may prefer to use CME Group real-time data plan on TradingView: www.tradingview.com - This consideration is particularly important for shorter-term traders, whereas it may be less critical for those focused on longer-term trading strategies.
General Disclaimer:
The trade ideas presented herein are solely for illustrative purposes forming a part of a case study intended to demonstrate key principles in risk management within the context of the specific market scenarios discussed. These ideas are not to be interpreted as investment recommendations or financial advice. They do not endorse or promote any specific trading strategies, financial products, or services. The information provided is based on data believed to be reliable; however, its accuracy or completeness cannot be guaranteed. Trading in financial markets involves risks, including the potential loss of principal. Each individual should conduct their own research and consult with professional financial advisors before making any investment decisions. The author or publisher of this content bears no responsibility for any actions taken based on the information provided or for any resultant financial or other losses.

AI Stocks Weakness Could Spoil this Year’s Santa RallyAs December begins, traders worldwide are dusting off the same old question: Will we get a Santa Claus rally this year?
But 2025’s setup looks a little different. The market’s cheer seems to depend heavily on whether AI-related stocks can keep delivering miracles—and lately, the charts are suggesting they may be running out of steam.
When Tech Sneezes, the Market Catches a Cold
A quick look across U.S. equity futures shows a revealing pattern.
The E-mini NASDAQ 100 Futures (NQ), home to most AI and semiconductor giants, has posted a significantly lower monthly low compared to the prior month.
Meanwhile, the E-mini S&P 500 Futures (ES) declined much less, hinting at relative resilience, but also possible lagging weakness.
This divergence—NQ leading down while ES holds up—is a subtle warning. When the market’s growth engine (tech) loses traction, broader indices often follow with a delay. That’s the tension December traders are staring at: are we seeing the early signs of exhaustion before the holidays, or just a healthy pause?
Bearish Divergences Whisper “Caution”
The technicals are backing that cautious tone.
On the ES chart, the Commodity Channel Index (CCI) has been carving lower highs even as prices printed higher highs. This is a textbook bearish divergence, often an early sign that bullish momentum is fading.
The MACD histogram echoes the same message: momentum has been contracting through November despite new price highs, suggesting that underlying strength is eroding. Such divergences don’t predict direction on their own, but they do raise the probability of a short-term correction—or at least a choppy path into year-end.
The Price Map: Three Levels that Could Define December
Let’s outline the key technical zones traders are watching:
6,525.00: the prior monthly low—this is the first line of defense for the Santa Rally narrative. A break below this level would likely shift sentiment fast, especially if NQ continues under pressure.
6,239.50: the floor of a relevant UFO (UnFilled Orders) support zone. If ES dips below the prior low, this zone may become a “bear trap.” Many traders might short aggressively once 6,525.00 gives way, but those unfilled buy orders could absorb supply and trigger a sharp bounce. If the rally emerges from here, Santa might still make his visit.
4,430.50: a deeper UFO support cluster roughly 35% below current prices. If price were to cut through 6,239.50 and stay below it, the market would be entering a different regime altogether—likely accompanied by broken trendlines, volatility spikes, and a more defensive tone.
Reading Between the Lines: What the Divergence Means
Historically, the Santa Rally is powered by optimism, lighter volumes, and portfolio rebalancing. But this time, AI and semiconductor names—the champions of the current bull leg—are leading weakness.
That doesn’t mean doom; it means fragility.
The ES market may still rebound, but it’s doing so under reduced participation from the very sectors that drove prior gains.
Sizing the Trade Without Crossing the Line
For traders eyeing this setup through ES (E-mini S&P 500 futures) or MES (Micro E-mini S&P 500) futures, here’s a compliant, educational way to think about risk and position sizing:
Identify the Setup Zone: e.g., around 6,525.00 as potential demand, or below 6,239.50 as short-term breakdown.
Define Your Stop: the level where the technical picture is invalidated.
Set a Dollar Risk Limit: for instance, risking 1% of total account equity.
Derive Position Size: Divide your dollar risk by the price distance between entry and stop (converted into points). Then choose between the standard E-mini (ES) or Micro E-mini (MES) to match your risk tolerance and account size.
This framework lets traders adapt leverage responsibly—without needing the specific contract specs or margin figures, which vary by broker and time.
Risk Management: December Can Be a Trap
December is famous for emotional trading. The combination of holiday expectations, thinner liquidity, and year-end positioning can turn routine pullbacks into exaggerated moves.
That’s why focusing on risk before reward is critical.
The UFO support levels serve as reference zones where institutional activity might reappear, but they’re not guarantees. Managing stops, scaling out partial profits, and staying flexible matters more than trying to guess the market’s next headline.
ES and MES: Same Story, Different Scale
The Micro E-mini (MES) contract is a smaller version of the E-mini (ES), designed for traders who want the same price exposure but with lower notional size.
Both track the same index, tick for tick.
For traders exploring this December setup, the MES allows participation while controlling exposure more granularly—especially useful if volatility picks up and margin requirements shift.
Key Contracts Specs and Margins:
E-mini S&P 500 Futures (ES) with a point value = $50 per point.
Micro E-mini S&P 500 Futures (MES) with a point value = $5 per point.
As of the current date, the margin requirements for E-mini S&P 500 Futures and for the Micro E-mini S&P 500 Futures are approximately $22,400 and $2,240 per contract respectively.
Always verify the latest margin schedules and specifications directly with your broker or the exchange before entering trades, as those details update regularly and depend on market conditions.
Santa’s Setup: Scenarios to Watch
Scenario A — Santa Delivers: Price tests or slightly breaks the 6,525.00 low, finds support near 6,239.5, and rebounds into late December. Bearish divergences resolve sideways, and risk assets stabilize.
Scenario B — The Grinch Arrives: The 6,239.50 zone fails to hold, breaking trendline supports. The market slides toward 4,430.50, shaking off complacent longs and erasing part of the 2024-5 rally.
Both paths are technically valid. The difference will come from whether AI-heavy sectors regain strength—or confirm that this bull leg has indeed lost its engine.
Educational Takeaway
Divergences (CCI and MACD) highlight when momentum and price disagree—a sign of fatigue.
Intermarket analysis (ES vs. NQ) reveals where weakness may originate.
UFO levels identify potential institutional footprints—where traps or reversals often occur.
Discipline and risk control matter more than predicting whether Santa shows up.
Final Thought
Whether December brings gifts or grief may depend less on seasonal hope and more on how traders interpret these divergences.
If AI stocks can find footing again, the rally could revive. But if they keep sliding, this might be the year Santa takes a break.
When charting futures, the data provided could be delayed. Traders working with the ticker symbols discussed in this idea may prefer to use CME Group real-time data plan on TradingView: www.tradingview.com - This consideration is particularly important for shorter-term traders, whereas it may be less critical for those focused on longer-term trading strategies.
General Disclaimer:
The trade ideas presented herein are solely for illustrative purposes forming a part of a case study intended to demonstrate key principles in risk management within the context of the specific market scenarios discussed. These ideas are not to be interpreted as investment recommendations or financial advice. They do not endorse or promote any specific trading strategies, financial products, or services. The information provided is based on data believed to be reliable; however, its accuracy or completeness cannot be guaranteed. Trading in financial markets involves risks, including the potential loss of principal. Each individual should conduct their own research and consult with professional financial advisors before making any investment decisions. The author or publisher of this content bears no responsibility for any actions taken based on the information provided or for any resultant financial or other losses.

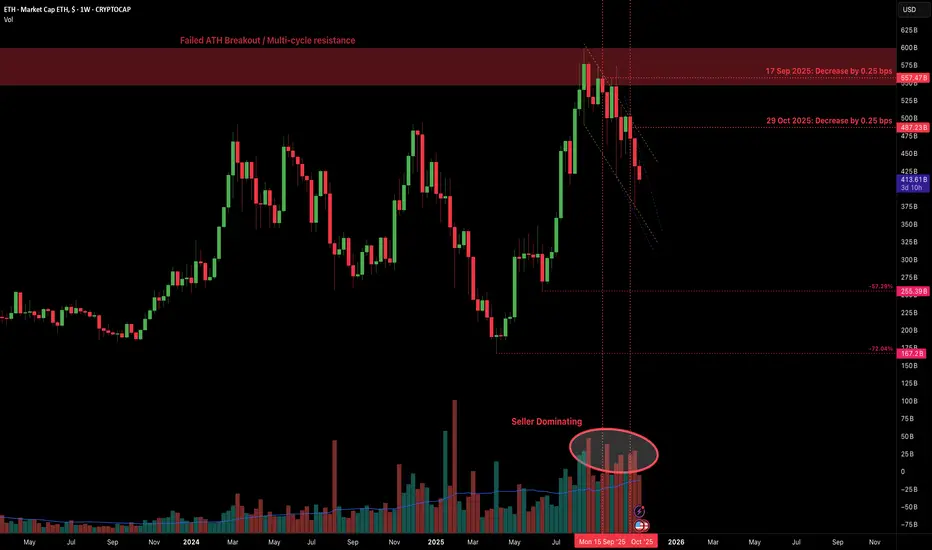
ETH Strong Selling Domination Since August 2025, we have:
- Almost 9 red weeks vs 3 green.
- Sellers dominate in number of red weeks + selling volume substantially.
- Absence of buybacks.
- Absence of good news for ETH specifically.
Recently over pumped ETH in 2025 has already erased all of its gains. Given its beta of ±2.0 to BTC, it is reasonable to expect further descent towards marked levels on the chart throughout 2026.
Major factor of influence right now is Fed rate cutting rates + absence of stable release of market data + weakening labor market. For your convenience, dates of the last two rate cuts have been marked to illustrate that ETH is indeed staying below those key market decision dates. The BTC weakness started much earlier, meaning that ETH is under much bigger pressure potentially signalling the end of its bull run phase in Autumn 2025. This is natural tendency to see as ETH always absorbs liquidity from BTC after crypto gold starts to weaken.
Not a financial advice.
Strength of Movement: A Hidden Gem for Trend Traders📌 What Is It?
Have you ever struggled to determine whether a price move has real strength behind it? The Strength of Movement indicator might be the tool you're missing.
The Strength of Movement (SoM) indicator by RedK is designed to measure the momentum and conviction behind price movements. Unlike traditional momentum indicators like RSI or MACD, SoM focuses on the strength of directional moves, helping traders identify when a trend is gaining or losing steam.
This post will explore the features, configuration, and practical applications of this indicator.
🔍 What is the RedK Strength of Movement Indicator?
The RedK Strength of Movement indicator is designed to measure the strength of price movement and show when a quality trend has been established. It uses a simple mathematical concept to identify opportunities for long call or put positions.
📈 What kind of indicator is it?
The Strength of Movement indicator falls into the category of momentum indicators. Momentum indicators are used to measure the speed and strength of price movements.
⏳ Is it Leading or Lagging?
The RedK Strength of Movement indicator is primarily a leading indicator. It can act as a leading indicator for an imminent change in trend direction by exposing the relative movement or change of price.
⭐ Key Features
Strength Circles: These circles indicate that the top or bottom has not been reached yet, providing valuable insights into market momentum.
Measures the strength of price movement.
Identifies quality trends.
Helps filter out low-momentum conditions.
💡 Benefits Compared to other indicators
Provides clearer signals for trend identification.
Acts as a leading indicator for trend changes.
Helps avoid low-momentum conditions.
⚙️ Indicator Configuration
Timeframe Source: The indicator works on any timeframe, but higher timeframes (e.g., daily, weekly) are recommended for identifying high-quality trend setups.
Range Source: The calculation is based on the relative price change (as a ratio) from the previous bar, rather than absolute values. This makes it more intuitive and accurate for traders.
SoM Calculation Type: The core logic uses a modified `stoch()` function to normalize the strength of movement between 0% and 100%.
Smoothing Adjustments: In version 2, the calculation was refined to avoid visual confusion—especially on Renko or non-time-based charts—by adjusting how the lowest and highest values are interpreted.
📈 Enhancing Signal Accuracy with a Trend Indicator
To enhance the accuracy of signals generated by the RedK Strength of Movement indicator, it can be used in conjunction with trend indicators such as:
Moving Averages: Simple Moving Average (SMA) and Exponential Moving Average (EMA) are widely used to identify trend direction.
MACD: Moving Average Convergence Divergence helps reveal both direction and underlying momentum.
Combining these tools helps confirm signals and reduce false positives.
🔄 Alternatives
While the RedK Strength of Movement indicator is powerful, there are other alternatives that also focus on momentum and trend identification:
RSI: Relative Strength Index measures the speed and change of price movements.
Stochastic Oscillator: Measures the level of the closing price relative to the range of prices over a certain period.
💡 Practical Tips
Combine with Trend Indicators: Use the RedK Strength of Movement indicator alongside trend indicators to confirm signals.
Monitor Strength Circles: Pay close attention to the strength circles for insights into market momentum.
Backtest Thoroughly: Before using the indicator in live trading, backtest it on historical data to understand its performance and adjust settings accordingly.
📈 Which Securities Does This Apply For?
The RedK Strength of Movement indicator can be applied to a wide range of securities, including:
Stocks: Useful for identifying quality trends in individual stocks.
ETFs: Effective for analyzing exchange-traded funds.
Forex: Valuable for currency pairs, helping traders identify market cycles and potential reversals.
Commodities: Applicable to commodities like gold, oil, and agricultural products.
Cryptocurrencies: Can be used to analyze digital assets, providing insights into market momentum.
📌 Conclusion
The RedK Strength of Movement indicator is a powerful tool for traders looking to enhance their technical analysis. By measuring the strength of price movement and identifying quality trends, it provides clearer and more accurate signals, helping traders navigate complex market cycles.

Apple chart September 2024Apple is showing a weaker RSI in the last move-up. The new iphone release and AI features makes investors expect a boost on sales, but maybe it will not happen at all. A drop between 10 and 20% could happen.
Same concerns for magnificent7 stocks.

Weakening Patterns: NVDANASDAQ:NVDA is over-speculated on the short-term and intermediate-term trends. It has minimal support nearby for holding for a position trade.
Without retail groups or smaller funds, the price action is weakening at this time. Nvidia doesn't report until May 22 which is very late in the season but for now, it has some minor rotation going on.
If it continues to hold above the black line, then it can pattern out the excessive price gains. This is not a strong sell short opportunity, but it is important to keep an eye on this stock for the next couple of weeks.

NVAX- a medical penny stock Buy Weakness LONGNVAX on a 120 minute chart demonstrates a trend down in the past month after a period of
consolidation producing the POC line on the volume profile. The MACD shows some bullish
divergence. The volume profile has high volume nodes at 4.0 and 5.0 separated by a relative
volume void. NVAX fell quickly through that void. It can just as easily rise through it. See the
linked article on NVA from TipRanks. Options volume and pricing analysis is that bets are looking
at5.0 diligently. Fundamentally, NVAX has been range limited by its focus on COVID but it does
have other projects in its pipeline admittedly on various timelines with varying probabilities
of capitalizing on them depending on clinical trials FDA approvals and so on. On the imbedded
relative strength table as compared with SPY and peers in the pharmaceutical, biotechnology,
medical device and healthcare spaces NVAX compares favorably with MRNA its closest peer
but is weak compared with most of the others I have selected especially with LLY, which is
high-flying from its anti-obesity drug breakout. Device companies Stryker and Intuitive Surgical
are quite strong as well. United Healthcare is dominant in the insurance subsector and strong
overall.
One often effective strategy is to buy when an instrument is oversold and undervalued at a
discount. I will buy NVAX here no matter that I have insider connections with one of those
medical device companies and a few not on the list. Sentiment only goes
so far. I found the article compelling and so Novavax long I go. On a trading site left unsaid
my screenname is "Bottom Feeding Grinder". I have an appetite for NVAX found at the bottom
right now. This is a reversal/reversion to the mean long trade. It is not without risk. As a
penny stock with high volumes, low cost of entry and perhaps low floats, volatility is
underscored and exaggerated if a volume inflow gets underway That said, a short squeeze
is within the spectrum of possibilities. Enough said for now.

AUD weaknessAUD has been weak across the board and is giving potential opportunities to go short. In AUDCAD the Daily bias is bearish and could continue lower. The D chart presented us with a SWH with its 3rd candle lows being breached by today's price action. Ideally in the 1H, the chart will set itself up either in London (2am) or NY session (7am-9am) for a short after a possible run into liquidity stablished by highs of Feb 1st Asian session, which is standing right in the zone of the 0.618 and .786fib. This could be sell opportunity targeting Feb 1st lows.

SPY overview - Jan 19Yesterday after gapping up, the market tested the Jan-17 High/Close. Then broke through 8EMA and closed strong.
Now the nearest support level is the short-term moving average - 8EMA.
The nearest resistance levels are now at 478.60, together with TRL.
It's important to note that yesterday's move was driven by strength in the semiconductor sector as well as the leadership of megacaps.
The big question for me now is which other groups of stocks the cash will flow into and whether it will flow anywhere else besides megacaps.

TSLA is relatively weak with Selling Volume pressure I think there is more downside to TSLA, Right now the relative weakness may put it out of favor for the next few session.
Keep an eye for volume divergence and GREEN to enter log for a retrace/scalp or stay short until Trapzone is RED !

BankNifty futures may test the Support areaFutures seems to have broken the resistance, but is seeing selling at the moment. So I belive we will see and test the Support now.

ATOM'S Descending Channel with a Fakeout 📉🔄📈ATOM, currently traversing a descending parallel channel, recently executed a fakeout above the channel's upper boundary. This strategic move has set the stage for a nuanced analysis and potential trading opportunities.
Key Technical Observations:
Descending Parallel Channel:
ATOM's price movements have been encapsulated within a well-defined descending parallel channel.
The lower and upper boundaries of this channel have played a pivotal role in guiding recent price action.
Fakeout Dynamics:
The recent fakeout above the upper boundary of the channel is a noteworthy event, signifying a temporary breach of the descending structure.
Fakeouts often provide valuable insights into potential shifts in market sentiment.
Detailed Analysis:
Channel Fakeout and Maximal Retest:
The fakeout event above the upper boundary of the channel suggests a temporary breach of the prevailing descending structure.
Subsequent to the fakeout, a retest of the daily maximum has further reinforced the potential strength of the downside.
Strategic Entry Points:
Traders may find opportune entry points around the expected retest zone of 8-8.4$.
Initiating short positions in this region aligns with the prevailing descending channel and the implications of the recent fakeout.
Anticipated Price Movements:
Retest and Potential Upside:
An anticipated retest of the 8-8.4$ zone could serve as a strategic entry point for short positions.
Following this, a bearish scenario could unfold, potentially leading to a decline in price.
Longer-Term Targets:
With the short-term bearish outlook, traders might strategically plan for a subsequent rise to the 15$ level.
It's essential to reassess market dynamics and consider the potential for trend reversals during this phase.
Conclusion: Tactical Maneuvers in a Descending Channel
ATOM's recent fakeout above the descending channel's upper boundary presents traders with a tactical opportunity. The expected retest zone becomes a crucial area for strategic entries, aligning with the broader descending structure. While short-term bearishness is anticipated, longer-term targets suggest potential upside movements.
📉 Descending Channel Dynamics | 🔄 Fakeout Strategies | 📈 Strategic Entry Points
💬 Share your insights on ATOM's recent fakeout and your approach to navigating its current technical landscape! 🌐✨

Major downtrend that holds good supportCan we break this downtrend or will we see a continuation on it. Lets wait and see, be patient. I think that the dollar is quite weak at this point and that we can see it fall further down, but first i think it can come to test the major downwards trendline before it weakens. At this point we have a good support at the fib level 0.618

DOGE: How Manipulation's Will Help To Pump?🐕Dogecoin (DOGE) has long been a favorite of traders and meme enthusiasts, and it seems like there's more to this coin than meets the eye. Beneath the playful exterior lies a substantial amount of liquidity, which could be a key ingredient for a genuine pump. But when will it happen? Let's explore the potential scenarios for DOGE. 📈🚀
The Abundance of Liquidity:
DOGE has consistently proven to be a coin with substantial liquidity. It means there are plenty of buy and sell orders stacked at various price levels, ready to be triggered.
The 0.5 Fibonacci Level:
Many traders are keeping a close eye on the 0.5 Fibonacci level as a potential trigger point for DOGE. If the price drops to this level and reclaims it, it could signify a significant imbalance correction.
The Entry and Target:
For those looking to capitalize on a potential pump, an entry point around 0.027 could be a strategic choice. As for the target, 0.8 could be a lucrative goal if DOGE starts a substantial upward move.
Trading Strategy:
Timing is Key: Watch for DOGE to dip to the 0.5 Fibonacci level and reestablish itself.
Entry and Target: Consider entering around 0.027 and set a target of 0.8, but remain flexible based on price action.
Risk Management: Use stop-loss orders and sound risk management to protect your investments.
Conclusion:
DOGE might be known for its fun and memes, but it has demonstrated a hidden potential for a substantial pump. Liquidity-rich assets often have the capacity to make sudden and significant moves.
As you keep a close watch on DOGE's journey, remember that the crypto market is full of surprises. Stay informed, trade wisely, and may your trades lead to success.
❗️Get my 3 crypto trading indicators for FREE!
Link below🔑

NVIDIA Short sell ideaNASDAQ:NVDA is looking weak as per my analysis as the price shows a potential bearish H&S pattern with multiple confirmations. Weekly candles is heavily rejected from the 50 moving average and Daily EMAs have finally closed below all 50, 100 and 200 DMA. On top of this RSI shows momentum weakness which solidifies my short trade idea for $NASDAQ:NVDA. Would like to initiate shorts below ~$405 and target of ~$378 and ~$323 in the upcoming quarter

Gold 1D Analysis , Bears comingHello friends.
I saw a three top pattern in 1D chart and a bearish divergence included too.
after the 3rd time price touch 2050 Resistance level , we can see in picture below ,
Buyers couldnt lead price upper and Sellers came in strongly.
So , as you can see in Zoomed Chart , we have a Bearish Engulfing pattern there and
in the main chart , we see a decrease in RSI tops but 3 tops placed in a line.
this means the Trend will weak and the price will Drop.
I think our Swing targets are 1958 (Former Bottom)
and 1933(EMA 50).
Thank you for reading my IDEA.
PLZ share me your opinion.
Have good trades.
<<< LEARN first , then Omit L & EARN >>>

NZDUSD - A Deep Pullback Or A Breakout?Analysis:
We took a trade on this pair the other day but we ended up getting stopped out due to the bearish news that came out for the USD however we're going to take another shot at NZDUSD. We are still bearish on this pair because we're still in a downwards trend. We haven't formed a higher high yet which confirms that we're still in a downwards trend. Price has pulled back a fair bit but we see this as a deep retracement and a great shorting opportunity. We're currently at a key level which has held multiple times so we expect it to hold again. For more confluence at our area we also have the 61.8% fib retracement level which is often seen as the strongest fib level so we have more confidence that this level will hold and that this is where the bears will take back control. Another confluence factor that we have is the downwards trendline. This trendline has held multiple times before, causing huge rejections so we expect that this will happen again which is a positive for this setup. Fundamentally the USD is the 2nd strongest major currency whereas the NZD is the 4th strongest major currency so this goes in our favour to be on the short side of NZDUSD. For more fundamental confluence we have an increase in both long and short positions on the USD by institutions which is pretty neutral whereas for the NZD we didn't really have an increase in long positions but we did see an increase in short positions by institutions so this is yet another confluence on why we want to be shorting this pair. We have had some bearish news come out recently for the USD however on Wednesday when Fed Powell testifies we could see some bullishness coming back to the USD. If the market gets any reasons to go long on the USD then we would see this pair drop and with all of the technicals and fundamental analysis we've done we think that we'll see the bulls step back in on the USD which is why we are currently bearish on NZDUSD despite the current market conditions.
Please feel free to leave any comments you have and like this idea if you agree with us. Any feedback or comments will be read. We appreciate it all.
Stay Safe - JPI
Disclaimer:
This does not constitute as financial advise. We are not responsible for any monetary loss that you endure. Trading is hard to be profitable with and we take losses just like everyone else does to. Our ideas won't always be correct which is why we urge you to always do your own analysis first before entering into the market but please feel free to use our analysis to assist you with yours.

NZDCHF - Continuation To The Downside!Analysis:
This setup to us is ideal. Firstly price is clearly in a downwards trend and there is no doubt about this. We've seen price create a series of lower lows and lower highs which confirms that we are in a downwards trend. Knowing this we are only looking for shorts on this pair. Where price is currently is a very interesting area to us. Why? This area has held as major support in the past and as support recently so we now expect that it will hold as resistance. If you've been trading long enough you'll know that very often support can turn to resistance and resistance can turn into support. For more confluence at this area we have the 50% fib retracement level which we expect sellers will be sat at waiting before pushing price down further. We've also got an downwards trendline which has been beautifully respected multiple time showing us the bullish pressure and momentum on this pair. Fundamentally as well we're pretty neutral. Both the NZD and the CHF have almost the same long to short ratio so there isn't any real bias here until we dig a little further and we can see that the NZD only really had an increase in short positions by institutions whereas the CHF has an increase in both long and short positions by institutions so we actually have a slight bias to the bullish side of the CHF which goes with our idea and wraps up why we are bearish on this pair.
Please feel free to leave any comments you have and like this idea if you agree with us. Any feedback or comments will be read. We appreciate it all.
Stay Safe - JPI
Disclaimer:
This does not constitute as financial advise. We are not responsible for any monetary loss that you endure. Trading is hard to be profitable with and we take losses just like everyone else does to. Our ideas won't always be correct which is why we urge you to always do your own analysis first before entering into the market but please feel free to use our analysis to assist you with yours.

EURCHF - EUR Losing It's Strength?Analysis:
As we can see from price action we're in a longer term downwards trend, as shown by the downwards trendline and in recent times we've also been trending to the downside so only shorts look good to us as we want to be going with the trend rather then fighting against it. At this area we've got a major level which has held as both support and resistance in the past and we expect that it will hold again now. To add more confluence to this setup at our area we also have both the 50% fib retracement level and the 61.8% fib retracement level which both could act as levels of resistance as we expect that sellers will be sat at both of these levels. We're also in what's often called the "golden zone" which is the area between the 50% and 61.8% so this is looking like a nice place to enter from. Another confluence we have to enter at this level is the longer term downwards trendline which is clearly visible. Its been respected multiple times in the past and every time this trendline has been touched we've seen a big drop in price so we expect that this will happen again if we get a touch of the trendline, so this goes in our favour. Now fundamentally the EUR is the strongest major currency compared to the CHF which is the 5th strongest major currency. Whilst this doesn't go in our favour this isn't the full picture. As of the most recent report we saw an increase of about the same for long and short positions on the CHF. This isn't a positive but this also isn't a negative, it's just neutral whereas for the EUR we saw a big decrease in long positions and an increase in short positions so this isn't looking good for the EUR and this could be early signs that the EUR is starting to lose some of its strength. This is why currently when comparing the EUR to the CHF fundamentally we actually prefer being bullish on the CHF, giving us our bearish bias for this pair.
Please feel free to leave any comments you have and like this idea if you agree with us. Any feedback or comments will be read. We appreciate it all.
Stay Safe - JPI
Disclaimer:
This does not constitute as financial advise. We are not responsible for any monetary loss that you endure. Trading is hard to be profitable with and we take losses just like everyone else does to. Our ideas won't always be correct which is why we urge you to always do your own analysis first before entering into the market but please feel free to use our analysis to assist you with yours.

AUDCAD - Bullish CAD On The Horizon?Analysis:
Looking at price action we can see that price is in a downwards trend. We're seeing lower lows and lower highs being formed which confirms that we're in a downwards trend, so we're only looking for shorting opportunities. Price has made a deep pullback to the current lower high and we did put in a new lower low so this is looking like a great place to enter. At this level we also can see that it has been tested multiple times and we can see big rejections from this area showing that there is a lot of pressure at this level so it's more likely to hold and continue to the downside rather then it breaking and heading to the upside, especially when we add the fact that we're also in a downwards trend. We don't have any other added confluences for this trade, however the technicals are still valid for our strategy. Fundamentally the AUD is 3rd weakest major currency whereas the CAD is the 2nd weakest currency so this doesn't go in our favour but this isn't the full picture. Recently we saw a huge decrease in long positions on the CAD and the AUD, but we saw a small decrease in short positions on the AUD whereas we saw a huge decrease in short positions on the CAD. Basically meaning that more short positions were closed on the CAD then the AUD signifying that there might be an end coming to the bearishness for the CAD. With our speculation on oil prices rising which is heavily correlated to the CAD we can see some strong bullish momentum on the horizon for the CAD which is why fundamentally we prefer the CAD over the AUD. With all of the technicals and fundamentals combined together we get a bearish outlook on this pair.
Please feel free to leave any comments you have and like this idea if you agree with us. Any feedback or comments will be read. We appreciate it all.
Stay Safe - JPI
Disclaimer:
This does not constitute as financial advise. We are not responsible for any monetary loss that you endure. Trading is hard to be profitable with and we take losses just like everyone else does to. Our ideas won't always be correct which is why we urge you to always do your own analysis first before entering into the market but please feel free to use our analysis to assist you with yours.

NZDCAD - Oil Price On The Rise, Could Mean A Bullish CAD!Analysis:
Firstly just by looking at the charts we're able to tell that price is in a downwards trend. We've seen a series of lower lows and lower highs being formed confirming that we are in this downwards trend. We're now approaching a key level that has held as support and resistance multiple times so we expect this to happen again this time around. To add confluence to our area price is about to touch the 50% fib retracement level which we expect sellers to be sat at wanting and willing to enter into short positions pushing price down further. For more added confluence even though our trendline isn't at the area we're interested in it is still key as it shows that price is respecting this downwards trend that we're in, signifying that price is likely to hold the level we're at currently. Fundamentally the NZD is the 4th strongest major currency where as the CAD is the 2nd weakest major currency. This fundamentally really doesn't look good for our setup however if we dig a little deeper we'll see why we actually favour the CAD over the NZD. We have a speculation that oil prices will soon be on the rise again. Now why does this matter? Well Canada is the 4th largest oil distributer in the world meaning that the CAD is very often correlated to oil prices. If we see oil prices rise then so will the CAD. With our speculation on oil it starts to show early signs of a bullish CAD which is why we are bearish on NZDCAD both technically and fundamentally as well.
Please feel free to leave any comments you have and like this idea if you agree with us. Any feedback or comments will be read. We appreciate it all.
Stay Safe - JPI
Disclaimer:
This does not constitute as financial advise. We are not responsible for any monetary loss that you endure. Trading is hard to be profitable with and we take losses just like everyone else does to. Our ideas won't always be correct which is why we urge you to always do your own analysis first before entering into the market but please feel free to use our analysis to assist you with yours.

EURGBP - More Bearish Pressure To Come?Analysis:
Price was stuck in an area of consolidation for a while but we've seen that area be broken and price has made a substantial move to the downside indicating to us that we are only interested in shorting this pair. We're currently at an area of previous major support and we expect that this level will now hold as resistance and price will continue its move to the downside. For added confluence we also have a downwards trendline that has been respected multiple times showing us that the bears are in control of this market. So with this trend line lining up with our area of resistance there is a good chance that we will see price continue its move to the downside. Fundamentally the EUR is the strongest major currency whereas the GBP is the 3rd strongest major currency. Although this doesn't go in our favour this isn't the full picture. For many weeks now we've seen the GBP gain more and more strength and we expect this to continue whereas we're seeing institutions closing their long positions on the EUR. So although currently the EUR is stronger then the GBP we can see this changing in the future which is why we are bearish on this pair.
Please feel free to leave any comments you have and like this idea if you agree with us. Any feedback or comments will be read. We appreciate it all.
Stay Safe - JPI
Disclaimer:
This does not constitute as financial advise. We are not responsible for any monetary loss that you endure. Trading is hard to be profitable with and we take losses just like everyone else does to. Our ideas won't always be correct which is why we urge you to always do your own analysis first before entering into the market but please feel free to use our analysis to assist you with yours.
