KFin Technologies — Weekly Chart ANALYSISStock is consolidating inside a symmetrical triangle near the apex.
Strong demand zone: ₹880 – ₹820.
As long as price stays above this zone, structure remains positive.
Bullish Trigger
Weekly close above ₹1,120 – ₹1,140
Possible upside levels → ₹1,220 → ₹1,320 → ₹1,420
Bearish Trigger
Breakdown below ₹980
Stock may retest ₹900 → ₹850 → ₹820
Bias
Mildly bullish while above ₹900–₹880
Wait for clear breakout / retest confirmation
Disclaimer
This is a technical analysis view for educational purposes only, not investment advice.
Weeklyview

Monthly + Weekly View
If Monthly Candle closes above 95, it would
confirm a Morning Star Formation which is a
Positive Sign.

bank nifty next weekBANKNIFTY STRONG AT 34650 AND WEEK 33400
this is my view before trade must do your analysis

AMAT Trending UpwardAMAT is trending upward shown in the weekly chart view, after dropping to the 50% value loss level. This is a common area for a bottom formation to commence.

NTAP Head & Shoulders Top Gaps DownNTAP on the Weekly View chart shows a traditional Head & Shoulders Topping Formation. This type of top is far less common these days. This is due to changes in Dark Pool transaction activity off the public exchanges, new routing, and new order types. The gap down is above the traditional Head & Shoulders completion level. However, there is some technical evidence that this could be the conclusion and completion level for this top at this time.


eurusd long term analysis hello my friends .....
1.reversal pattern forming in long term analysis
2. expecting more move to the upside to complete the reversal pattern (move iv-v) then look for a sell to complete (Y)
3. supply zone + fibo level
4.down trend resistance
Trade successfully !!!

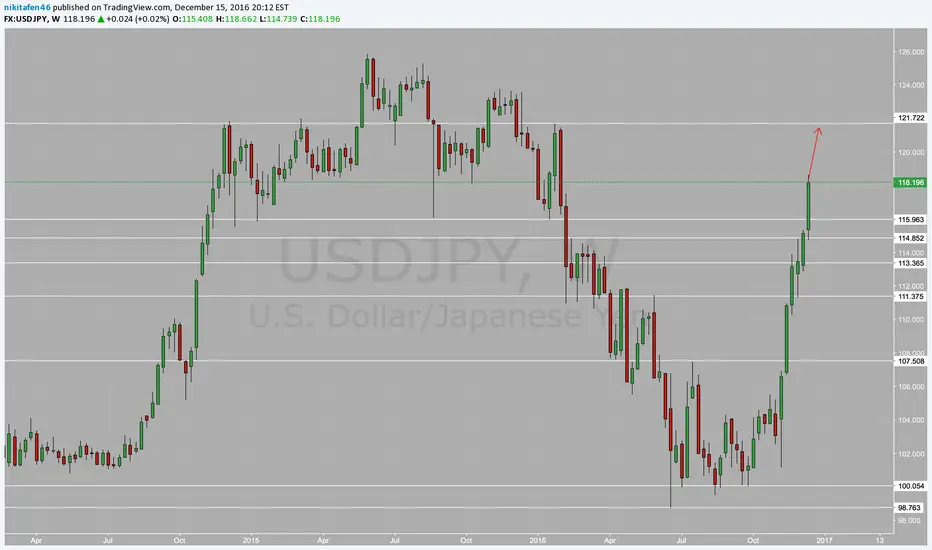
USDJPY BuyMajor resistance at 116 broken, and although it may be late for some traders, I would consider this a solid buy position, with a target of 121.50