Whale Watching 101: How to Use Exchange Inflow/Outflow DataIn the ocean of cryptocurrency, Retail Traders are the plankton, and Institutions are the Whales. When a Whale moves, the water displaces, and the plankton get pushed around. If you want to survive in 2026, you must stop swimming against the current and start tracking the Whales.
But how do you see them? They don't post their trades on Twitter. They leave On-Chain Footprints. The biggest footprint they leave is moving money in and out of Exchanges.
Today, we are mastering the most fundamental On-Chain metric: Exchange Netflow.
1. The Golden Rule of Flows
To understand this data, you must understand the psychology of a Whale. A Whale (holding 1,000+ BTC) does not keep their money on an exchange like Binance or Coinbase unless they are planning to do something.
Exchange INFLOW (The Bearish Signal)
The Logic: Why would a Whale move 5,000 BTC from a secure Cold Wallet (Ledger/Trezor) to an Exchange?
The Intent: They are likely preparing to SELL.
The Trading Signal: If you see a massive spike in "Exchange Inflow" while price is hitting a Resistance level, it is a massive warning sign. The Whales are loading their guns to dump on the retail breakout.
Exchange OUTFLOW (The Bullish Signal)
The Logic: Why would a Whale withdraw 5,000 BTC from an Exchange to a Cold Wallet?
The Intent: They have finished buying. They are removing the supply from the market to hold for the long term.
The Trading Signal: If price is dumping, but "Exchange Outflows" are hitting record highs, this is Accumulation. The Whales are buying the dip and removing the coins from circulation. This is how "Supply Shock" happens.
2. The Nuance: Stablecoins vs. Bitcoin
This is where 90% of rookie traders get it wrong. You must distinguish what is flowing in.
BTC Moving to Exchange = Sell Pressure (Bearish)
Interpretation: Supply is increasing.
Stablecoins (USDT/USDC) Moving to Exchange = Buy Power (Bullish)
Interpretation: This is "Dry Powder." When Whales move millions of USDT to an exchange, they are preparing to BUY the dip.
The "Ultimate Bull Signal": High BTC Outflows (Supply Shock) + High Stablecoin Inflows (Buying Power) = Parabolic Price Action.
3. Case Study: The "Fakeout" Trap
Let’s apply this to a real trading scenario.
The Scenario: Bitcoin is trading at $98,000. It looks bullish. Suddenly, a breakout occurs to $100,000. Retail traders start longing with 50x leverage.
The On-Chain Reality: You check the data. You see that 1 hour before the breakout, 10,000 BTC flowed INTO Coinbase Pro.
The Trade:
The Trap: The breakout is likely a "Bull Trap." The Whales moved that BTC to sell into the liquidity provided by the retail longs.
Your Move: Instead of longing the breakout, you Short the rejection, knowing that massive sell pressure is sitting on the order book.
4. Tools of the Trade
You cannot trade this without data. Here are the industry standards for 2026:
Glassnode: The gold standard for "Exchange Net Position Change" charts.
CryptoQuant: Excellent for real-time "Exchange Inflow" alerts.
Whale Alert (Twitter/X): Good for spotting individual massive transactions, but be careful—sometimes these are just internal transfers (exchange wallet to exchange wallet). Always verify if it is an actual inflow.
Conclusion: Context is King
Exchange flows are powerful, but they are not a crystal ball.
Low Volatility + Inflows = Preparing for a big move (likely down).
High Volatility + Inflows = Panic selling (Capitulation).
Use Fundamental Analysis to see Where the money is going, and Technical Analysis to time When to enter.
Stop guessing. Start tracking.
-Tuffycalls (Team Mubite)
Whales

XRPUSD - ETF Inflows Hit $1.2B But Whales Dumpingb]Executive Summary
BITSTAMP:XRPUSD is trading at approximately $1.92 after recovering from recent lows, currently testing the critical $1.95 resistance level. Despite the historic launch of US spot XRP ETFs accumulating $1.2 billion in assets with ZERO negative outflow days, the price remains under pressure. On-chain data reveals a troubling divergence: while retail piles into ETFs, whales have been systematically offloading holdings on exchanges. This analysis examines whether XRP can break through $1.95 resistance or if continued whale selling will push price toward the $1.50-$1.66 support zone.
NEUTRAL BIAS - Two Scenarios Presented
I'm presenting both bullish and bearish scenarios because the data is genuinely mixed. ETF inflows are historically bullish, but whale behavior is bearish. Let the market show its hand.
Current Market Context - December 21, 2025
XRP finds itself at a fascinating crossroads:
Price: $1.9249 (up 0.18% on the day)
Day's Range: $1.9014 - $1.9257
52-Week Range: $1.6106 - $3.662
Market Cap: $116.52 billion (battling BNB for #3 spot)
24h Trading Volume: $2.36 billion
Down 50% from July 2025 ATH of $3.65
The broader context:
Crypto market shed over $1.3 trillion since October
XRP down 30%+ over past three months
Fed hawkishness pressuring all risk assets
Yet XRP ETFs seeing unprecedented inflows
THE BIG STORY: ETF Success vs. Whale Dumping
Historic ETF Launch - $1.2 Billion in Assets
Canary Capital launched the first US spot XRP ETF, hitting nearly $250 million in volume on its first day - a RECORD for non-Ethereum altcoin ETFs. The numbers are impressive:
Total XRP ETF Assets: $1.2 billion
Net Inflows: $1 billion since launch
Canary XRP ETF: $335 million AUM (market leader)
21Shares: $250+ million
Grayscale: $220+ million
Bitwise and Franklin Templeton also participating
ZERO negative outflow days since debut
This should be massively bullish. With Bitcoin and Ethereum, ETF launches drove significant price appreciation. So why isn't XRP responding?
The Whale Problem - On-Chain Data Reveals the Truth
CryptoQuant analyst PelinayPA uncovered the issue: whales started offloading their holdings on exchanges as ETF expectations heightened. They provided the sell-side liquidity for retail investors buying the ETF launch news.
Key findings from Exchange Inflow data:
Majority of inflows coming from 100K-1M XRP and 1M+ XRP bands (whales)
After each major inflow spike, price forms lower highs and lower lows
Supply is overwhelming demand despite ETF buying
Whales not aggressively dumping, but continuous supply increase keeps pushing price lower
This explains why XRP faces selling pressure each time it approaches $1.95
CRITICAL: Exchange inflows would need to dry up first before XRP can see a sustained bullish run.
Technical Structure Analysis
Price Action Overview - 45 Minute Timeframe
The chart shows a clear pattern evolution:
Phase 1 - Descending Channel (Previous Weeks):
Price was trapped in a descending channel/wedge pattern
Lower highs and lower lows dominated
Breakdown from the channel led to capitulation
Phase 2 - V-Bottom Recovery:
Sharp selloff found support at major support zone
V-shaped recovery initiated
Price reclaimed lost ground quickly
Phase 3 - Ascending Channel (Current):
Price now trading within an ascending channel
Higher lows forming off the bottom
Currently testing upper resistance of the channel
Fair Value Gap (FVG) identified in the middle of the range
Decision point: breakout or rejection?
Key Support and Resistance Levels
Resistance Levels:
$1.95 - CRITICAL resistance (whale selling zone, repeated rejections)
$2.00 - Psychological round number resistance
$2.10-$2.15 - Secondary resistance zone
$2.50 - Major resistance / bullish target
$3.00 - Major psychological level
$3.65 - All-time high (July 2025)
Support Levels:
$1.90 - Immediate support (current price area)
$1.82-$1.87 - FIRST MAJOR SUPPORT ZONE (historical buying activity)
$1.77 - CRITICAL SUPPORT (large accumulation zone per Glassnode)
$1.66 - Secondary support
$1.50-$1.60 - Deep support if whale selling continues
$0.79 - Next meaningful support if $1.77 breaks (THIN LIQUIDITY between)
WARNING: Ali Martinez's Glassnode data shows a THIN LIQUIDITY ZONE below $1.77. If that level breaks, there's limited support until $0.79. This is a critical risk factor.
Chart Pattern Analysis
Current structure shows an ascending channel within a larger recovery:
Channel support: Rising trendline from recent lows
Channel resistance: Parallel line connecting recent highs
Price currently testing upper channel resistance near $1.95
Fair Value Gap (FVG) sits in the middle of the range - potential retest zone
Two clear scenarios: breakout above channel or rejection back to FVG/support
Fibonacci Analysis
Measuring from the July ATH ($3.65) to recent lows:
Current price ($1.92) represents approximately 47% decline from ATH
Key Fib levels to watch for recovery targets
0.382 retracement would target ~$2.50 area
0.5 retracement would target ~$2.70 area
Fundamental Analysis
Bullish Fundamentals
1. XRP ETF Ecosystem Thriving
$1.2 billion in assets - unprecedented for altcoin ETF
Zero negative outflow days
Multiple major issuers participating (Canary, 21Shares, Grayscale, Bitwise, Franklin Templeton)
Institutional infrastructure now established
2. Ripple Ecosystem Developments
XRPL Lending Protocol launching for institutions
Fixed-term, fixed-rate loans (30-180 days)
Secured by Single Asset Vaults
Validator voting expected late January 2026
Protocol-native credit markets coming to XRPL
3. Ripple Escrow System - Institutional Design
According to XRP investor Lord Belgrave, Ripple's escrow mechanism was deliberately structured for institutional deployment:
55 billion XRP locked in escrow contracts
1 billion XRP scheduled for release monthly
700-800 million typically re-locked
Only 200-300 million effectively released monthly
NDAs with institutions across Europe, Middle East, Asia
Discussions allegedly included central banks, IMF, BIS
NDAs may be nearing disclosure phase as systems move to active deployment
4. Banks May Favor Higher XRP Price
Finance expert Dr. Camila Stevenson argues:
Banks look at whether a system can handle stress and move large sums
XRP has fixed supply - price is the only way to support larger volumes
Banks moving billions prefer fewer units representing more value
Fewer tokens = simpler settlement, less slippage risk
Higher XRP price could support smoother transfers at scale
5. Market Cap Battle
XRP market cap: $116.36 billion
BNB market cap: $117.71 billion
Only $1.35 billion difference
XRP vying for #3 spot in crypto
Bearish Fundamentals
1. Whale Selling Pressure
100K-1M XRP and 1M+ XRP bands driving exchange inflows
Whales offloaded as ETF expectations heightened
Continuous supply increase overwhelming demand
Price forms lower highs after each inflow spike
$1.95 resistance repeatedly defended by sellers
2. Thin Liquidity Risk
Below $1.77, next meaningful support is $0.79
Limited accumulation between these levels
If $1.77 breaks, could see rapid decline
3. Analyst Skepticism on Altcoin ETFs
Markus Thielen (10x Research founder) predicts:
Most non-Bitcoin crypto ETFs unlikely to achieve lasting success
Institutional demand centers on Bitcoin
Bitcoin's "digital gold" narrative resonates with institutions
Altcoins like XRP lack compelling institutional narrative
4. Macro Headwinds
Crypto market shed $1.3 trillion since October
Fed projecting only two rate cuts for 2026
Risk-off sentiment persisting
XRP down 30%+ over three months
Analysts warn of potential cooling period in 2026
5. Price Performance Lagging
7-Day: -2.78%
1-Month: -12.91%
3-Month: -7.49%
Down 50% from ATH despite ETF success
ETF inflows not translating to price appreciation
SCENARIO ANALYSIS - NEUTRAL STANCE
BULLISH SCENARIO - Breakout Above $1.95
Trigger Conditions:
Daily close above $1.95 with volume confirmation
Exchange inflows from whales decrease significantly
ETF inflows continue/accelerate
Bitcoin stabilizes above $95,000
Break above ascending channel resistance
Price Targets if Bullish:
Target 1: $2.00 - Psychological level
Target 2: $2.15-$2.20 - Secondary resistance
Target 3: $2.50 - Major resistance / analyst target
Extended: $3.00+ if momentum sustains
Bullish Catalysts to Watch:
XRPL Lending Protocol validator voting (late January 2026)
Potential NDA disclosures from institutional partners
Continued ETF inflows
Altcoin season rotation (expected January 2026)
XRP flipping BNB for #3 market cap
BEARISH SCENARIO - Rejection at $1.95
Trigger Conditions:
Rejection candle at $1.95 with increased volume
Whale exchange inflows continue/increase
Break below ascending channel support
Bitcoin weakness below $90,000
ETF inflows slow significantly
Price Targets if Bearish:
Target 1: $1.82-$1.87 - First major support zone
Target 2: $1.77 - Critical support (Glassnode accumulation zone)
Target 3: $1.50-$1.66 - Deep support if whale selling persists
DANGER ZONE: Below $1.77 = thin liquidity to $0.79
Bearish Risks to Monitor:
Continued whale offloading on exchanges
ETF narrative failing to drive price
Broader crypto market weakness
Fed maintaining hawkish stance
Break of $1.77 critical support
Trade Framework
Bullish Trade Setup
Entry Conditions:
45-minute candle closes above $1.95 with volume
RSI breaks above 55
Ascending channel breakout confirmed
Trade Parameters:
Entry: $1.96-$2.00 on confirmed breakout
Stop Loss: $1.85 below recent support
Target 1: $2.15 (Risk-Reward ~1:1.5)
Target 2: $2.50 (Risk-Reward ~1:3.5)
Target 3: $3.00 (Extended)
Bearish Trade Setup
Entry Conditions:
Rejection candle at $1.95 with upper wick
Break below $1.87 support
Volume confirmation on breakdown
Trade Parameters:
Entry: $1.86-$1.87 on support break
Stop Loss: $1.96 above resistance
Target 1: $1.77 (Risk-Reward ~1:1)
Target 2: $1.60 (Risk-Reward ~1:2.7)
Target 3: $1.50 (Extended)
Range Trade Setup (If Consolidation Continues)
Parameters:
Buy Zone: $1.82-$1.87
Sell Zone: $1.93-$1.95
Stop Loss: $1.75 (below range)
This setup works while price remains in the ascending channel
Risk Management Guidelines
Position sizing: 2-3% max risk per trade
CRITICAL: Respect the $1.77 level - thin liquidity below
Watch whale exchange inflows via CryptoQuant
Monitor ETF flow data daily
Reduce exposure during holiday low-liquidity period
Use hard stops - whale selling can accelerate moves
Scale out at targets rather than all-or-nothing exits
Invalidation Levels
Bullish thesis invalidated if:
Price closes below $1.77 on daily timeframe
Whale exchange inflows spike significantly
ETF outflows begin (first negative day)
Bitcoin breaks below $88,000
Bearish thesis invalidated if:
Price closes above $2.00 with volume
Whale exchange inflows dry up
ETF inflows accelerate significantly
XRP flips BNB for #3 market cap
Conclusion
BITSTAMP:XRPUSD presents a genuinely mixed picture. The ETF success story ($1.2B in assets, zero outflow days) should be bullish, but whale behavior tells a different story. On-chain data shows large holders systematically offloading at the $1.95 resistance level, providing sell-side liquidity for retail ETF buyers.
The Key Question: Will ETF demand eventually overwhelm whale supply, or will whales continue to cap rallies?
Critical Levels:
$1.95 - THE level to watch. Break above = bullish, rejection = bearish
$1.77 - Must hold. Thin liquidity below to $0.79
$2.50 - Bullish target if breakout occurs
$1.50-$1.60 - Bearish target if whale selling continues
My Stance: NEUTRAL
I'm not calling a direction here. The data genuinely supports both scenarios. Let price action at $1.95 determine the next move. Trade the reaction, not the prediction.
Watch For:
Whale exchange inflow data (CryptoQuant)
ETF flow momentum
XRPL Lending Protocol news (January 2026)
Bitcoin correlation and direction
This is not financial advice. Always conduct independent research and manage risk appropriately.

Whale Watching: What Institutional Flow Actually Tells Us
In the Ocean of Markets, the Biggest Players Leave the Deepest Wakes
Most retail traders stare at price.
Serious traders watch who is behind the move.
In the era of AI and real‑time data, you don't have to guess what the "smart money" might be doing. You can read their footprints in volume, order flow, and on‑chain behavior — then decide whether to swim with them or stay out of the way.
Who Are the Whales, Really?
"Whales" aren't mythical creatures. They're large players whose orders are big enough to move the market:
Hedge funds and prop firms
Pension and mutual funds
Investment banks and market‑making desks
In crypto: early adopters, exchange wallets, protocol treasuries and large funds
They don't trade like retail because they can't . Size forces them to:
Enter and exit over time
Hide intent with execution algorithms
Use levels where liquidity is deep enough to absorb flow
That's why their activity leaves patterns you can study.
Why Following Flow Matters More in the AI Era
AI and automation haven't made whales less important — they've made them more efficient:
Execution algos slice large orders into small pieces
Smart routing hunts for the best liquidity across venues
Portfolio models rebalance at increasingly precise trigger points
That means big decisions (accumulation, distribution, hedging, de‑risking) still show up in:
Unusual volume where price barely moves
Levels that absorb wave after wave of orders
On‑chain flows into and out of exchanges (for crypto)
You don't need to know who the whale is. You just need to recognize when "someone big" is quietly changing their exposure.
Three Practical Ways to Spot Whale Footprints
Volume That Doesn't Match the Candle
High volume but small candle body can signal accumulation or distribution.
Repeated volume spikes at the same level hint at a large resting order being filled.
Order Flow and Liquidity Behavior
Blocks and icebergs: large orders sliced into many smaller prints at the same price.
Support that "refuses" to break despite aggressive selling.
Resistance that repeatedly rejects pushes higher.
On‑Chain Flows (Crypto)
Big transfers to exchanges often precede potential selling pressure.
Big transfers from exchanges into cold wallets often align with accumulation.
Concentration in a few wallets can increase systemic risk.
AI tools can monitor all this in the background, pinging you only when something unusual happens.
Thinking in Terms of the Accumulation/Distribution Cycle
Zoom out and you see the same story play out over and over:
Accumulation – Big players quietly build positions while sentiment is bearish.
Markup – Price trends higher as demand overwhelms supply.
Distribution – Whales offload to latecomers near highs.
Markdown – Price grinds or flushes lower as supply dominates.
You can't know every motive behind every print. But you can ask:
"Does the current behavior look more like quiet accumulation or organised distribution?"
"Is volume confirming or contradicting the move?"
"Am I buying from strong hands or selling to them?"
How AI Can Help You Track Whales Smarter
Instead of manually staring at raw volume all day, AI‑driven tools can:
Tag and classify large prints and block trades
Detect recurring absorption at key levels
Aggregate on‑chain flows into simple dashboards (net inflows/outflows)
Alert you when "unusual" activity appears relative to normal behavior
Your edge isn't memorizing every tick — it's designing the rules for what counts as meaningful whale activity, and letting systems watch for you.
Staying Grounded: What Whale Watching Can't Do
It can't guarantee direction — whales hedge, scale, and reposition.
It can't replace risk management — big players can be early or wrong.
It can't turn a bad strategy into a good one — it can only improve timing and context.
Treat whale analysis as an extra lens, not a green‑light signal by itself.
Your Turn
How much weight do you give to institutional flow in your trading decisions?
Do you focus more on volume, order flow tools, or on‑chain metrics if you trade crypto?
Share what has (and hasn't) worked for you — your process might help someone else stop swimming blind.

SOLUSD - The $130 Accumulation Zone: Why This Dip Is A GiftJack Of All Trades SOL Analysis with AI Trading Mentor + AI Whale Bot Analysis
📈 The Setup - What My AI Trading Mentor & Whale Bot Just Found
Current Price: $132.52 | Date: December 5, 2025
I've been analyzing the SOL chart with my AI trading mentor for the past 48 hours, and simultaneously tracking whale movements with my custom whale bot. What we discovered is absolutely insane.
While retail traders are panic-selling this -4.58% dip, whales and institutions are accumulating like it's 2020 all over again. And they know something the market doesn't.
Let me show you what's REALLY happening behind the scenes.
🔎 The Whale Bot Discovery - $56M Accumulation (72 Hours Ago)
My whale tracking bot flagged something MASSIVE on December 2, 2025:
439,938 SOL left Coinbase Institutional for an unknown wallet —that's $56 MILLION moved in a SINGLE transaction.
This wasn't panic selling. This was strategic accumulation.
The movement intensified discussions around accumulation rather than short-term distribution, strengthening confidence that whales anticipate a Solana reversal while the market remains compressed .
But here's where it gets REALLY interesting...
The Whale Pattern That Changes Everything:
My AI trading mentor analyzed the historical whale behavior on SOL, and here's what we found:
$88M whale accumulation in 3 days back in early November
13 institutions injected $1.72B into Solana treasuries (1.44% of total supply!)
$39.65M negative netflow (coins LEAVING exchanges)
Translation? Whales are REMOVING supply from the market while retail panics about the -4.58% dip.
Historical data shows whale accumulation drove Solana's 132% Q3 price rebound. We're seeing THE EXACT SAME PATTERN right now at $130.
🚨 The December 2 Event NOBODY is Talking About
While everyone was watching SOL dump from $148 to $132, something HISTORIC happened on December 2, 2025:
Vanguard, the $11 TRILLION asset manager, opened Solana ETFs to 50M+ clients starting December 2.
Let me repeat that: $11 TRILLION.
Vanguard reversed its anti-crypto stance, enabling clients to trade Solana ETFs and mutual funds. The firm cited crypto ETFs' resilience during volatility and mature compliance frameworks as key factors.
Why This is BIGGER Than You Think:
Bitcoin ETFs brought in $100 billion in institutional capital after approval. Sol ana is now getting the SAME treatment.
Polymarket shows 91% chance of Solana ETF approval by December 31, 2025 with volume of $178,356 betting on this outcome.
But here's the kicker that my AI trading mentor caught: Solana spot ETFs saw $13.55M net outflow on December 1, BUT Bitwise's BSOL ETF had $17.18M INFLOW.
What does this mean?
Retail is selling. Institutions are buying. Classic wealth transfer setup.
📊 Technical Analysis - The Falling Wedge Nobody's Seeing
My AI trading mentor ran the technicals, and here's what the chart is SCREAMING:
Pattern: Falling Wedge (BULLISH Reversal)
Historical breakout rate: 75% upward
Current compression: Tightest it's been in 3 months
Breakout target: $145-165 range
CoinGecko's 7-day view shows Solana bouncing from a low near $126.75 on Tuesday to about $141.65, with today's move alone adding roughly $14.64 in 24 hours .
That bounce happened EXACTLY when?
December 3 ONE DAY after Vanguard opened SOL ETFs.
Key Technical Levels:
🟢 SUPPORT (Buy Zones):
$128-$135: Current FVG + falling wedge lower boundary
$120-$125: $120 long-term support zone that has acted as major line in sand for nearly two years
$105-110: Nuclear capitulation zone (10% probability)
🔴 RESISTANCE (Profit-Taking Zones):
$145-$150: Recent highs + wedge breakout target
$165-$175: Institutional FOMO zone
$195-$210: Path to new ATH becomes clear
Why This Setup is INSANE:
WTI trading around $59.20, caught between converging trend lines squeezing price action over past few weeks. Break above triangle resistance could trigger rally.
Wait, that's oil. Let me correct that—SOL is showing the EXACT same compression pattern.
SOL is still about 57% below its all-time high of $295.83 and is only recently rebounding from key $120 long-term support zone.
Risk/Reward from $132:
🎯 The Fundamental Catalysts Stack
CATALYST #1: Vanguard Opens The Floodgates
Vanguard's $11T AUM provides unprecedented retail and institutional access.
But here's what my AI trading mentor calculated: If just 0.1% of Vanguard's AUM flows into SOL ETFs, that's $11 BILLION in buying pressure.
Current SOL market cap? $79 billion.
That would be 14% of the entire market cap as NEW demand.
What would that do to price? You do the math.
CATALYST #2: Institutions Are Going ALL-IN
13 institutions injected $1.72B into Solana treasuries, leveraging 7-8% staking yields.
But here's the part that blew my mind: Sharps Technology and Upexi Inc. lead this trend, allocating $445.4M and $260M, respectively.
These aren't crypto-native firms. These are TRADITIONAL COMPANIES moving into SOL.
FalconX and Wintermute purchased 44,000 SOL worth $8.3M on October 26, 2025, and since April have accumulated 844,000 SOL worth $149M.
Pattern? Institutional accumulation is ACCELERATING, not slowing.
CATALYST #3: The ETF Approval Timeline
92 crypto spot ETFs covering about 24 different coins are queued at the SEC, with majority of single-asset ETFs like those for Solana, with most final decision deadlines falling in October.
Wait, October already passed. What happened?
As of November 13, two Solana ETFs have started trading: Bitwise Solana Staking ETF (BSOL) and Grayscale Solana Trust (GSOL).
SOL ETFs are ALREADY LIVE!
JPMorgan expects Solana ETFs to see about $1.5B in first-year inflows.
That's $1.5B of guaranteed buying pressure over the next 12 months.
CATALYST #4: Network Fundamentals Are INSANE
According to Electric Capital, Solana ranked second only to Ethereum for new developer inflows in 2025, attracting over 11,500 new developers—an annual growth of 29.1%.
More developers = More dApps = More users = Higher demand for SOL.
Solana stays fast and low-cost, with high throughput and low latency. The ecosystem keeps growing: active developers, expanding DeFi, busy NFT markets, and new games.
And here's the technical edge: SIMD-0256 activation in July 2025 increased block capacity 25% to 60M compute units, with Alpenglow consensus testing targeting 150ms finality vs current 12 seconds.
Translation: SOL is getting FASTER and MORE SCALABLE while demand explodes.
🎯 THE TRADE SETUP - Precise Entry & Risk Management
Alright, enough theory. Here's EXACTLY how to trade this setup based on my AI trading mentor's analysis and whale bot signals.
🟢 PRIMARY LONG SETUP: BUY SOLUSD
Entry Zone: $128 - $138 (SCALE IN)
Position Sizing:
Scale in strategy:
$135-138 (if no further dip)
$130-133 (current level)
$125-128 (if we get final flush to wedge support)
Stop Loss: $118 (HARD STOP, NON-NEGOTIABLE)
Below $118 = breaks 2-year support + wedge pattern
Below this = whale accumulation thesis INVALID
Max loss: 11% from average entry at $132
Take Profit Targets:
TP1: $145-$150 (Probability: 80%)
TP2: $165-$175 (Probability: 60%)
Vanguard ETF inflows + institutional FOMO
Analysts project potential of $225 by year-end assuming favorable conditions
TP3: $195-$210 (Probability: 40%)
Full ETF momentum + breaks 2025 resistance
CryptoPredictions sees price ranging between $197.29 and $290.13 for December 2025
MOONSHOT: $250-$300 (Probability: 20%)
InvestingHaven expects SOL to hit $300 in 2025, likely around summer
Market confidence shows 99% odds favoring approval with DATs accumulating $2B SOL.
Entry Confirmation Checklist (AI Trading Mentor Approved):
Before entering, CHECK THESE:
✅ Price holding above $128 (wedge support)
✅ Whale bot showing CONTINUED exchange outflows (check daily)
✅ Volume spike on bounce (5M+ SOL volume on daily candle)
✅ RSI showing bullish divergence (price lower low, RSI higher low)
✅ No surprise negative ETF news (check daily)
✅ Bitcoin holding above $95K (macro support)
WAIT FOR 4/6 CONFIRMATIONS BEFORE FULL POSITION
Weekly Monitoring (WHALE BOT TRACKING):
Check EVERY DAY :
Whale exchange flows: Continued outflows = bullish
ETF inflow data: Monitor BSOL, GSOL inflows weekly
Vanguard adoption: Any announcements of client uptake
Developer activity: Check GitHub commits (growth = bullish)
Bitcoin correlation: If BTC crashes 10%+, reduce SOL 30-50%
5. Emergency Exit Conditions:
❌ Close below $118 on daily = EXIT ALL IMMEDIATELY
❌ Whale bot shows $100M+ exchange INFLOWS = reduce 50%
❌ ETF approval rejected/delayed = EXIT 50%, trail rest
❌ Bitcoin crashes below $85K = reduce exposure 30-50%
❌ Major SOL network outage = EXIT ALL (hasn't happened in 2+ years but still a risk)
⚠️ The Bear Case - What Could Go WRONG
I'm bullish, but my AI trading mentor taught me: ALWAYS know your bear case.
Bear Scenario #1: ETF Approval Delayed (30% Probability)
What happens: Polymarket shows 91% approval odds , but what if SEC delays again?
Impact: Drop to $105-115 range
Counter: Two Solana ETFs already trading (BSOL, GSOL), approval momentum is REAL
My take: Even if delayed, whales keep buying = floor at $120
Bear Scenario #2: Whale Distribution Begins (25% Probability)
What happens: Whale DYzF92 dumped 33,366 SOL ($4.71M) at a loss recently
Impact: If more whales follow, drop to $110-120
Counter: 439,938 SOL accumulation outweighs the 33K dump by 13X
My take: One whale selling ≠ trend. NET whale flow is BULLISH.
Bear Scenario #3: Bitcoin Macro Collapse (20% Probability)
What happens: If BTC crashes to $70K, SOL follows to $90-100
Impact: Full portfolio drawdown
Counter: SOL correlation with BTC is strong, but institutional buying provides support
My take: Monitor BTC. If breaks $90K, cut SOL exposure 50%.
My Risk Assessment:
Bears need: ETF delay + whale selling + BTC collapse
Bulls need: ETF momentum + Vanguard inflows + $120 holds
Current probability: 70% bull, 30% bear
Even if bears win short-term, downside limited to $105-110 (Vanguard/whale floor). But upside? $195-250+ (institutional FOMO).
🔥 The Bottom Line - Why This is THE Trade
Let me summarize everything:
The Setup (December 5, 2025):
SOL at $132 = 2-year support + falling wedge bottom
$56M whale buy December 2 (3 days ago!)
Vanguard opens SOL ETFs December 2 (2 days ago!)
Already bounced $126→$141 this week
91% ETF approval odds by Q1 2026
The Catalysts:
Vanguard effect: $11T AUM now has SOL access
Institutional buying: $1.72B in treasuries, 13 institutions long
Whale accumulation: $88M in 3 days + $56M Dec 2
Developer growth: 11,500 new devs
Network upgrades: 25% capacity increase + 150ms finality coming
What The Market is Missing:
Everyone sees: -4.58% dip = bearish
Whales see: Perfect accumulation zone before Vanguard money flows in
Despite strong rebound, Indonesian exchange Pintu notes Solana is still about 57% below its all-time high of $295.83.
That's not a bug. That's a FEATURE.
We have 57% room to run back to ATH, and we're sitting at 2-year support with $11 TRILLION in new capital about to enter through Vanguard.
🎯 Action Plan - What To Do RIGHT NOW
IF YOU'RE BULLISH (Recommended by AI Trading Mentor):
Set Alerts:
Alert at $128 (aggressive buy - wedge support test)
Alert at $133 (current - scale in point)
Alert at $138 (last entry before breakout)
Alert at $145 (take profit trigger)
IF YOU'RE BEARISH:
Wait for:
Close above $150 with volume (breakout confirmed)
Then enter on $145-148 retest
Safer but worse risk/reward
IF YOU'RE NEUTRAL:
Allocate 3-4% of portfolio (half position)
Enter at $130-135 only
Take profits at $155 (+19%)
This is the "I believe but I'm cautious" play
Final Thoughts - The Truth About This Setup
My AI trading mentor has analyzed thousands of setups.
Here's what I KNOW for certain on December 5, 2025:
✅ 439,938 SOL ($56M) removed from Coinbase Dec 2
✅ Vanguard ($11T) opened SOL ETFs Dec 2
✅ 13 institutions hold $1.72B SOL (1.44% supply)
✅ 91% ETF approval odds on Polymarket
✅ $120 support held for 2 years
✅ Falling wedge = 75% break upward historically
✅ $100B flowed into BTC after ETF approval
Here's what I DON'T know:
Will Vanguard inflows start immediately or take months?
Will whales keep accumulating or start distributing?
Will BTC hold or crash?
Drop a 🟣 if you're buying SOL at $130-135.
Drop a 🤖 if you're using AI to refine and help guide you with setups like this.
Drop a 🐋 if you're following whale accumulation.
Drop a 💰 if you're ready for $

Lucic/UsdtGATE:LUCICUSDT
**Price is currently taking support around the 0.1730–0.1750 zone.** 🟩
**If this level breaks, the next major support sits at 0.1550.** 🔻
**If price starts moving up, the first resistance will be at 0.2080.** 🔼
**Above that, a strong resistance waits at 0.2683 — a major barrier.** 🧱
**The 0.3418 level is a big supply zone where sellers step in aggressively.** 📉
**And 0.3691 is the level where a real breakout would be confirmed.** 🚀
---
### ⚠️ Disclaimer:
*These are chart-based levels only — not financial advice. Crypto is volatile, always do your own research.* ⚠️📊

Liquidity Hunt: How Whales Move the MarketEver wonder why prices always seem to drop just below your stop loss before bouncing back? It’s not bad luck; it’s liquidity in action. The big players are prowling, hunting for stops, and if you don't understand where they’re lurking, you might just be their next target. Liquidity definition refers to how easily an asset can be bought or sold without significantly affecting its price, and in the world of crypto, this dynamic can make or break your trade. Let’s dig into how these whales work the market and how you can avoid becoming their prey.
What is Liquidity?
Liquidity meaning refers to how easily an asset can be bought or sold without affecting its price. In the context of crypto, it's crucial to know that high liquidity means less slippage, while low liquidity can lead to sharp price moves. Market liquidity is essential for smooth trading, but it also creates opportunities for big players to manipulate price action by targeting stop losses.
Liquidity Risk and Big Players
Liquidity risk arises when there's not enough liquidity to execute trades efficiently, especially during volatile periods. Big players exploit these conditions by pushing prices through key support and resistance levels, triggering stop orders and capturing liquidity. This is why it’s vital to be aware of where liquidity is concentrated — big players often target areas with many stop losses, trapping retail traders in the process.
Tools to Analyze Liquidity
Volume Indicators: Use tools like Accumulation/Distribution or On-Balance Volume (OBV) to spot surges in volume that may indicate manipulation or big players entering the market.
Bitcoin Liquidity Heatmap: A Bitcoin liquidity heatmap shows where large buy and sell orders are placed, helping you avoid areas where liquidity is likely to be targeted by whales.
Liquidity Ratio Formula: Another great tool which helps measure market depth and liquidity. You can calculate it as:
A higher ratio indicates that there is more buying pressure, suggesting the market is more liquid and less prone to manipulation. On the other hand, a lower ratio signals more sell orders, which could expose you to increased liquidity risk and higher chances of price manipulation by big players.
Price Action: Watch for candlestick patterns like pin bars or engulfing candles near key support or resistance levels to anticipate price reversals after stop hunts.
Conclusion
While tools like volume indicators and Bitcoin liquidity heatmaps can help, always stay vigilant. Use wider stop losses to avoid getting trapped at key levels, and stay cautious during periods of low liquidity when whales are most active. This article isn’t trading advice — always DYOR and trade responsibly.

AKE/USDT ( AKEDO) CAN SHOW WHALE DCA INCREASE TO $0,005 TARGET📊 Cycle Update – AKEDO/USDT
Current price is consolidating in the DCA Whales Zone (0.00137 – 0.00144), showing that accumulation is likely taking place.
This level acts as a cycle base, where strong hands are active in building positions.
As long as price holds above this zone, the cycle remains intact with upside potential.
The next major target sits around $0.005, which is over 3x from current levels and aligns with the open space on the chart.
✅ Outlook: With whale DCA activity confirmed, this cycle has the potential to expand upward, and reclaiming momentum above accumulation could trigger the next leg to $0.005.

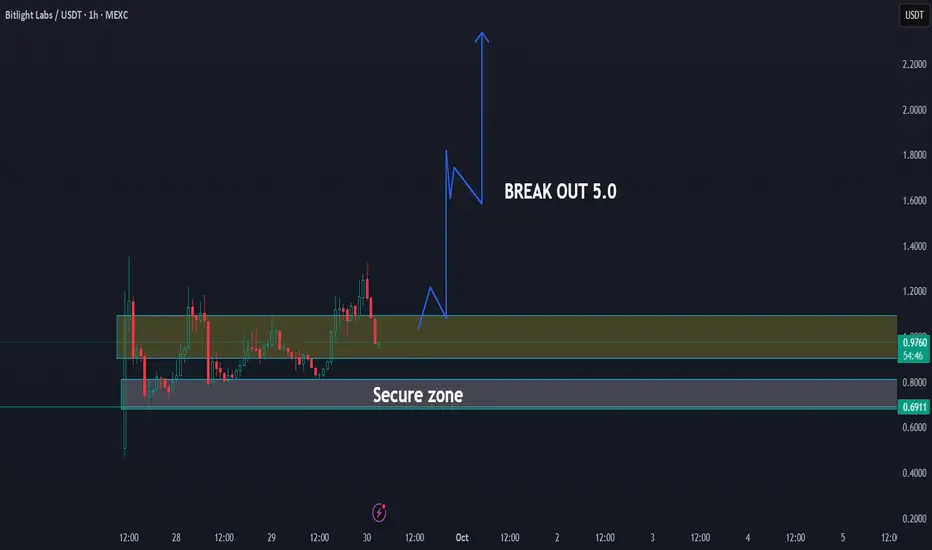
LIGHT CAN BREAKOUT AS MYX did before - UPDATE 30-09-2025LIGHT / USDT Trading Update
🔹 The coin is currently consolidating inside the secure zone, showing strong accumulation signs.
📊 As long as price holds this area, the probability of a major breakout remains high.
🚀 Similar to MYX, once momentum builds, this setup has the potential to break out toward the $2.00 level.
🔑 Key breakout confirmation will come once price clears the resistance zone.
📌 Summary:
Light is forming a strong base, and as long as the secure zone holds, the chart suggests a high chance for breakout, with the first major target set at $2.00.
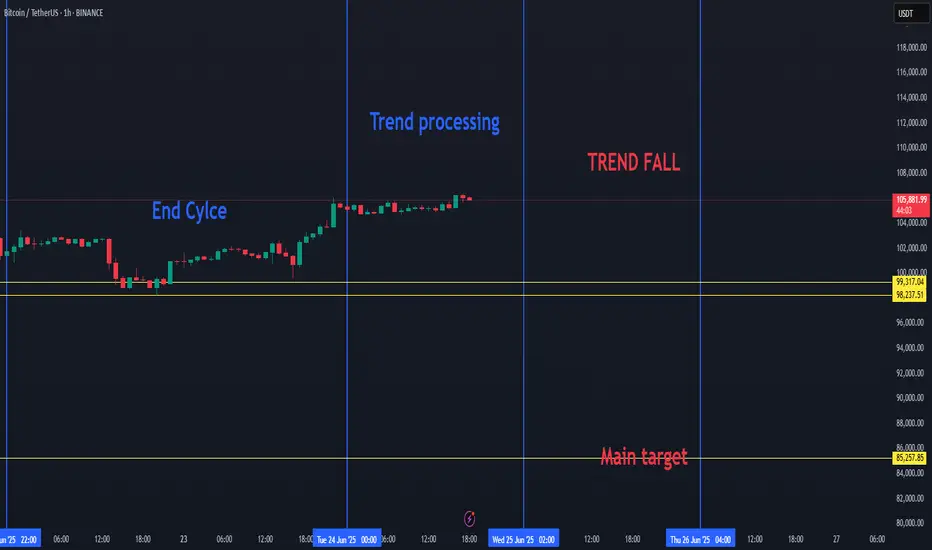
BTC 110K Low time frame can be the return for Bitcoin📊 Market update low time frame
If there is good news, then BTC should confirm in 4H max.
If btc is able to gain 110K on the low time frame, there is a good chance we can go with BTC to a new uptrend, which could also mean good news for most of the altcoins.
All eyes are on the 10K in the coming time frame for a confirmation.
BTC can make a downtrend move to get volume with a spike to a low time frame, as we know from BTC.
IF BTC moves lower, the low time frame can change to 109800
110K can be the reason for 113K, and a confirmed main trend means a positive BTC
We will follow it step by step.

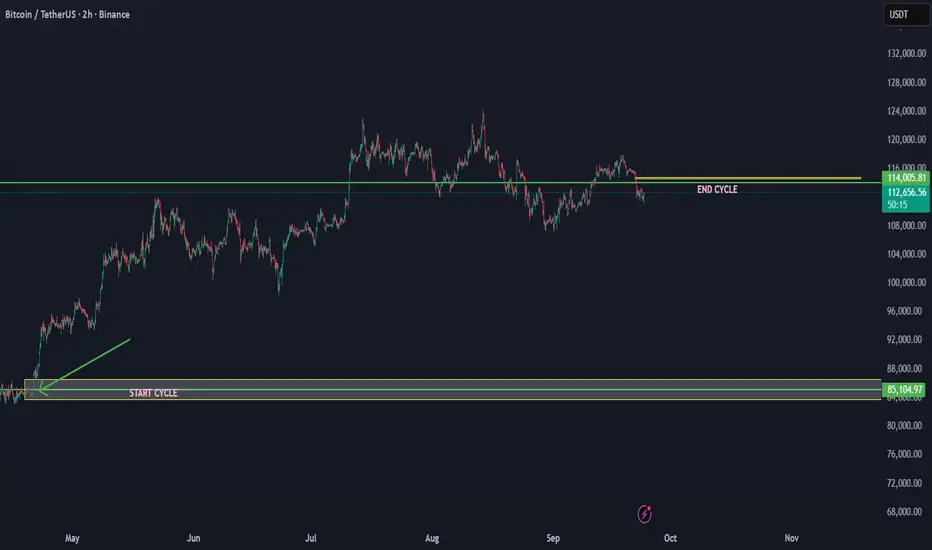
The BTC cycle that started at 84K is projected end at 114K This is a cycle update for BTC/USDT. Based on the cycle data, the cycle that started at 84K has ended at 114K. This indicates that we are now entering a new major trend breakdown in the cycle. It can take time, but when there is a new uptrend cycle, we will add.
This time frame and action made the end of the cycle that started from 84K
This could mean that btc can enter below 110K in the coming time. We have seen more times in the history of BTC that by the cycle end, the trend breaks down in steps.
THIS IS THE CYCLE RUN FOR NMR/USDT 2025 --> $30 -$34This update confirms the ongoing cycle of NMR/USDT as well as the secure zone. The trend is expected to continue for several days, and potentially even longer. We are seeing a green signal for this coin, which suggests that a short-term breakout is likely. After the correction, we continued to track this coin in anticipation of the next upward wave

CAN SV HIT THE ALL TIME HIGH UP $500 ---> YEES -Mainnet, TeranodCurrently, BSV appears to be stabilizing after a period of decline, and it is trying to reach a potential maximum level of $30–$60.
We also know the power of this coin, when it has interest and building it can increase 100% in a short time frame or more.
The best way to follow a coin is day by day, since there is no guarantee that expectations will be met. This update is based on possibilities and potential effects rather than certainties.
What could allow BSV to reach a new all-time high (ATH)?
The BSV mainnet, Teranode, is designed to handle millions of transactions per second. Tests have already been completed, and the original version is expected to launch in 2025.
This process can take time until there are huge updates and confirmations on the mainnet. same time it proved before that is able to do it from this price in 126 days to ATH

Crypto Market Update – July 14th🔷Market Update – July 14th: Another Winning Move 🧠🔥
Another week, another breakout – and we’ve been tracking it every step of the way.
💸 Entries? Perfect.
✅ Targets? Hit.
🧠 Psychology? Nailed.
Today, we reached 122,795 , hitting a key target with precision. From there, we took partial profits — and are now watching the next leg toward 127K+ .
We’ve had 4 amazing entries lately, all executed with structure, risk control, and vision.
Today’s move? Just the latest in a series of well-calculated trades.
📉 Support now rests at 120,500 , with deeper support still valid around 114,921 .
This isn’t just a lucky guess — it’s the outcome of following levels, structure, and behavior.
But if you want to go deeper into what’s really happening beneath the surface ...
📊💸 Read the NEW Deep Dive Part III:
The Next BIG Whale Play Unfolds →
Inside it:
🐳 How the bear trap is being set
🧠 Why this is a disbelief rally
⚠️ Why shorting now = adding fuel to the fire
💥 And why this may be the first leg of a much bigger run...
Stay sharp. Stay structured. Stay ahead.
One Love,
The FXPROFESSOR 💙
Disclosure: I am happy to be part of the Trade Nation's Influencer program and receive a monthly fee for using their TradingView charts in my analysis. Awesome broker, where the trader really comes first! 🌟🤝📈
📊💸 And don’t miss Deep Dive Part III – The Next BIG Whale Play Unfolds:

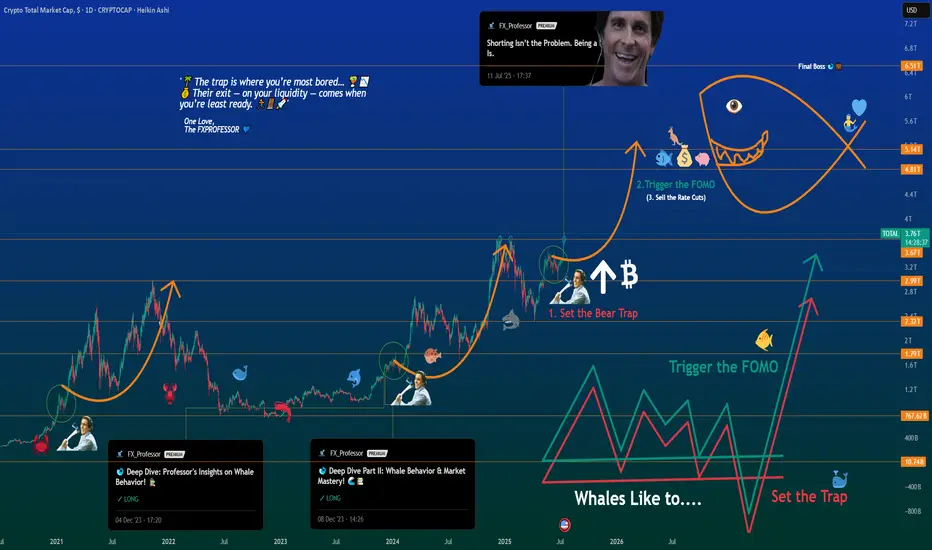
Deep Dive Part III – The Next BIG Whale Play UnfoldsDeep Dive Part III – The Next BIG Whale Play Unfolds
📍In Parts I & II of this Deep Dive, we broke down the psychology of whale behavior — from “Buy the Rumors, Sell the News” to the critical breakout zones that echoed historical patterns.
🐋 Back then, we spotted the whales' playbook early. The strategy was simple:
Buy the Rumors – Sell the News.
🧠 But now, the script has changed.
“The trap is where you’re most bored… 🌴📵
Their exit — on your liquidity — comes when you’re least ready. 💰🏄♂️💼”
Let’s break this moment down into what’s really unfolding.
We are officially entering the next stage of the cycle — not just in price, but in psychology.
This is no longer just about charts.
This is about human behavior on autopilot.
Here’s what I see happening right now — broken into three truths:
1️⃣ People Are On Holiday 🌞
From my community to the broader market, the energy is low.
People are either sunbathing on a beach or mentally checked out.
The focus is not there. The reflex to take action is dulled.
📉 The trap is where you’re most bored… 🌴📵
💰 Their exit — on your liquidity — comes when you’re least ready. 🏄♂️💼🚀
We’re seeing it unfold now:
1. Set the Bear Trap
2. Trigger the FOMO (will be down the road, yes)
3. Exit on Liquidity (the closing act of the play)
🕶️ But when everyone is away or asleep, that’s when the trap is laid.
It’s during these quiet, lazy days that the big moves get built.
2️⃣ This is a Disbelief Rally 🎢
The market trained everyone with a rhythm:
pump ➝ dump, pump ➝ dump, pump ➝ dump…
So what happens now?
People don’t trust the breakout. They’re frozen.
“We’ll dump again,” they say.
Except… what if this time, we don’t?
That disbelief becomes fuel.
It becomes hesitation — and hesitation becomes missed opportunity.
3️⃣ Bears Are Shorting Into Strength 🧨
This is key. While retail is confused, the bears are pressing in hard.
Their shorts are adding fuel to the pump they don’t see coming.
That’s why I posted recently:
“Shorting isn’t the problem. Being a psycho bear is.”
It’s not about being bullish or bearish —
It’s about timing , discipline , and narrative awareness .
Whales love this moment.
They lure in shorts, set the trap, then ignite the breakout straight into FOMO.
🧠 The Game:
Set the Trap → Trigger the FOMO → Exit on Liquidity 💥
This is what you’re seeing on the chart.
Not just price action — psychological choreography.
🕰️ In 2020–2021, we saw the exact same structure.
Part I warned about early accumulation and baiting behavior.
Part II showed how whales manipulated expectations with layered waves of doubt.
Now in Part III — the explosion few are ready for.
Zoom into the chart and it’s all there:
The curve, the trap, the trigger… and yes — the Final Boss.
🎯 The Final Boss: 6.51T
That’s the ultimate liquidity zone.
If this cycle plays out, we’re headed toward it.
“Sell the Rate Cuts” will be the new “Sell the News.”
It’s not the headlines that matter — it’s who’s left holding the bag.
🔚 Final Thought
The real exit — the one that traps most of retail — will come not when you’re euphoric,
but when you’re still saying:
“Surely we must dump now…”
So stay sharp.
Trade the chart — but don’t forget to read the behavior.
One Love,
The FXPROFESSOR 💙
Part1:
Part2:https://www.tradingview.com/chart/idea/VgMBPsp3/
The Bear Trap:
Disclosure: I am happy to be part of the Trade Nation's Influencer program and receive a monthly fee for using their TradingView charts in my analysis. Awesome broker, where the trader really comes first! 🌟🤝📈
🐋 Deep Dive Part II: Whale Behavior & Market Mastery! 🌊📚Hey Crypto Enthusiasts! 🚀
In a recent analysis, I not only nailed Bitcoin's (BTC) movement but also illuminated the subsequent altcoin surge, driven by insightful whale behavior observations. Let's merge these insights with a focus on ADA (Cardano), OP (Optimism), SOL (Solana), and BTC. 📊
Cardano's (ADA) Meteoric Rise 🌟
ADA's journey began with a break above a pivotal support-resistance level. My entry point at 0.256 turned into a remarkable rally, hitting 52 cents. This movement was a classic case of altcoin buoyancy following Bitcoin's pause.
Optimism (OP) and the Altcoin Breakouts 🌈
In the shadow of Bitcoin's stagnation, altcoins like OP exhibited significant breakouts, showcasing the shifting focus of market whales from Bitcoin to promising altcoins.
Bitcoin (BTC) and Whale Dynamics 📉
Bitcoin's behavior provided a crystal ball into the whale activities. As BTC approached a major resistance level, it signaled a strategic move by whales to divert funds towards altcoins, catalyzing their surge.
Solana (SOL) and Market Trends ☀️
Solana's chart also mirrored this trend, highlighting the broader market dynamics influenced by these significant players.
🔍 Insight on Whale Behavior:
My analysis delved deep into the whale behavior, highlighting how Bitcoin's rally and subsequent pause was a precursor to altcoin dominance. This strategic pause in Bitcoin's ascent was a clear signal for the whales to redistribute their focus and capital, sparking a remarkable rise in altcoins like ADA, OP, and SOL. 🔄
The Bigger Picture - Understanding Market Shifts: What this trend teaches us is the importance of reading between the lines. Whale movements often precede major market shifts, and by understanding these patterns, we position ourselves to make informed decisions. 🧠
Future Outlook: As we continue to monitor these market dynamics, it's crucial to stay vigilant. The crypto market is known for its volatility, and while the current trend favors altcoins, it's essential to be prepared for any shifts that may arise. Always keep an eye on key resistance and support levels, market sentiment, and global economic factors that could influence the next big move. 🌐
Together, let's stay ahead of the curve in this fascinating and ever-evolving world of cryptocurrency. Your insights and engagement are what make this journey exciting and rewarding!
One Love,
The FXPROFESSOR 💙
part 1:

DSYNC/USDT NEW INCREASE VOLUMEDSYNC/USDT NEW INCREASE VOLUME
New upcoming volume, that's what the trend data shows, we will follow this coin with updates by confirmations.

BTC HIGH DATA SHOW BREAKDOWN TO 85K FOR BITCOIN SOON.Bitcoin Market Update
BTC SEEMS TO ENTER A NEW CORRECTION PHASE SOON.
Recent data suggests that the current Bitcoin (BTC) cycle is coming to an end. As a result, we may soon see a downward move in BTC's price. The key target in this potential drop is around $85,000, with expectations that BTC will fall below $100,000.
This week, Bitcoin completed its cycle trend and is now entering a processing or transitional phase. Once this phase ends, we anticipate another decline in price.
This outlook is based on recurring patterns seen in previous BTC cycles, which have shown similar behavior in the past.
BTC can play on the low time frame with uptrends and downtrends, but if we will choice a side, then it will be the red trend.. since BTC cycle is ending.
UNEXPECTED RISK CRASH FREE FALL AFTER TREND DATA FOR TH NEXT 48HDepending on our study, BTC has a high chance of a new crash below 100K.
The next 48 hours are important for the trend change of BTC, which can allow the trend to free-fall below 100K
BTC is at a top, and it did recovery always recovered on the M volume top., We are now again on the same trend.
BTC can return below 100K as this update shows, with the possibility of targeting the main target 85K - This is the trend zone for new interest.
The reason for this crash is that BTC has not confirmed the cycle, which means the end of the cycle. There is always possibility that the market can act green, but we expect it can show an unexpected breakdown.

Market SIGNALS SHOW THAT BTC CAN FALL TO 85K USDMarket follow-up study shows that there is a good chance BTC can fall to 85K in the coming time period. The market cycle seems to end the green trend and to enter a new red zone.
Time will show what really can happen with BTC.
The market can make a fake trend, with a trend fall on a high time frame.
The crash can also happen on the main markets.
This is not trading advice, trade always only depending on your plan.

EUR/USD Weekly Bias technical analysis appears well-reasoned. EUR/USD Weekly Bias Analysis
Technical analysis appears well-reasoned:
1. Short-term bearish bias: You anticipate a decline towards the previous week's low, indicating a potential short-term downtrend.
2. Bullish reversal zone: You've identified a critical area, marked by the weekly Fibonacci Volume Zone (FVG), where a potential bullish reversal could occur.
3. Upside target: Your analysis suggests a move towards the weekly high, offering a clear profit target.
# Key Confirmation Factors:
To validate your bias and adjust your strategy, consider the following:
- Candlestick patterns: Monitor for bullish reversal patterns, such as hammer or engulfing candles, to confirm a potential trend change.
- Momentum indicators: Keep an eye on the Relative Strength Index (RSI) and other momentum indicators to gauge the strength of the potential reversal.
- Volume analysis: Analyze trading volumes to ensure they support your bias, with increasing volumes on up days and decreasing volumes on down days.
By carefully monitoring these factors, you'll be well-positioned to adjust your strategy and capitalize on potential trading opportunities in the EUR/USD market.

What happens if you give a TikTok trader a billion dollars?In this video, I covered the topic of accumulation and distribution of large positions.
I explained why big market players prefer using limit orders when building and offloading their positions.
I also talked about how retail traders — who I often call TikTok traders — tend to rely on market orders, and why the price is more likely to move against the masses of TikTok traders.
Understanding this is crucial when analyzing what’s really going on "under the hood" of the market. I’ll dive deeper into this in my upcoming posts.
So don’t miss out! Subscribe!

THE CLV WHALES BREAK..THE CLV WHALES BREAK..
CLV interesting for new voluume
Always manage the risk since it has shown an increased trend of 60% to risky to enter directly with no plan.
There is high chance this coin can break up $0,10 coming time

The Whales in Action on XRPAs I have been telling everyone who invests in CRYPTOCAP:XRP , the Financial institutions are trying to shake out retail traders, now we've got proof they're serious. When NY came online this morning (February 12, 2025) at 8:30 am ⬇️⬇️⬇️⬇️ we can see that these major institutions quickly dropped the market to take out all of the traders leveraged in XRP.
We have been seeing XRP stagnate between $2.50 and $1.79 for a while even though dozens of large announcements are happening every month. One day we will wake up and find XRP trading at $10.00. Buy low and sell high. Hold some of your XRP without trading it in a cold wallet because I know that we will see $100,000 XRP tokens in a few years. There is just too much momentum and too many Financial institutions, governments (CBDCs), corporations, and tokenization happening with the XRP Ledger (XRPL).
Stay strong and don't let the whales discourage you!
