XRP : Bullish Activity In RippleXRP: Bullish Activity In Ripple
This is in the analysis I shared a few days ago.
Regardless of the problems created by FXT in crypto
market these days we can see that not all currencies
lost high liquidity.
One of them is Ripple, which continues to stay above the lower support zone which is proving very strong.
We can see Ripple explode very quickly as long as it is showing bullish volume in these difficult times.
PS: If the price will break below 0.2890 just accept the loss as we can never know when
it will stop after that zone.
Thanks and good luck!
Whitebit

BTC | Potential Reversal Near 15K BTC | Potential Reversal Near 15K
Price looks like it already absorbed the FTX news, however the fear
and the panic is very high in the market.
So everyone is only talking about any other news that may come out again
related to any other broker infected from FTX.
So if that is not the case we may see the price to rise again.
It is also expected a lot from the market that BTC probably reached the bottom.
The reason after that is also BTC costs that are calculated near 15K and the is also the maximum
the price that BTC can crash.
However, the market fear can move it also lower....never knows with this market.
So this is only a possible scenario that I am looking at but it might be valid after more than
two weeks I guess.
For the time being the bearish volume is still very high.
Thank you and Good Luck!

XRP: Range Trading Or...XRP - Range Trading Or...
Ripple is holding very strong despite the market decline from FTX.
As we can see, the price has not yet reached the previous low yet and this is a good sign.
It seems that all XRP fans are still holding Ripple very strongly and mostly at the moment when they are making great strides with the SEC lawsuit.
The price has a higher chance than it already found the bottom and may rise again.
However, we must be careful because we can never know the end of FTX and its impact on it the entire crypto industry.
A price break below the structure can push it lower...so be careful.
Thanks and Good Luck!

ETHEREUM: Maybe ETH Has Hope To Rise Again After FTX DramaETHEREUM: Maybe ETH Has Hope To Rise Again After FTX Drama
On the daily chart, ETH created a very nice harmonic pattern.
The Beauty of this pattern consists in the way how the price reacted bullish close to the pattern completion.
Another important fact to note here is that the price has not fallen below the previous low located near 885.
So this is showing that the crypto market still has high hopes to recover again even after the FTX drama.
However, let's be careful and use stop losses on every trade we take.
Thanks and good luck!

XRP: A Possible Triangle Is Taking Shape In The 4th WaveXRP: A possible triangle is taking shape in the 4th wave
Since the mid of September 22, the price is developing a corrective pattern.
Considering the shape that it is actually developing it looks like a bullish triangle.
As long as the price is developed within the pattern all is fine for this scenario.
I have set some targets for the bullish move as you may want to lock in profits when the price will rise.
Targets:
🎯 0.50412
🎯 0.52288
🎯 0.55390
🎯 0.59968
🎯 0.64535
Thank you and Good Luck!

Bitcoin | Are You Ready For The 5th Wave?Bitcoin | Are You Ready For The 5th Wave?
The support area close to 20K is holding the price very strong
even after the FOMC statement.
it looks like this could be the bottom for this wave and the price may
rise more during the coming days.
This is a short term trading for some fast profits if the pattern will
perform as expected.
Thank you and Good Luck!

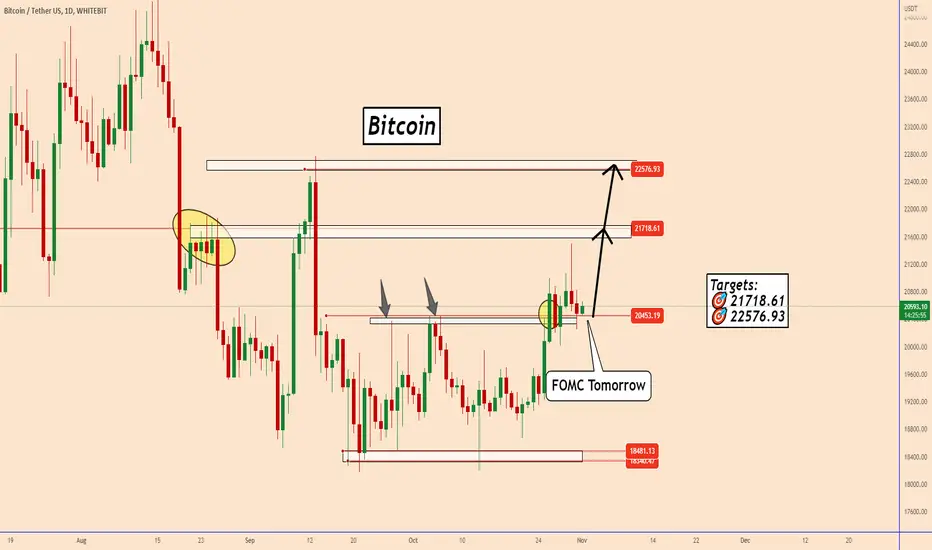
BTC: 20K Support Zone is Keeping The Price Very StrongBTC: 20K Support Zone is Keeping The Price Very Strong
After the price reached 21K we can see that it was broken a major resistance zone.
This is obvious because since the previous week the price correct lower than 20K
and we can say that the buyers are well-positioned in that zone now.
All the focus is on FOMC Press Conference that will be tomorrow.
I am expecting BTC to rise more considering that the accumulated volume was
very high.
Targets:
🎯 21718.61
🎯 22576.93
Thank you and Good Luck!
Dogecoin | The Bullish Wave Could Be An Aggressive OneDogecoin | The Bullish Wave Could Be An Aggressive One
From the chart we can see that Dogecoin is in correction
since a long period of time now.
The price is stopped there and this is showing that we have a lot
of accumulated volume close to that area that stopped the price
to move lower.
A break out above the first structure should help the price to
increase even more.
Thank you and Good Luck!

XRP : Another Bullish OpportunityXRP : Another Bullish Opportunity
During the last days price completed another small bullish triangle pattern.
Actually the price is above he channel and the chances are higher that the
price could rise again.
Also related to the bigger picture the price is developing according to our
expectations.
Targets:
🎯 0.50614
🎯 0.53803
Thank you and Good Luck!

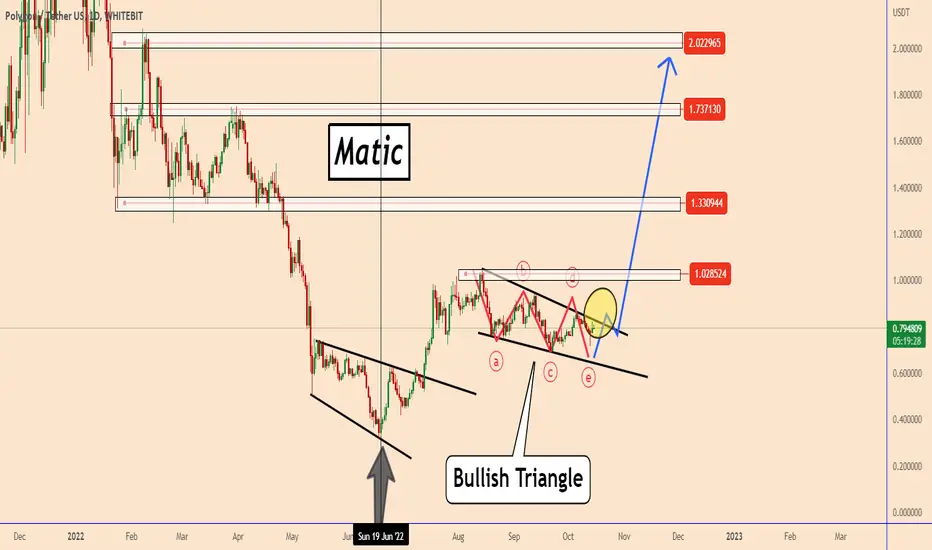
📣MATIC: Price Confirmed The Bullish Pattern📣MATIC: Price Confirmed The Bullish Pattern
During the last two months we can see a very nice bullish triangle pattern
that the price already completed.
On the previous analysis the price was showing sings to confirm the pattern and
now it looks already confirmed and we can see an bullish rally soon.
This is a swing trade so we should be patient with this trade but it will be worth a lot
with time.
Targets on the chart!
Thank you and Good Luck!

📣MATIC: ABCDE Correction Is Almost Completed📣MATIC: ABCDE Correction Is Almost Complete
Since the mid of June price is trying to develop a bullish
wave.
During the last two months we can see a very nice bullish triangle pattern
that looks almost completed.
If the price will manage to breakout above the pattern it will keep
rising further.
Targets on the chart!
Thank you and Good Luck!
ETH: Price May Bounce Between 1440 - 1487ETH: Price May Bounce Between 1440 - 1487
FOMC today is going to create a lot of volatility in all the markets.
Considering that all the markets are quoted in USD it is normal that all
the FOCUS will be on the U.S events.
I am expecting that ETH can do any correction before the price will bounce again
considering the bigger picture.
The buy zone that I am looking at is between 1440 - 1487
Thank you and Good Luck!

New listing WBT token TODAY + The Fed meeting (FOMC)WBT token of the largest European crypto exchange WhiteBit continues to master the crypto space and is listing on other crypto exchanges.
We wrote about what WBT is and why we like the clear tokenomic of the project in our previous idea
WhiteBit team continues "to invade" the crypto market and today will hold the 3rd listing of its own WBT token on another crypto exchange - MEXC
After two previous listings of WBTUSDT on other crypto exchanges, the price of WhiteBit token reacted with growth.
Confident consolidation of the price above $10.25 and possible continuation of growth to one of the levels of $17, $18, or even $21.
On the other hand, now the price of WBTUSDT is close to the critical level - $10.25
Below it, there is no liquidity on the chart, and therefore the price may fall to $6. Therefore, it is also a good trading strategy to put "buckets" there for a possible price fall.
Separately, we would like to highlight and remind you that in 9 hours there will be a Fed meeting - Federal Open Market Committee (FOMC)
- Most likely, the financial markets will perceive the rate increase by the projected +0.75% or less positively.
- If the rate rises by +1% or more than forecast - the financial markets will be absorbed by "the red color".
Today, be careful and cautious when making trading decisions.
_____________________
Did you like our analysis? Leave a comment, like, and follow to get more

WhiteBit Token (WBT) will go insane!Hello, everyone!
Today it’s time to make an analysis on the exchange’s token. Tokens of reliable exchanges almost always good investment. Binance was the most dynamically developing exchange in the previous cycle, but BNB have already shown the huge growth. Today I found the most undervalued token – WBT. WhiteBit exchange is the emitter of the WBT token today is the most dynamically developing crypto exchange. It’s token have been already listed on several exchanges. For example, tomorrow it will be listed on MEXC it will provide an additional liquidity.
Of course fundamental factors are important, but our favorite Elliott waves is the main analysis tool. WBT have the very nice dynamic on the 1D timeframe. After first listing this asset showed the uptrend Elliott waves cycle. It is the very bullish sign in the long term.
When I am going to buy WBT? It is obviously that now WBT have just finished the 5 waves cycle. Of course waves 3 and 5 correspond to divergence on Awesome oscillator. I consciously have not added AO on the chart to make it simple, but you can trust me. In November I am waiting for the ABC correction, which will be the wave 2 of global bullish super cycle. This correction will be ended as I suppose at the Fibonacci golden pocket, approximately at the $8. After that I expect the most impulsive wave 3 which will bring us significant profit.
Today we have a lot of features of incoming correction – decreasing volume and the lack of demand Wyckoff pattern which have already lead to the local pump. Watch out my updates I will tell you when to buy WBT.
Best regards, Ivan

SHIBA: +60% Price Increase in 20 Days😀SHIBA: +60% Price Increase in 20 Days😀
I shared this analysis on October 11, and as we can see the price increased by +60%
Considering the accumulation zone that was showing to be very strong and also that the market
is not giving up from SHIBA Inu this movement was expected at a moment.
So hope you guys closed some good profits on SHIBA 😀
Now the price is still in correction and we can see the next bullish wave to come very soon.
We can see the price to move also a bit lower from were it is now as the market will close profits.
Targets are the same.
Thank you and Good Luck!
Previous Analysis:

APE | The price needs to hold above 4.6 in order to rise furtherAPE | The price needs to hold above 4.6 in order to rise further
As we can see from the chart APE Coin reacted very well during our previous analysis.
Actually the price looks like it is positioned to create a bullish move but it is still
creating and expanding pattern.
Overall the price is in line with our bigger picture and it could rise more during
the coming days.
However the price needs to hold above 4.6 in order to rise further and quickly.
Thank you and Good Luck!
Previous Analysis:

WhiteBIT token. What will WBT price give us in the near future ?WBT token of the largest European crypto exchange WhiteBit continues to master the crypto space and is listing on other crypto exchanges.
We wrote about what WBT is and why we like the clear tokenomic of the project in our previous idea
And today we want to point out an interesting observation
6 days after WBT was listed on Huobi, a price jump of +300% began. Whether it is a coincidence or not, we do not know, but this fact can be seen on the chart, and it is on a sluggish crypto market that is now.
Today another listing, WBTUSDT will appear on the Gate exchange.
We can hardly believe in another growth of +300% in 1-2 weeks, but in our opinion:
1. the minimum program is the growth to $17-21
2. the maximum program is the growth to $40
3. the critical level is $11 per WBT below which a fairly deep correction can begin, so you must be careful and cautious.
_____________________
Did you like our analysis? Leave a comment, like, and follow to get more

ETH : Another Buy Opportunity😁ETH: Another Buy Opportunity😁
Today the DXY looks very strong this strength is favoring the USD dollar against
all the other currencies and cryptocurrencies as well.
We could see any price correction during the weekend by offering us another
buying opportunity:)
Considering that the actual situation on the Crypto market is calm and
it is developing in normal conditions all this bearish move should be a normal
corrective process.
Thank you and Good Luck!

Bitcoin | Hope You Are In This Trade?Bitcoin | Hope You Are In This Trade?
As I explained on yesterday's live stream on trading view price was close
to the first and strongest resistance zone.
Actually, the price just broke through 20500 and it keeps rising more.
I am expecting BTC to rise more considering that the accumulated volume was
very high.
Targets:
🎯 21718.61
🎯 22576.93
Thank you and Good Luck!

XRP | Ripple | A Daily Pattern For a Daily ChartXRP | Ripple | A Daily Pattern For a Daily Chart
Since mid-September when the price started the upward movement
we can see saw it rising with +70%.
Given that the price started the correction and is creating a bullish pattern
we should also wait for the daily bullish pattern before the next strong move.
So we are again in a moment of accumulation.
Thank you and Good Luck!

Ethereum: The Best Time to Join the BullsEthereum: The Best Time to Join the Bulls
During the last month, price is moving within a narrow
trading zone.
It is not one of the best but it is well-defined with a strong support
near 1265 and resistance near 1390.
Price is close to the bottom of the structure again and it could rise further
by giving us another bullish opportunity.
All setups tend to fail, so please don't forget to use the stop loss on each trade.
Targets:
1390
1500
Thank you and Good Luck!

XLM | Stellar Has Been Accumulating Volume Since MayXLM | Stellar Has Been Accumulating Volume Since May
Price is testing the bottom of the pattern for the third time
and thereby creating a potential megaphone pattern.
During the last days, the price increased by about 17%.
A good part of the movement was supported by XRP.
XRP is showing positive developments regarding the lawsuit they have.
This is one of my favorite projects and it should grow further.
Targets:
🎯 0.15072
🎯 0.17021
🎯 0.23681
Thanks and Good Luck!

ETHEREUM: Only a Break Above 1400 Would Mark a Shift HigherETHEREUM: Only a Break Above 1400 Would Mark a Shift Higher
The previous idea for Ethereum was shared when the price was testing the
lower support part of the structure.
Actually the price is testing the resistance zone and by reaching in this way also
our first target.
now the price is showing the potential development of the bearish and the bullish
movement at the same time.
A break out of the price above 1400 would definitely confirm that the price will begin
the next bullish wave.
Thank you and Good Luck!
Previous Analysis:
