WIF/USDT — Price Pressing Into a Make-or-Break Zone?DOGWIFHAT has entered one of the most decisive phases of its entire downtrend. After months of consistent lower-highs beneath the descending trendline, the market is now compressing into the Key Support Zone at 0.38–0.285 — an area that previously acted as a re-accumulation base and a major liquidity sweep level.
This is not just support.
This is the trend-defining battleground.
The descending trendline continues to reject every attempt to recover, creating a tight squeeze between seller pressure from above and buyer defense inside the zone.
This compression often leads to a high-volatility breakout in one direction.
If buyers hold this zone, a structural reversal is on the table with targets rising step-by-step toward:
0.55 → 0.695 → 0.80 → 1.16 → 1.44
If sellers break 0.285 with a clean 4D close, momentum may shift into a fresh markdown, opening downside levels toward:
0.23 → 0.15 → 0.10
The long downward wicks previously seen in this area show liquidity manipulation, confirming that smart money is active and this zone is being defended — or hunted.
The next major move will likely be decided here.
---
🟢 Bullish Scenario
Price holds the 0.38–0.285 zone
Break + 4D close above the descending trendline
Successful retest → bullish reversal confirmed
Upside targets: 0.55 → 0.695 → 0.80 → 1.16 → 1.44
---
🔴 Bearish Scenario
4D close below 0.285
Support flips into resistance
Downside continuation targets: 0.23 → 0.15 → 0.10
#DOGWIFHAT #WIF #CryptoAnalysis #SupportZone #Breakout #CryptoTrend #PriceAction #AltcoinAnalysis
WIFUSDC

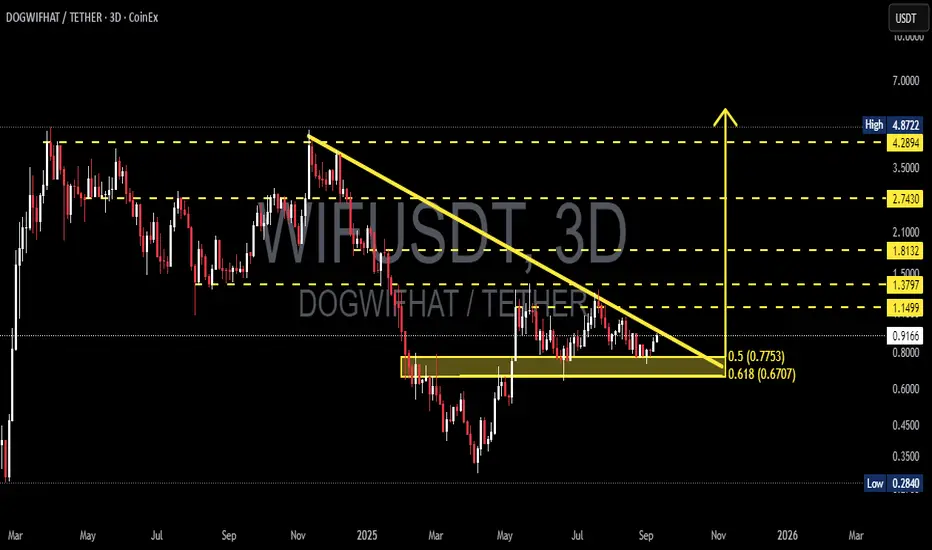
WIF/USDT — The Apex Point: Awaiting a Major Breakout or Breakdow🔎 Overview
The DOGWIFHAT/USDT pair is currently consolidating at a critical junction on the 3-day timeframe (3D). The chart reveals a classic Descending Triangle — a technical pattern formed by consistent lower highs (selling pressure) converging with a strong horizontal support zone.
The essence of this pattern: price is being squeezed into a tighter range (the apex). The longer the compression, the stronger the potential explosive move — either upward or downward.
---
🟢 Bullish Scenario (Breakout Potential)
Trigger: A valid breakout requires a 3D candle close above the descending trendline and ideally a reclaim of 1.1499.
Catalyst: Strong breakout volume plus successful retest of former resistance turned into support.
Upside Targets:
1. 1.1499 → Initial breakout confirmation.
2. 1.3797 → First major upside target (+50% from current price).
3. 1.8132 → Next psychological level (+98% from current price).
4. If momentum sustains, 2.7430 → 4.2894 → 4.8722 could act as medium-term magnets.
👉 Note: As long as price holds above the golden Fibonacci pocket (0.7753–0.6707), bulls maintain a strong chance of reclaiming momentum.
---
🔴 Bearish Scenario (Breakdown Risk)
Trigger: Breakdown confirmed if the 3D candle closes below 0.6707 (Fib 0.618).
Confirmation: Failed attempt to reclaim 0.77 after breakdown.
Downside Targets:
1. 0.45 → Psychological support / liquidity area.
2. 0.2840 → Historical low.
3. Measured Move: Based on the triangle’s height (approx. 0.4792), a textbook target would be ~0.19 — though this requires heavy bearish momentum.
👉 Note: Losing the golden Fibonacci pocket would hand over full control to bears.
---
📌 Pattern & Key Significance
1. Descending Triangle → Statistically leans bearish, but strong reversals are common if broader market sentiment is bullish.
2. Fibonacci Golden Pocket (0.5–0.618: 0.7753–0.6707) → Strong confluence zone; potential accumulation area for bulls.
3. Apex Point → The closer price gets to the apex, the stronger the eventual breakout/breakdown move.
---
🧭 Trading Strategies
Bullish Traders (Breakout Players):
Enter on a confirmed 3D close above 1.1499, preferably after a retest. Target 1.38 and 1.81 with stop loss below 0.95–0.85.
Bearish Traders (Breakdown Players):
Short after a 3D close below 0.6707, with confirmation from failed retest. Targets 0.45 and 0.2840. Stop loss above 0.78.
Swing Traders (Risk-Reward Optimizers):
Consider speculative longs at 0.77–0.67 with tight SL below 0.62, aiming for potential breakout to 1.15+.
---
📊 Key Levels
Critical Support Zone: 0.7753 – 0.6707 (Fibonacci confluence).
Major Resistances: 1.1499 → 1.3797 → 1.8132 → 2.7430 → 4.2894 → 4.8722.
Historical Low: 0.2840.
Pattern: Descending Triangle → approaching resolution.
---
🚀 Conclusion
DOGWIFHAT is at a major crossroads. This descending triangle could serve as a springboard into the next altcoin rally or a trapdoor toward new lows.
The golden Fibonacci pocket (0.77–0.67) is the key battleground. If it holds, bulls have a real shot at reclaiming higher levels. If it breaks, bears will likely dominate the structure.
---
#DOGWIFHAT #WIFI #Crypto #Altcoin #ChartAnalysis #TechnicalAnalysis #DescendingTriangle #SupportResistance #Fibonacci #Breakout #Breakdown
dogwifhat (WIF)Technical Analysis of WIF Coin 🟢
Key Zones and Market Structure:
Main Support (Green Zone):
The long-term market floor lies within the range of 1.393 – 1.482, a zone where buyers have previously entered with strong momentum.
Main Resistance (Red Zone):
The range of 4.015 – 4.346 serves as a significant ceiling, acting as a major barrier to new highs.
Current Price Analysis: The price is currently trading at 2.061 and is attempting to break through the intermediate resistance at 2.178 – 2.268 with sufficient buying volume. The price's reaction to this level will determine its short-term direction.
Bullish Scenario:
✅ First Target (TP1):
If the current resistance is broken and the price moves past the 2.178 – 2.268 range, the next likely move will be toward the 2.821 – 2.989 area.
✅ Second Target (TP2):
Should the price continue with high volume and break through TP1, the final target will be in the range of 4.015 – 4.346, which represents the ideal exit point.
Key Point: Trading volume must increase during key level breaks; otherwise, the risk of a false breakout (fakeout) rises.
Bearish Scenario:
❌ Stage 1:
If the current resistance holds, the price may decline to the support range of 1.741 – 1.828.
❌ Stage 2:
If the gray support level is breached, the next support target will be at 1.393 – 1.482.
Key Point: A decrease in trading volume near key support levels could signal a deeper price drop.
Volume Analysis:
Volume increase near key zones (resistances and supports) is essential.
A decrease in volume when attempting to break resistance increases the likelihood of a fakeout.
RSI and Momentum Analysis:
📉 RSI Trendline:
Breaking the descending RSI trendline, along with crossing the 50 level, could confirm the beginning of a bullish wave.
📈 Overbought Zone:
If RSI enters the 76.86 – 80.48 range, the price may face corrective pressure in the upper resistance zones.
Suggested Strategy for Professional Traders:
Enter the market only after a confirmed breakout of resistance with high volume.
Use a scaling-in strategy to minimize risk.
Set stop-loss orders below key support zones to protect capital.
Final Summary:
This analysis identifies the key levels and possible scenarios for WIF Coin. Price action around critical support and resistance zones, combined with trading volume, will determine the future trend. For market entry, wait for confirmation of breaks or reactions at the specified levels.

WIF is about pump or dump?Hello people im just here to show you some good plans or something like opportunity haha
So please aware about capital management and always have some good stop losses on your positions!
Here we have wif with 2 scenarios but my main is breaking the triangle from top corner but if you see deeply you have M(double top) pattern completing haha
So what's your idea please write me:)

$Wif has 3rr long setup hereHello guys,
one of the best memecoin is here,
long or buy it to make money for you.
