WIFUSDT IDEAHello Traders Hope You Are Enjoying Our Analysis. Today We Will Discuss About WIF
(Update)
The Symmetrical Triangle Formation On 12H Chart✅
Incase Of Breakout It Will Pump Massively✍️

WIFUSDT Elliott Waves AnalysisHello friends.
Please support my work by clicking the LIKE button👍(If you liked). Also i will appreciate for ur activity.
Everything on the chart.
Still waiting for last upward movement in final wave of (v).
Entry: Market and lower
Targets: 5 - 7 - 10
after first target reached move ur stop to bre

Last chance to long Wif, Enjoy!Wif long setup with a tight setup..
ready to break the trend line if this low holds its good to go.

Wif will push towards range highsWif will push towards range highs if btc macro bottom is in which is very likely..
Put a stop below support. Cheers

WIF Bearish Scenario WIF Bearish Scenario
Pullback from Resistance trendline
Waiting for Breakdown of support trendline.
Breakdown of high volume

#WIF/USDT breaks the Trendline to fill the 4-Hour FVG gap and bo#WIF/USDT breaks the Trendline to fill the 4-Hour FVG gap and bounces back.
CRYPTOCAP:WIF is looking strong here. #WIFUSDT needs to hold this zone to gain bullish momentum. The major resistance level is PWH $3.2165 and the support level is PWL $2.257.
WIFUSDT IDEAHello Traders Hope You Are Enjoying Our Analysis. Today We Will Discuss About WIF
(Update)
The Bullish Flag Has Breakout in 8H Timeframe✅
Expecting Massive Bullish Wave Towards 70% Profit So Far In Coming Days✍️

WIFUSDT UPDATE #WIFUSDT
UPDATE
Running as Expected 20%profit done ✅
Expecting more in coming days 📈
#WIFUSDT #WIF #WIFBTC #BTC #Crypto CRYPTOCAP:WIF
CRYPTOCAP:DEXE $QI LSE:SYN INDEX:GALA TSXV:POND $SPELL GETTEX:PDA $BADGER $CYBER NYSE:FET SEED_DONKEYDAN_MARKET_CAP:AGIX SEED_DONKEYDAN_MAR

WIF/USDT 4HOUR CHART UPDATE !!Hello friends, welcome to this WIF/USDT update from Crypto Sanders.
Chart Analysis:- Hello friends, what do you think after seeing the chart? Please comment on the WIF/USDT 4-HOUR update.
Currently, WIF is traversing within the confines of a symmetrical triangle pattern. Recent price action indica

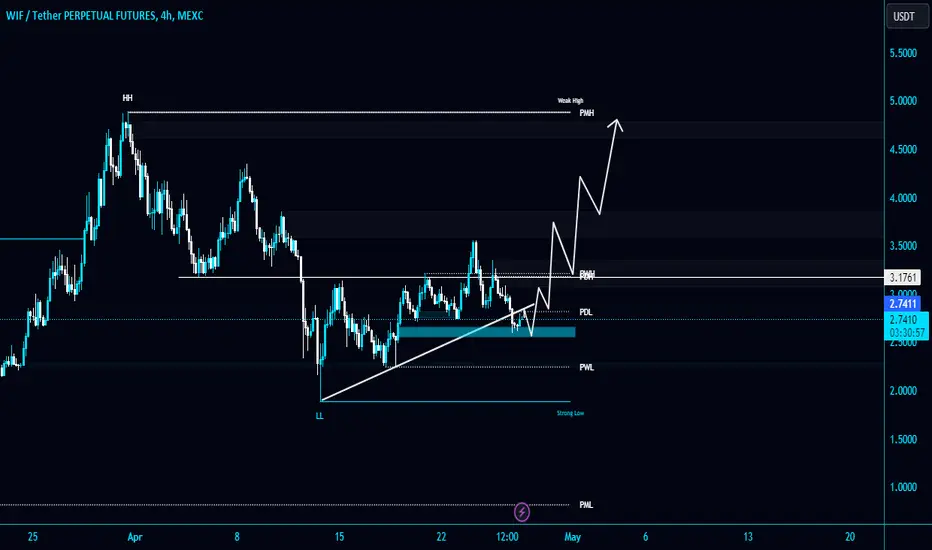
WIFUSDT Bullish Wif is looking bullish, recently hit ath and has been in distrobution going down 50%. Bounced of support at 2.3 and recently broke the downwards trend and is currently retesting. If the retest holds we can expect a new ath at 5usd which is a psychological level. in a couple of weeks.
R:R 5
SL :4H

See all ideas