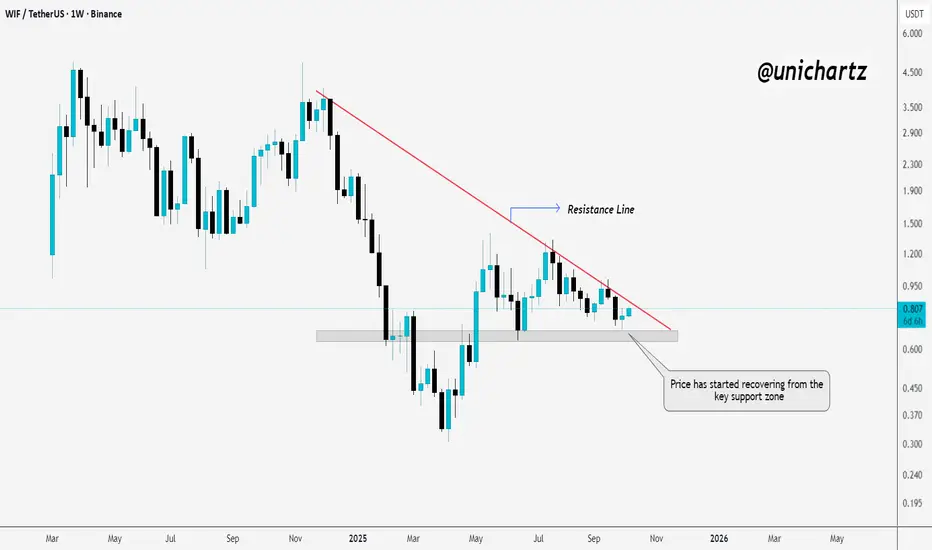
WIF Weekly Reversal SetupSEED_WANDERIN_JIMZIP900:WIF is showing early signs of strength after bouncing from the key support zone.
A breakout above the descending resistance line could confirm a fresh bullish wave.
DYOR, NFA
#PEACE
Wifusdtidea
WIF/USDT — The Apex Point: Awaiting a Major Breakout or Breakdow🔎 Overview
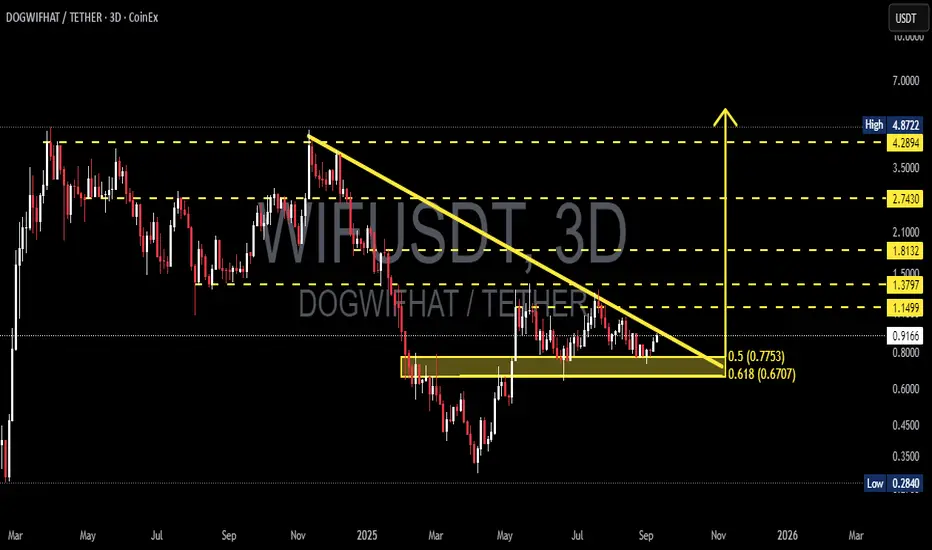
The DOGWIFHAT/USDT pair is currently consolidating at a critical junction on the 3-day timeframe (3D). The chart reveals a classic Descending Triangle — a technical pattern formed by consistent lower highs (selling pressure) converging with a strong horizontal support zone.
The essence of this pattern: price is being squeezed into a tighter range (the apex). The longer the compression, the stronger the potential explosive move — either upward or downward.
---
🟢 Bullish Scenario (Breakout Potential)
Trigger: A valid breakout requires a 3D candle close above the descending trendline and ideally a reclaim of 1.1499.
Catalyst: Strong breakout volume plus successful retest of former resistance turned into support.
Upside Targets:
1. 1.1499 → Initial breakout confirmation.
2. 1.3797 → First major upside target (+50% from current price).
3. 1.8132 → Next psychological level (+98% from current price).
4. If momentum sustains, 2.7430 → 4.2894 → 4.8722 could act as medium-term magnets.
👉 Note: As long as price holds above the golden Fibonacci pocket (0.7753–0.6707), bulls maintain a strong chance of reclaiming momentum.
---
🔴 Bearish Scenario (Breakdown Risk)
Trigger: Breakdown confirmed if the 3D candle closes below 0.6707 (Fib 0.618).
Confirmation: Failed attempt to reclaim 0.77 after breakdown.
Downside Targets:
1. 0.45 → Psychological support / liquidity area.
2. 0.2840 → Historical low.
3. Measured Move: Based on the triangle’s height (approx. 0.4792), a textbook target would be ~0.19 — though this requires heavy bearish momentum.
👉 Note: Losing the golden Fibonacci pocket would hand over full control to bears.
---
📌 Pattern & Key Significance
1. Descending Triangle → Statistically leans bearish, but strong reversals are common if broader market sentiment is bullish.
2. Fibonacci Golden Pocket (0.5–0.618: 0.7753–0.6707) → Strong confluence zone; potential accumulation area for bulls.
3. Apex Point → The closer price gets to the apex, the stronger the eventual breakout/breakdown move.
---
🧭 Trading Strategies
Bullish Traders (Breakout Players):
Enter on a confirmed 3D close above 1.1499, preferably after a retest. Target 1.38 and 1.81 with stop loss below 0.95–0.85.
Bearish Traders (Breakdown Players):
Short after a 3D close below 0.6707, with confirmation from failed retest. Targets 0.45 and 0.2840. Stop loss above 0.78.
Swing Traders (Risk-Reward Optimizers):
Consider speculative longs at 0.77–0.67 with tight SL below 0.62, aiming for potential breakout to 1.15+.
---
📊 Key Levels
Critical Support Zone: 0.7753 – 0.6707 (Fibonacci confluence).
Major Resistances: 1.1499 → 1.3797 → 1.8132 → 2.7430 → 4.2894 → 4.8722.
Historical Low: 0.2840.
Pattern: Descending Triangle → approaching resolution.
---
🚀 Conclusion
DOGWIFHAT is at a major crossroads. This descending triangle could serve as a springboard into the next altcoin rally or a trapdoor toward new lows.
The golden Fibonacci pocket (0.77–0.67) is the key battleground. If it holds, bulls have a real shot at reclaiming higher levels. If it breaks, bears will likely dominate the structure.
---
#DOGWIFHAT #WIFI #Crypto #Altcoin #ChartAnalysis #TechnicalAnalysis #DescendingTriangle #SupportResistance #Fibonacci #Breakout #Breakdown
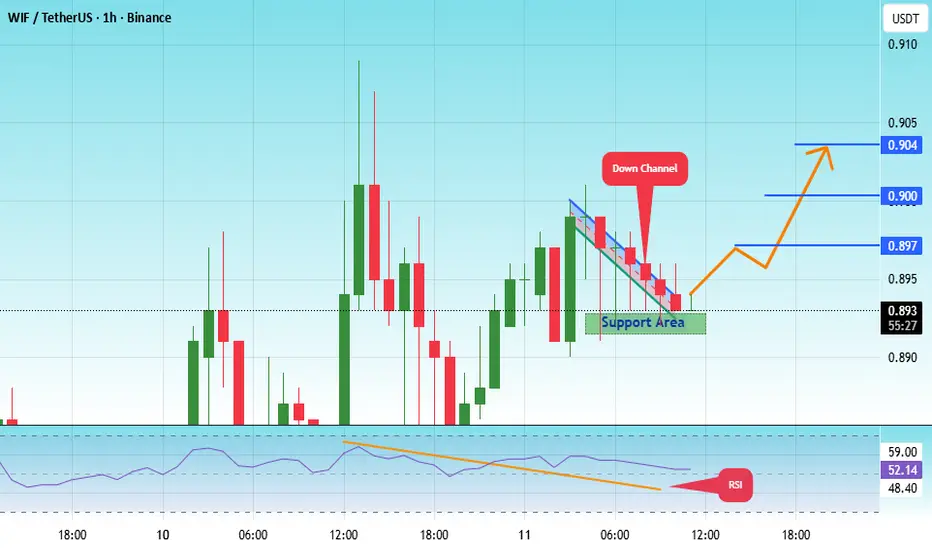
#WIF/USDT Forming Descending Channel#WIF
The price is moving within a descending channel on the 1-hour frame, adhering well to it, and is heading for a strong breakout and retest.
We have a bearish trend on the RSI indicator that is about to be broken and retested, which supports the upward breakout.
There is a major support area in green at 0.890, representing a strong support point.
For inquiries, please leave a comment.
We are in a consolidation trend above the 100 moving average.
Entry price: 0.893
First target: 0.897
Second target: 0.900
Third target: 0.905
Don't forget a simple matter: capital management.
When you reach the first target, save some money and then change your stop-loss order to an entry order.
For inquiries, please leave a comment.
Thank you.
WIF/USDT Technical UpdateBINANCE:WIFUSDT has successfully broken out of the falling wedge 📉➡️📈 and has already completed a clean retest of the breakout zone ✅.
Currently price action is forming a potential ABC corrective wave structure (Elliott Wave count), with:
🅰️ Wave (A) aiming toward the 0.84–0.85 resistance zone
🅱️ Wave (B) likely testing support around the breakout area (~0.80)
🅾️ Wave (C) targeting the major resistance zone at 0.93–0.94
Key confluences:
✨ Bullish market structure shift after wedge breakout
✨ Support-turned-resistance flip successfully tested
✨ Momentum favors the upside if BTC continues bullish momentum 🟢
📌 Watch out for BTC’s move — if BTC pumps, WIF has a high probability to continue rallying toward 0.93–0.94 🎯
⚠️ Invalid below 0.78 support zone

WIFUSDT — Critical Demand Zone: Bounce or Breakdown?Currently, WIFUSDT is trading around 0.7605 and retesting the major demand zone (~0.62 – 0.78) — a level that previously acted as strong resistance before flipping into support.
The price action here will determine the medium-term direction:
Either a bullish reversal fueled by accumulation,
Or a bearish continuation if this zone fails.
---
🔎 Market Structure & Pattern
1. Macro Trend:
From late 2024 to early 2025, WIF faced a strong downtrend.
A sharp rebound in March–May 2025 pushed the market into a consolidation range.
Since then, the chart has been forming lower highs, showing persistent selling pressure.
2. Critical Flip Zone (0.62 – 0.78):
Previously acted as heavy resistance.
Flipped into support after a breakout in May.
Now being retested as a decisive level.
3. Potential Reversal Formation:
Holding this zone may form a double bottom / base pattern → bullish setup.
Losing this zone could trigger a continuation breakdown toward new lows.
---
🟢 Bullish Scenario
Confirmation: Daily close above 0.75–0.78 with a strong bullish candle.
Upside targets:
1.0251 → nearest resistance.
1.2008 → major consolidation area.
1.8468 – 2.1772 → mid-term resistance levels.
Ideal setup: Retest & bounce with rising volume, forming a higher low.
---
🔴 Bearish Scenario
Confirmation: Daily close below 0.62 with strong follow-through.
Downside targets:
0.50 → psychological level & minor demand.
0.3040 → major low from the chart.
Ideal setup: Breakdown → retest of yellow zone as resistance → rejection → continuation downtrend.
---
⚖️ Key Notes
The yellow zone (0.62 – 0.78) is the decision zone for WIF.
Breakout or breakdown here will likely trigger strong momentum.
Aggressive traders: may enter inside the zone with a tight SL below 0.62.
Conservative traders: wait for a daily close confirmation with volume.
Always use risk management — WIF is highly volatile.
---
✍️ Conclusion
WIFUSDT is at a strategic turning point:
Holding above support could trigger a bullish reversal toward 1.02 → 1.20.
Losing this zone could open the door to deeper downside toward 0.40 – 0.30.
The next daily close will be crucial for validating direction.
#wifusdt #dogwifhat #cryptoanalysis #altcoins #supportresistance #demandzone #bullishscenario #bearishscenario #cryptotraders #priceaction #technicalanalysis

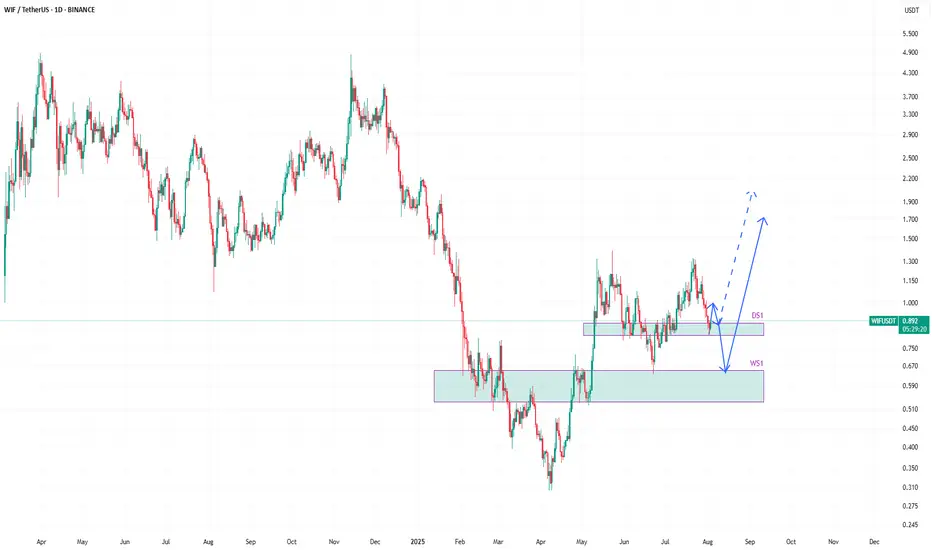
WIFUSDT to bounce from weekly support around 0.60#WIF #WIFUSD #WIFUSDT SEED_WANDERIN_JIMZIP900:WIF
On WIFUSDT, I see two possibilities for the upcoming price action.
The price has tapped into daily support DS1 and it is currently bouncing from there.
The first path suggests that this is the start of the reversal and upward journey continuation. But I am not very inclined to that possibility.
The second path suggests that the price will go down further to weekly support zone WS1 after the current bounce from DS1 is exhausted.
I am more inclined on the second path. This will allow a bounce with enough strength to make the price move beyond the current highs. And that bounce from weekly support WS1 will be a real breakout and allowing the price to move beyond 1.5 and so on.
Memecoin with potential for purchase.Hello friends🙌
Considering the decline we had in the weekly timeframe, you can now see that with the good growth we had, it gives us a good signal to buy, of course in a stepwise manner and with capital and risk management.
🔥Follow us for more signals🔥
*Trade safely with us*

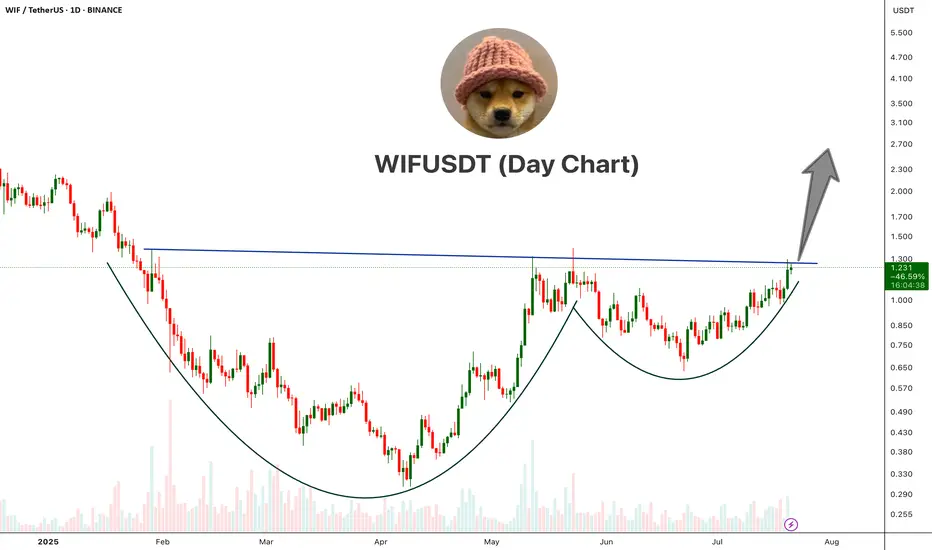
WIFUSDT Cup And Handle PatternWIF is showing a classic Cup and Handle pattern on the daily chart, a strong bullish reversal setup.
The price has broken above the neckline resistance around the $1.25–$1.30 area with bullish momentum. This breakout, if sustained with volume confirmation, could open the doors for a major upside move.
Cheers
Hexa
BINANCE:WIFUSDT
$WIF just gearing for a new ATH! Not expecting much of a retrace on BINANCE:WIFUSDT — more likely we get consolidation against resistance.
This current level is crucial, and likely to form the base for either:
• A new ATH, or
• At minimum, a third retest of the $4.5–5 zone.
The broader market continues to push higher, and with Bitcoin Dominance breaking down, things could get very interesting in the coming months.
📌 Plan:
• Waiting on a clean retrace (as per second entry... previous post)
• Or a reclaim of the purple block to add to the position

Price explosion is coming?Read carefullyhello friends👋
We have come to analyze a popular Kuwaiti meme that you have asked to analyze a lot.
🌟Well, according to the drop we had, it can be seen that the buyers came in and formed a good upward wave, and after that, Femt entered a channel, which can be said to be a flag pattern...🧐
Now, according to the formed channel, we can enter into a purchase transaction with capital and risk management in case of a valid failure of the channel.
🔥Follow us for more signals on Bolran.🔥
*Trade safely with us*

WIFUSDT Forming Breakout Descending ChannelWIFUSDT is showing an exciting technical setup as it breaks free from a prolonged downward channel and consolidates near a strong support zone. This breakout pattern signals that the coin could be on the verge of a significant trend reversal, supported by healthy trading volume and renewed investor confidence. With buyers defending key levels and pushing the price above resistance, WIF is capturing the attention of traders looking for high-momentum plays.
Looking at the chart, WIFUSDT’s recent price action suggests that the base has formed well within the highlighted demand zone, providing a solid foundation for a sharp upward move. The breakout from the descending channel is a classic sign of trend change, and this technical shift is further reinforced by steady volume and bullish sentiment across social platforms. Traders should keep an eye on retests of the breakout zone for potential entry opportunities, as these could offer excellent risk-to-reward setups.
The potential gain of 140% to 150%+ makes WIFUSDT a top pick for those scanning the market for trending coins with breakout potential. The meme coin community remains highly active around WIF, and this fresh surge in interest could propel the coin to test its next major resistance levels in the coming weeks. As always, risk management and closely monitoring price action will be key to riding this bullish wave successfully.
✅ Show your support by hitting the like button and
✅ Leaving a comment below! (What is You opinion about this Coin)
Your feedback and engagement keep me inspired to share more insightful market analysis with you!

WIF/USDT – Major Breakout Incoming! Potential Upside Over +400%!Technical Analysis:
The WIF/USDT (dogwifhat / Tether) pair on the 1D timeframe is currently showing signs of a bullish breakout from a well-defined descending channel that has formed over the past few months.
📌 Key Highlights:
Price has been consolidating within a descending channel since March 2025.
It is now attempting to break out above the upper boundary of the channel – a strong bullish signal.
The breakout is forming after a strong bounce from the $0.70–$0.75 support zone, indicating accumulation and potential trend reversal.
📈 Resistance Levels (Target Zones):
1. $1.0251 – first key resistance to watch.
2. $1.2008 – minor resistance, ideal short-term target post-breakout.
3. $1.8468 – major historical resistance level.
4. $2.1772 – key psychological and technical level.
5. $2.9503 – extended bullish target.
6. $4.1525 – maximum bullish projection in case of parabolic move.
📉 Support Levels:
$0.8627 – current price level.
$0.70–$0.75 – previous strong support zone and lower channel base.
📊 Strategy Insight:
A potential entry could be considered on a confirmed breakout and retest around $1.02.
Targets can be scaled based on resistance levels mentioned above.
Use proper risk management and stop-loss below the channel to avoid fakeouts.
Conclusion:
WIF/USDT is showing a strong bullish reversal structure, breaking out from a mid-term descending pattern. This could be the beginning of a massive upward impulse, with over +400% potential gain if key targets are reached. A critical moment for traders and investors to pay attention!
#WIFUSDT #WIFBreakout #CryptoAnalysis #AltcoinSeason #Dogwifhat #BullishSetup #BreakoutAlert #CryptoTrading #CryptoSignals #WIFArmy

WIFUSDT Forming Classic Wedge WIFUSDT has recently formed a classic wedge pattern, a powerful technical indicator often associated with upcoming breakouts. Wedge patterns, especially those with tightening price action and consistent volume, suggest a coiled market preparing for a strong directional move. In the case of WIFUSDT, this wedge structure is showing all the right characteristics for a bullish breakout, supported by growing trading volume and increasing investor interest.
The price structure within the wedge is narrowing, indicating a possible compression before expansion. This typically precedes a sharp breakout, and current market behavior around WIFUSDT suggests bulls are positioning themselves for a significant upside move. Technical projections show a strong potential for gains ranging between 140% to 150%+, especially if the breakout is accompanied by momentum confirmation on higher timeframes.
What adds to the bullish thesis is the noticeable uptick in trading volume, which confirms that accumulation might already be underway. When volume supports a pattern breakout, it often adds strength and sustainability to the move. With market sentiment slowly shifting and capital rotating into altcoins, WIFUSDT stands out as a high-potential candidate in the current environment.
WIFUSDT is quickly becoming a favorite among breakout traders and short-term investors looking to ride explosive setups. If the wedge breaks to the upside as expected, it could mark the beginning of a strong rally phase. Traders may want to monitor closely for entry signals as the breakout unfolds.
✅ Show your support by hitting the like button and
✅ Leaving a comment below! (What is You opinion about this Coin)
Your feedback and engagement keep me inspired to share more insightful market analysis with you!

They brought it down for the fill — now it's time to see who’s rBINANCE:WIFUSDT just reacted perfectly off the 0.618 golden zone at 0.827 with bullish intent. The STB 1D and FVG 1D combo formed a high-probability demand zone that Smart Money won't ignore lightly.
Here’s the bullish roadmap:
Entry: 0.788 (bottom wick through 0.618 fib)
Structure: Clear higher low with mitigation of FVG 1D
Volume: Climax candle into key levels — classic absorption
Targets:
TP1: 0.921 (mid-level fib and consolidation ceiling)
TP2: 1.015 - 1.132 (FVG to OB 1D imbalance fill)
TP3: 1.321 (full expansion target — optimal trade entry delivery)
Moonshot: 1.393 if bulls dominate past OB retest
Invalidation: Daily close below 0.692 (STB 1D)
Price doesn’t just reverse — it transfers power. This is that shift.
For more plays just like this — all based in structure and timing — check the profile for setups that speak precision, not prediction.

This wasn’t a bounce. It was a reclaim.BINANCE:WIFUSDT.P hit the daily OB at 0.8330 and snapped back — not with hope, but with intent.
Smart Money didn’t panic on the drop. It positioned.
Here’s the structure:
Price tapped a clean D OB, aligned perfectly with 0.618 fib — the algorithm’s comfort zone
The bounce reclaimed 1.00 fast, and the market is now flirting with internal liquidity near 1.0178 and 1.1339
Above, the real draw sits at 1.3965 — a void yet to be filled
Below, we still have W OB liquidity near 0.7260 if this rotation fails
This move doesn’t need hype. It needs follow-through. If we consolidate above 0.9299 and break into 1.0178 clean, the next phase unlocks — straight into the 1.13–1.32 range.
Execution plan:
Bias remains bullish above 0.92
Pullbacks into 0.89–0.83 are still valid long zones as long as 0.7260 doesn’t get breached
Target 1.1339 first — then 1.3965 as the higher timeframe liquidity magnet
This setup isn’t emotional. It’s engineered. You don’t need to guess when price is built to deliver.
More trades like this — real levels, real invalidations — are in the profile description.

WIFUSDT 1D Analysis WIF ~ 1D Analysis
#WIF Buy gradually after successfully breaking through this resistance line with a short-term target of at least 15%++

#WIF/USDT#WIF
The price is moving in a descending channel on the 1-hour frame and is adhering to it well and is heading to break it strongly upwards and retest it
We have a bounce from the lower limit of the descending channel, this support is at a price of 0.650
We have a downtrend on the RSI indicator that is about to break and retest, which supports the rise
We have a trend to stabilize above the moving average 100
Entry price 0.671
First target 0.716
Second target 0.751
Third target 0.800

WIFUSDT 1WWIF ~ 1W Analysis
#WIF Buy back from here with a short-term target of at least 15%+.
This is a very strong support level for now.

WIF /USDT Long SL -14.12%WIF/USDT Long Setup ( Retake )
Reason:
Breakout and Confirmation done in Internal Structure.
Strong Bullish bullish momentum with high Volume.
All technical Parameters suggesting a strong Bullish Wave.
After Successfully breakout from wedge, we can Expect a 40% bullish wave.
Pro Tips:
After Target 2, Move Stoploss to breakeven
HODL
Best Regards,
The Panda
BINANCE:WIFUSDT
MEXC:WIFUSDT
BINANCE:WIFUSDT.P
KUCOIN:WIFUSDT
BITGET:WIFUSDT.P
BINGX:WIFUSDT.P

WIF / USDT : Retesting Trendline after breakout WIF/USDT: Retesting Trendline Support After Breakout – Bullish Continuation Ahead?
WIF/USDT is in a crucial phase 📈 as it successfully broke above a key trendline resistance and is now undergoing a retest 📊. This retest could confirm the breakout’s strength, paving the way for further bullish momentum 🚀. If buyers step in at this support level, we could see an explosive move to the upside. Keep a close watch 👀 on how the price reacts to this level.
Key Insights:
1️⃣ Trendline Retest: WIF/USDT has broken out and is now testing the previous resistance as support. Holding this level is critical for confirming a sustained bullish move.
2️⃣ Volume Confirmation: A strong bounce with increasing volume 🔥 would indicate renewed buyer interest and validate the breakout.
3️⃣ Bullish Indicators: RSI and MACD remain in bullish territory ⚡, supporting the potential for further upside if the retest holds.
Steps to Confirm the Retest:
✅ Look for a strong 4H or daily candle bounce from the trendline support.
✅ A surge in volume at the retest level strengthens the bullish case.
✅ If WIF/USDT flips the trendline into solid support, it could trigger a strong upward push.
⚠️ Be wary of failed retests or price closing back below the trendline, which could indicate weakness.
Risk Management Strategies:
🔒 Use stop-loss orders to protect against unexpected reversals.
🎯 Adjust position sizing based on overall risk tolerance.
This analysis is for educational purposes only and not financial advice. Always DYOR 🔍 before making investment decisions.

WIFUSDT 2DWIF ~ 2D Analysis
#WIF If this support block is tested, This will be a very good place of buy. with a minimum target of 20%+.

WIF/USDT – Was That a Fake Breakdown? WIF/USDT – Was That a Fake Breakdown?
WIF showed signs of a breakdown, but it might have been a fake move.
I expect the price to rise soon for the short term. No need to wait for dips, buy and hold. WIF is ready to break out of this zone.
DYOR and trade accordingly.

WIFUSDT 2DWIF ~ 2D
#WIF So far it continues to maintain this support block. It looks like this support block is a very good Accumulation zone for now. with a minimum target of 20%+
