WLFIUSDT Forming Falling WedgeWLFIUSDT is showing a strong technical setup as it forms a classic falling wedge pattern, which is typically seen as a bullish reversal signal. After a period of downward consolidation, the price is now narrowing within the wedge, indicating that selling pressure is weakening while buyers are gradually gaining control. This structure often precedes a significant breakout to the upside, with traders anticipating a potential gain of around 140% to 150% once a confirmed breakout occurs.
The trading volume remains consistently good, showing that market participants are actively engaging with WLFIUSDT. The steady rise in volume during consolidation suggests accumulation by smart money, which often leads to sharp bullish moves once key resistance levels are broken. This technical setup aligns perfectly with the current market environment, where traders are increasingly looking for undervalued assets showing strong reversal potential.
Investor sentiment toward WLFIUSDT has been improving as interest continues to grow across multiple exchanges. Many are recognizing the coin’s long-term potential, supported by technical strength and a recovering broader market. If momentum continues, WLFIUSDT could soon confirm its breakout from the falling wedge, setting the stage for a major bullish rally in the coming sessions.
✅ Show your support by hitting the like button and
✅ Leaving a comment below! (What is You opinion about this Coin)
Your feedback and engagement keep me inspired to share more insightful market analysis with you!
Wlfiusdtlong

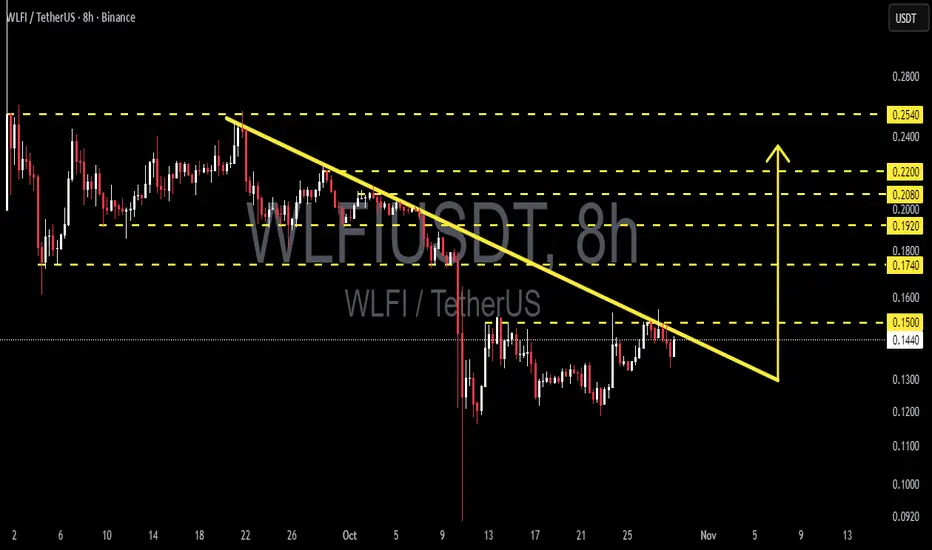
WLFI/USDT — Ready to Explode from Final Consolidation Zone?After weeks of staying under heavy selling pressure within a descending trendline, WLFI is finally showing early signs of life around the 0.13–0.14 demand zone.
The current structure indicates a phase of capitulation followed by silent accumulation, where sellers are losing strength while smart money gradually steps in.
A clear series of lower highs has formed since early October, pressing the price down under a strong descending resistance line (yellow) — and now, price is testing that barrier once again.
A confirmed breakout from this line could mark the beginning of a mid-term trend reversal.
---
Pattern Structure
The chart reveals a descending triangle pattern that’s losing momentum, combined with a potential double-bottom formation near 0.13.
If WLFI manages to break and close above the yellow trendline with solid 8H candle confirmation, the market could shift decisively to bullish territory.
---
Bullish Scenario
If price successfully breaks and closes above 0.1500, momentum will flip in favor of the bulls.
A confirmed breakout could unlock the next targets:
0.1740 – 0.1800 → first breakout zone,
0.1920 – 0.2000 → medium-term expansion area,
0.2200 – 0.2540 → final swing target zone.
Additional confirmation signals:
Rising breakout volume,
8H or daily candle closing firmly above trendline,
RSI & MACD showing early bullish crossover from neutral zone.
This scenario could signal the end of accumulation and the start of a new impulsive wave.
---
Bearish Scenario
If price fails to break the descending line and gets rejected again, the 0.13–0.12 zone becomes the last defense for bulls.
A breakdown below 0.1200 would re-confirm bearish control, targeting:
0.10 as the next liquidity pool,
and possibly 0.0920 if another liquidation spike occurs.
Rejection at the trendline would reinforce seller dominance and continue the broader downtrend until a new higher low forms.
---
Technical Conclusion
WLFI is standing at a make-or-break level, where just one decisive candle can flip the entire structure from bearish to bullish.
This setup is ideal for position traders seeking early accumulation before full breakout confirmation.
However — caution is key.
A breakout without volume is a trap, and a breakdown without confirmation could be a fakeout.
Watch the price reaction closely around the descending trendline, as this is where the next major move will be defined.
---
#WLFI #WLFIUSDT #CryptoBreakout #TrendlineResistance #CryptoAnalysis #ChartPattern #TechnicalAnalysis #CryptoTrading #AltcoinSetup #SwingTrade #SupportResistance #MarketStructure
WLFIUSDT Forming Falling WedgeWLFIUSDT is currently forming a falling wedge pattern a well-known bullish reversal setup often seen before a strong upward breakout. This technical structure suggests that the recent downtrend is losing strength, with sellers gradually losing momentum while buyers start stepping in at key support levels. As the price continues to consolidate within the narrowing wedge, traders are watching closely for a breakout confirmation that could trigger a major bullish move in the coming sessions.
The trading volume remains strong, reflecting healthy participation and growing investor confidence. Typically, a falling wedge followed by an increase in buying volume signals the start of a trend reversal. With an expected gain ranging from 140% to 150%+, WLFIUSDT presents a potentially high-reward setup for traders who are eyeing mid-term opportunities. This volume-backed price action reinforces the view that momentum could soon shift decisively to the upside, making WLFI a strong candidate for bullish continuation once the breakout is confirmed.
Investors are showing renewed interest in the WLFI project, driven by its increasing visibility and potential in the broader crypto market. As optimism builds and technical conditions align, WLFIUSDT could become one of the standout performers in the upcoming market cycle. If the breakout sustains above resistance, it may pave the way for a significant rally, attracting both short-term traders and long-term investors looking for promising opportunities in emerging digital assets.
✅ Show your support by hitting the like button and
✅ Leaving a comment below! (What is You opinion about this Coin)
Your feedback and engagement keep me inspired to share more insightful market analysis with you!

WLFI (SIGNAL)
Hello friends
Regarding the price flooring in the specified support area and the creation of higher floors, it can be said that if the specified resistance is broken, the price can move to the specified targets.
*Trade safely with us*

WLFI/USDT — Ascending Triangle Pressing: Major Breakout?📊 Full Analysis
The WLFI/USDT pair on the 4-hour timeframe is forming a clear Ascending Triangle pattern:
A strong horizontal resistance around 0.2410, repeatedly tested but not yet broken.
Higher Lows along the ascending trendline (yellow) show growing buyer strength and continuous accumulation.
This structure is a classic bullish continuation pattern, signaling that the market is building momentum for a potential breakout.
Still, crypto markets are never one-sided. Failure to break higher could lead to a sharp rejection or even a breakdown.
---
🟢 Bullish Scenario
1. A valid breakout occurs if the 4H candle closes above 0.2410–0.245 with strong volume.
2. If confirmed, upside targets based on the measured move are:
Conservative target: 0.28 – 0.30
Full measured move: 0.30 – 0.32
3. Watch for a possible retest of 0.241 as new support. A successful retest bounce would reinforce bullish continuation.
---
🔴 Bearish Scenario
1. If the price fails to break 0.2410, a rejection may send it back toward the ascending trendline support.
2. A confirmed breakdown below 0.225–0.228 invalidates the ascending triangle.
3. Bearish downside levels to watch:
First support zone: 0.20
Major support: 0.161 (previous significant low).
---
🎯 Key Levels
Resistance zone: 0.2410 – 0.245
Dynamic trendline support: 0.225 – 0.228
Next supports: 0.20 → 0.161
Bullish targets: 0.28 – 0.32
---
⚖️ Conclusion
WLFI/USDT is at a critical crossroads. The Ascending Triangle signals that buyers are steadily pressuring resistance. A confirmed breakout above 0.2410 with volume could unlock the path toward 0.30–0.32.
However, failure at resistance combined with a trendline breakdown could trigger a correction back to 0.20 or even 0.161.
Best strategy: wait for confirmation (breakout or breakdown), manage risk carefully, and scale out profits at key target levels.
---
#WLFI #WLFIUSDT #Crypto #Altcoin #AscendingTriangle #ChartPattern #Breakout #Bullish #Bearish #SupportResistance #PriceAction #TechnicalAnalysis

WLFIUSDT Forming Bullish MomentumWLFIUSDT is showing strong signs of bullish momentum with a clear bullish wave pattern forming on the chart. The recent price action suggests accumulation, backed by consistent trading volume, which is a positive indicator of potential continuation to the upside. Market sentiment appears to be shifting in favor of buyers, and investors are increasingly taking interest in this project.
With volume support and improving technicals, WLFIUSDT holds the potential for a significant upside move in the coming sessions. The bullish wave pattern highlights the possibility of breaking key resistance levels, which could trigger a strong rally. Technical traders are closely watching for confirmation candles to validate this move and drive momentum further.
If bullish pressure continues, WLFIUSDT may deliver impressive returns with an expected gain range of 90% to 100%+. This setup provides traders with a favorable risk-to-reward opportunity, making it an attractive pair to monitor in the current market environment. Long-term investors also view this development as a chance to accumulate before a larger breakout unfolds.
✅ Show your support by hitting the like button and
✅ Leaving a comment below! (What is You opinion about this Coin)
Your feedback and engagement keep me inspired to share more insightful market analysis with you!

Play the LONGTERM GAME with $WLFIPlay the LONGTERM GAME with TSXV:WLF
Remember that $TRUMP did 17x
$WLFI is going to 20usd - that's 92X
STOP SHORTING TODAY
Think LONGTERM

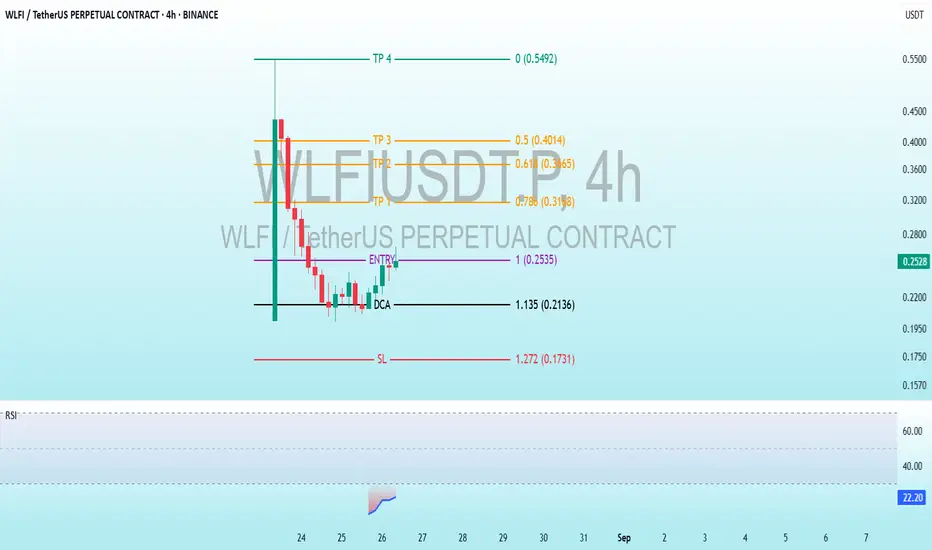
$WLFI Shocking Crash & Rebound Potential Exposed!BINANCE:WLFIUSDT.P
Entry Level: Marked at 1 0.2535 0.2560 USDT, indicating the intended entry point for a long position.
DCA (Dollar Cost Averaging): Set at 1.135 (0.2136) USDT, suggesting a level to add to the position if the price dips further.
Take Profit (TP) Levels:
TP1: 0.786 (0.3198) USDT
TP2: 0.618 (0.3665) USDT
TP3: 0.5 (0.4014) USDT
TP4: 0.0 (0.5492) USDT
Stop Loss (SL): Set at 1.272 (0.1731) USDT, above the entry to limit potential losses.
The price has dropped significantly below the entry and DCA levels, suggesting the strategy may need adjustment or that the stop loss has been triggered.
Technical Indicators
RSI (Relative Strength Index): The RSI at the bottom shows a sharp decline, moving into oversold territory below 30 (23 - 24). This indicates the price may be oversold and could see a potential reversal or consolidation soon.
Observations
The take profit levels are structured with decreasing targets, indicating a strategy to secure profits as the price moves lower from the entry.
The RSI entering oversold territory aligns with the sharp price drop, hinting at a possible bounce or stabilization if buying interest returns.
Conclusion
The chart outlines a trading strategy with a defined entry, stop loss, and multiple take profit levels for a long position in WLF/USDT perpetual futures. The significant price drop and oversold RSI suggest the price may be nearing a support level, potentially offering a buying opportunity near the current price or DCA level if bullish momentum resumes.