Walmart - Good PotentialCounting waves and assessing technical potential. Here’s what we see:
We are drawing a classic five-wave structure. The move started in November 2015.
November 2015 - April 2022 - Wave 1
June 2022 - February 2025 - Wave 3
April 2025 - present - Wave 5
The upside potential is estimated at 18 - 38 %.
Key targets:
136
156
---
Please subscribe and leave a comment!
You’ll get new information faster than anyone else.
---
WMT

Walmart: New Impulse!After a period of indecision, Walmart's stock has recently gained new upward momentum. It's once again heading towards our red Short Target Zone ($127.46 - $134.37), where the green wave is expected to conclude. In the primary scenario, we anticipate a subsequent break of the support at $97.90 and a decline into our green long Target Zone between $80.90 and $69.60. Alternatively, the high of the green wave alt. might have already been set. A direct sell-off below the mentioned support would then lead the stock into our green Long Target Zone earlier (probability: 34%).

WMT – Breakout Holds as $110 Flips From Resistance to SupportFrom a technical perspective, the $110 level has completed a clear resistance-to-support flip. After the breakout, price pulled back and held above this zone, indicating that prior selling pressure has been absorbed and demand is now defending the level. The stock remains above a rising 20-day EMA, suggesting the structure is constructive rather than overstretched.
With this setup, $110 acts as the key bullish anchor. As long as price holds above this support, the market remains in a bullish consolidation phase, and recent pullbacks appear to be structural digestion rather than a signal of trend reversal.

Target aims for $130Sellers exhausted?
Bulls reasserting control?
A sustained move above $103 could target previous resistance of around $130
Which where a W pattern formation points towards as well.
Consenus by analysts is a "hold"
But if consumer spending picks up under favourable economic conditions earnings could expand and catch up to peers like #WMT

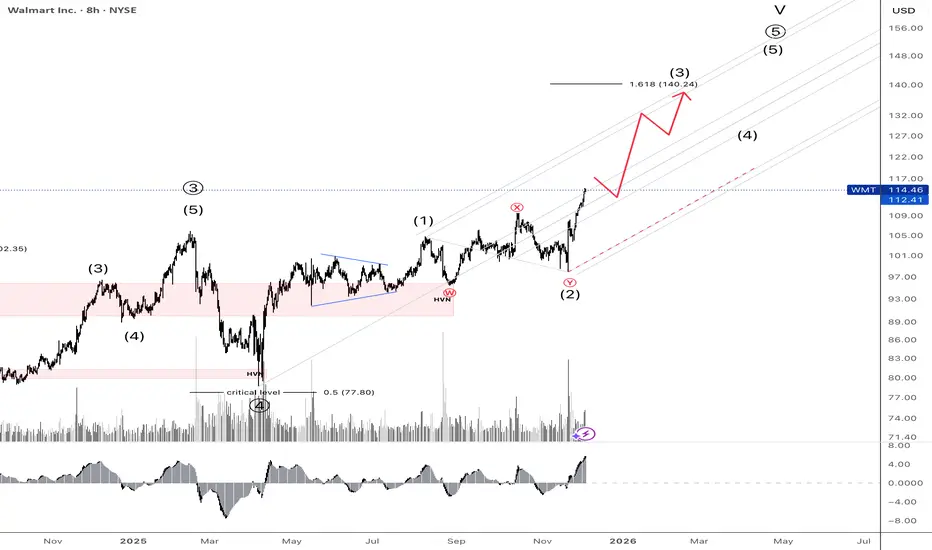
Walmart. Current Growth Target.The previously proposed diagonal model is no longer valid, as the expected decline did not materialize.
The chart annotation has been adjusted in favor of developing a standard impulse wave, wave .
Target: 140.24, representing a +22.52% move from the current price.
📊
A potential entry will be signaled on a pullback within the next week or two. The structure for the subsequent advance is marked on the chart.
Note: the price during the correction should not break out of the channel boundaries.
Walmart (WMT) surged on expectations of robust consumer spending
The US indices have maintained their uptrend, supported by evidence of strong US consumer spending during Black Friday, which confirmed sustained consumer strength.
Adobe (ADBE) reported that consumers spent 11.9 bln USD online during Black Friday, marking a record high and a 9.1% increase YoY. The NRF survey results also indicated a record-high 186.9 mln people planned to shop from Thanksgiving through Cyber Monday.
Walmart (WMT) stock price surged, reflecting its 3Q earnings surprise and growing anticipation for increased year-end consumption. CFO Rainy commented that the early demand for the holiday season is very strong, with robust spending particularly notable among high-income customers.
WMT breached above the ascending channel's upper bound and broke to a new high. Diverging bullish EMAs indicate a potential uptrend extension.
If WMT closes above the channel's upper bound, the price could advance toward the new high and psychological resistance at 111.50.
Conversely, if WMT breaks below the channel's upper bound and the support at 109.00, the price may retreat to the subsequent support at 106.00.

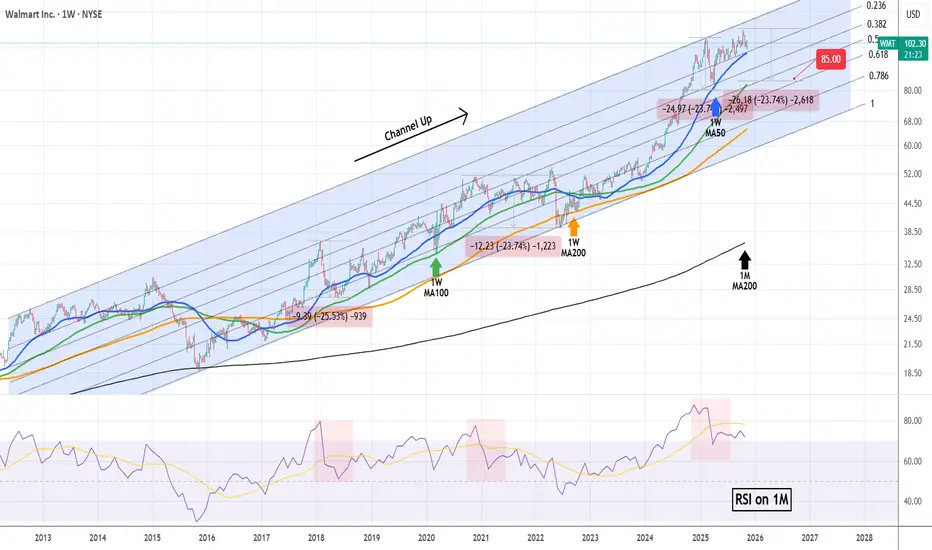
WALMART can correct to $85.00 if this level breaks.Exactly 5 months ago (June 12, see chart below), we gave a strong buy signal on Walmart (WMT) right at the bottom of its trend, which eventually hit our $110 Target and then got rejected:
This time we move to the larger 1W time-frame as our former Target was eventually a new All Time High (ATH) almost at the top of the 13-year Channel Up. The price is hanging tightly now on the 1W MA50 (blue trend-line), which is where the previous correction (Feb-March 2025) found Support and rebounded.
With the 1M RSI printing a formation that previous delivered two technical pull-backs of -23.74%, we expect the stock to start correcting again if it closes below the 1W MA50. All previous breaks below it, eventually led to a 1W MA100 (green trend-line) test.
If that takes place, we expect Walmart to hit at least $85.00 inside 2026.
---
** Please LIKE 👍, FOLLOW ✅, SHARE 🙌 and COMMENT ✍ if you enjoy this idea! Also share your ideas and charts in the comments section below! This is best way to keep it relevant, support us, keep the content here free and allow the idea to reach as many people as possible. **
---
💸💸💸💸💸💸
👇 👇 👇 👇 👇 👇
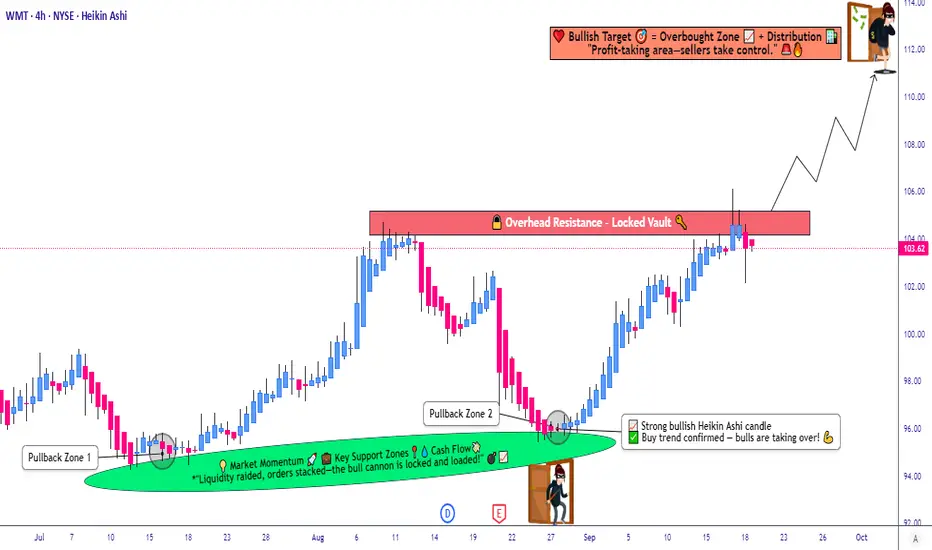
Is Walmart Setting Up for a Bullish Momentum Shift?🛒 WMT: Walmart’s Wealth Heist Strategy 🚀 (Swing/Day Trade)
Asset: Walmart, Inc. (WMT)
Market: US Equities (not Forex, as WMT is a stock, not a currency pair! 😉)
Vibe: Bullish Breakout with a Thief Strategy twist! 🕵️♂️
📈 The Plan: Steal the Breakout! 💥
WMT is gearing up for a bullish breakout at $105.00!
🎯 For confirmation, we need a 4-hour candle close above the resistance level at $105.00 to lock in that buy signal. No sneaky moves before confirmation, or you’re gambling with your loot! 😎
🕵️♂️ Thief Strategy: Layered Limit Orders
This is where the Thief Strategy shines! 🌟 Instead of jumping in with one big order, we’re setting multiple buy limit orders to stack the deck in our favor:
$102.00
$103.00
$104.00
$105.00
$106.00
Pro Tip: Feel free to add more layers based on your risk appetite, but only place these limit orders after the breakout is confirmed (4H candle close above $105.00).
Setting layers blindly is like robbing a bank without a getaway car—risky business! 🚨
🛑 Stop Loss: Protect Your Stash
Set your stop loss at $101.00.
Note: Dear Thief OGs (Ladies & Gentlemen of the charts), this is my suggested SL, but it’s your heist, your rules! Adjust based on your risk tolerance. 💸
🎯 Take Profit: Cash Out Like a Pro
Our target is $112.00, where we expect strong resistance and potential overbought conditions. Watch out for a possible trap at this level—grab your profits and escape before the market pulls a fast one!
😈Note: This is my recommended TP, but you’re the boss of your trades. Take profits at your own discretion and keep the cash flowin’! 💰
🔗 Related Pairs to Watch (Correlations & Key Points)
Since WMT is a retail giant, its price action often correlates with consumer discretionary and retail sector stocks. Keep an eye on these related assets (all priced in USD):
NYSE:TGT (Target Corporation): Another retail titan. If WMT breaks out, TGT often follows the consumer spending vibe. 📊
NASDAQ:COST (Costco Wholesale): Big-box retail cousin. Strong correlation with WMT due to similar market dynamics. 🏬
AMEX:XRT (SPDR S&P Retail ETF): Tracks the broader retail sector. A bullish WMT could signal strength in XRT. 📈
Key Correlation Insight: WMT’s performance is tied to consumer confidence and economic data (e.g., retail sales, consumer price index). If these indicators are strong, expect WMT and related stocks to rally. Conversely, weak data could stall the breakout. Always check the economic calendar! 🗓️
📝 Final Notes for the Heist
Confirmation is King: Don’t set your layered limit orders until the 4H candle confirms the breakout above $105.00. Patience pays! ⏳
Risk Management: The Thief Strategy is slick, but don’t get greedy. Stick to your risk-reward ratio and protect your capital. 💼
Market Context: Watch for broader market sentiment (S&P 500, consumer sentiment reports) to support WMT’s bullish move. 🌍
✨ “If you find value in my analysis, a 👍 and 🚀 boost is much appreciated — it helps me share more setups with the community!”
Disclaimer: This Thief Style trading strategy is just for fun! Trade at your own risk and always do your own research. 😜
#Hashtags: #WMT #StockMarket #SwingTrading #DayTrading #ThiefStrategy #BullishBreakout #TechnicalAnalysis #TradingIdeas
Walmart (WMT) Stock Direction: Upward Surge on October 15, 2025Walmart (WMT) Stock Direction: Upward Surge on October 15, 2025
As of midday trading on October 15, 2025, Walmart Inc. (WMT) is experiencing a strong upward movement, with shares climbing to 107.31 USD, marking a gain of 5.08% from the previous close. This performance pushes the stock to a new all-time high, surpassing its prior peak of 106.11 USD set on September 17, 2025. The rally is driven primarily by the announcement of a strategic partnership with OpenAI, enabling seamless shopping through ChatGPT with instant checkout features, which positions Walmart at the forefront of AI-driven retail innovation.
Key Market Metrics
- **Price and Change**: Current price at 107.31 USD, up 5.19 USD (5.08%) intraday.
- **Volume**: 17.37 million shares traded, exceeding the average of 15.99 million, indicating heightened investor interest and potential institutional buying.
- **Market Cap**: Approximately 855.41 billion USD.
- **Valuation**: Trailing P/E ratio of 40.64, reflecting premium pricing amid growth expectations.
- **Broader Performance**: Year-to-date return of 19.64%, with a 34.93% gain over the past year, outperforming many retail peers.
Catalyst: OpenAI Partnership
The partnership integrates AI to enhance the shopping experience, allowing users to make purchases directly via ChatGPT. Analysts view this as a leap in "agentic commerce," accelerating Walmart's e-commerce edge and potentially expanding margins through reduced customer acquisition costs. Mizuho reiterated an Outperform rating with a 115 USD price target, highlighting the move as ahead of the curve in AI retail adoption. Overall analyst consensus remains "Strong Buy," with an average 12-month target of 112.95 USD, suggesting further upside potential.
Sentiment and Technical Outlook
Social media buzz on X reflects bullish enthusiasm, with users noting the breakout above key resistance levels like 104 USD and potential targets at 110-120 USD based on Fibonacci extensions and Elliott Wave patterns. Volume spikes and a bullish MACD crossover support sustained momentum, though some caution about profit-taking near upper channel extremes. Institutional flows appear supportive, with over 4,000 funds holding shares and positive reactions to the AI news.
Risks and Considerations
While today's direction is clearly upward, broader market factors like inflation and consumer spending could influence retail stocks. Upcoming earnings on November 20, 2025, will be key, with expectations for continued e-commerce growth. Support levels to watch include 103 USD and 101 USD for any pullback.
In summary, WMT's direction today is firmly upward, fueled by the OpenAI collaboration and robust trading activity, positioning it for potential continued gains in the near term.

WMT 1H Short Conservative CounterTrend TradeConservative CounterTrend Trade
+ short balance
+ expanding CREEK
+ resistance level
+ biggest volume Ut
+ weak test
+ first bearish bar close entry
Calculated affordable virtual stop
through buying put
1 to 2 R/R take profit
1D CounterTrend
"- long impulse
+ resistance level
+ volumed 2Ut+
+ weak test"
1M CounterTrend
"- long impulse
+ volumed T1
+ resistance level"
1Y CounterTrend
"- long impulse
+ far beyond impulse potential"

WMT - Our profit target is near, secure some profitsWhen I posted the long trade on Aug. 29th, I did not expect it to run that quick.
Who of you guys or gals pushed it that quick? §8-)
However, I will trail my stop below the last red candles low.
We are not here to win a contest, so we secure some profit, just in case price drops before the Centerline is reached.
Don't forget to follow me and profit from further trades and educational content.

WMT ran into a buyers zone. A nice Long opportunityOn the daily time-frame we see WMT running into the old buyers zone and stopping dead, instead of breaking through it.
It's exactly where the 1/4 line is.
So, if price can't get to the L-MLH, we have a "potential" Hagopian at hand. And that tells us, price will go more in the opposite direction than from where price came - which was the Center-Line.
Additionally, Friday closed higher than the high day a day prior. This is also proper momentum long signal, and because we have a decent Risk-Reward.
A couple facts coming together, which is a clear must take signal to me.
Happy Monday folks - another day in paradise §8-)

Walmart: On Track for Further DeclinesWalmart shares have recently continued their planned sell-off, further extending magenta wave (C). Although the stock has traded in a narrow sideways range since last Wednesday, a further decline appears likely in the near term. The downward move is expected to bottom out at the low of green wave , within the corresponding Target Zone between $80.18 and $72.42. There is still a 39% chance of a short-term breakout above resistance at $105.68, which would mark a new corrective high.

WMT - Walmart turns southI attached the A-Handle of the fork to the GAP from November 2025, because a GAP is also a Pivot.
As we see, price reacts not bad at the Centerline.
Price failed to make a new high.
Then it broke the Centerline and retested it.
No we are trading in the midst of the old accummulation zone where Buyers hung out.
A nice bounce would be a good short opportunity.
Breaking the support zone also, but with lower Risk/Reward ratio.
Observing WMT for a potential short.

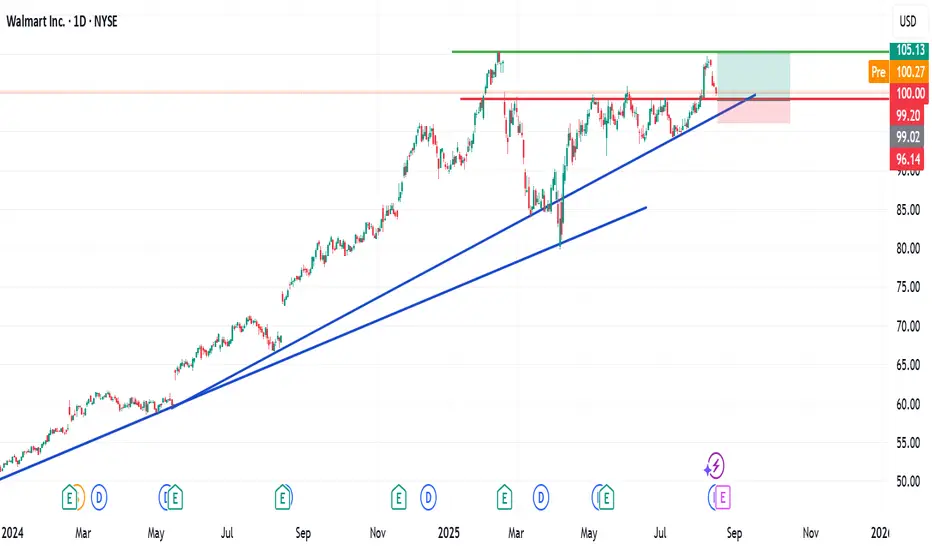
My 5% upside for WalmartMy 5% upside for Walmart.
There is a likely chance that WMT may push up from this psychological $100 zone. If this happens, we may see a 5% upside as shown on my chart with a risk-reward ratio of 1:2.1.
If it, however, drops further to the trend line, I will buy more using DCA and aim for 7% TP.
Trade with care
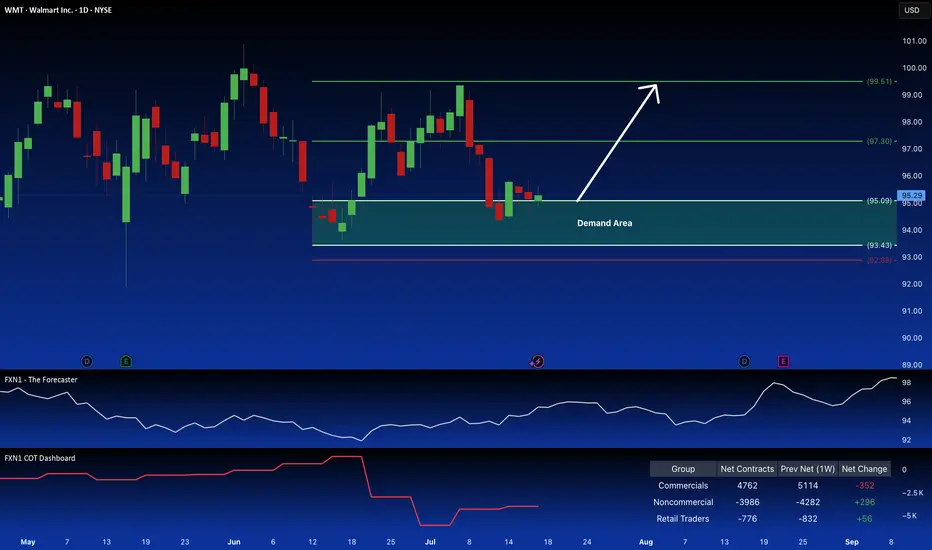
Walmart: Long Position Attractive on Demand ZoneWalmart Inc. presents a compelling long opportunity. The price action is reclaiming a key demand zone, suggesting a continuation of the current uptrend, a pattern reinforced by seasonal factors. Further bolstering the bullish case is the observed increase in large speculator positions.
✅ Please share your thoughts about WMT in the comments section below and HIT LIKE if you appreciate my analysis. Don't forget to FOLLOW ME; you will help us a lot with this small contribution.
WALMART testing its 1D MA50! Will it bounce?Walmart (WMT) hit yesterday its 1D MA50 (blue trend-line) for the first time since April 21. It appears that the rebound from the Trade War Low has turned sideways on a Double Top formation and the 1D MA50 is the first Support to be tested, with the 1D MA200 (orange trend-line) following.
This pattern resembles the August - September 2022 Bull Flag, which despite breaking below its 1D MA50, it resumed the uptrend shortly after and hit the 1.382 Fibonacci extension before the next 1D MA50 pull-back.
As a result, we expect the stock to reach $110.00 (Fib 1.382) by the end of the Summer.
-------------------------------------------------------------------------------
** Please LIKE 👍, FOLLOW ✅, SHARE 🙌 and COMMENT ✍ if you enjoy this idea! Also share your ideas and charts in the comments section below! This is best way to keep it relevant, support us, keep the content here free and allow the idea to reach as many people as possible. **
-------------------------------------------------------------------------------
💸💸💸💸💸💸
👇 👇 👇 👇 👇 👇

WMT: Walmart stock under pressure from tariffs.
It seems that Trump's tariffs are not very favorable for Walmart’s long-term outlook.
However, from a technical perspective, the stock is currently in a good position, and its short-term EPS forecasts are improving day by day.
I don’t recommend buying Walmart for the long term, but there might be a good buying opportunity next week.

Walmart Head & Shoulders on Daily and Weekly chartWalmart (WMT) may be forming, or already has formed, a bearish Head & Shoulders pattern.
#WMT #Walmart #bearish #short #headandshoulders #retail #discountstore

Analysing the Spike in Volatility on the Walmart (WMT) ChartAnalysing the Spike in Volatility on the Walmart (WMT) Share Price Chart
On Thursday, the US retail giant reported its quarterly results — which turned out to be broadly better than expected. While total revenue was roughly in line with analysts’ forecasts, earnings per share came in higher at $0.61 versus the expected $0.57.
At the same time, Walmart CEO Doug McMillon stated on Thursday:
"We will do everything we can to keep our prices as low as possible. But given the scale of the tariffs, even at reduced levels, we won't be able to absorb all the pressure, considering the reality of tight retail margins."
This statement may have raised concerns among market participants about the company’s future earnings, contributing to Friday’s drop in the share price to $92.
It also drew the attention of the US President. On Saturday, Donald Trump said that Walmart (WMT) should “swallow the tariffs” instead of blaming them and raising prices.
In response, Walmart reiterated that it will keep prices as low as possible for as long as it can — which has always been the company’s approach.
Technical Analysis of the WMT Stock Price Chart
Looking at the broader market context, we can see that price fluctuations formed a narrowing triangle in late April — a sign that buyers and sellers had reached some agreement around a fair value of approximately $95.50.
In early May, sentiment shifted in favour of the bulls, with this level acting as support (marked by an arrow).
The earnings release triggered a spike in volatility — the ATR indicator is now at a one-month high. The Walmart stock price extremes seen at the end of last week suggest two key levels, roughly equidistant from the $95.50 axis:
→ resistance around $99 (reinforced by the psychological level of $100);
→ support around $92.
Given the above, it is reasonable to suggest that once the market has digested the news, price movements may calm down again. In that case, we may well see another narrowing triangle form on the WMT chart — slightly above the previous one.
This article represents the opinion of the Companies operating under the FXOpen brand only. It is not to be construed as an offer, solicitation, or recommendation with respect to products and services provided by the Companies operating under the FXOpen brand, nor is it to be considered financial advice.

Quantum's Walmart (WMT) Trading Guide 4/28/25WMT’s weekly outlook balances its defensive resilience against macroeconomic headwinds, with a comprehensive synthesis of technical, market, and strategic factors guiding its trajectory for weekly options contracts. The FAME framework underscores WMT’s long-term bullish potential, driven by robust fundamentals (+5% revenue, $0.58 EPS, 21% e-commerce growth) and adaptability (AI, Walmart+), positioning it as a resilient player in a risk-off regime. However, elevated yields (10-year 4.255%, 20-year 4.738%, 30-year 4.721%) and a stable DXY at 99.58 amplify tariff pressures and margin concerns, capping upside and reinforcing a cautious stance. A tactical long bias is favored for weekly contracts, targeting a bounce from $94.36 to $96.47–$98.50, with a short stance viable below $88.50 if support fails.
Technical implications highlight bullish momentum on daily (RSI ~40, Stochastic ~28) and weekly (RSI ~44, Stochastic ~32) timeframes, with oversold conditions signaling a rebound potential for weekly contracts if $94.36 holds. Monthly neutral momentum (RSI ~50) suggests consolidation, requiring a breakout above $96.47 to confirm bullish strength. This supports a short-term bounce but advises monitoring for sustained moves.
Market influence implications reflect a risk-off environment, with high yields and a stable DXY increasing import costs, particularly amid tariff uncertainty from WMT’s upcoming Trump meeting. The VIX at 24.84 amplifies volatility, favoring WMT’s defensive appeal but heightening risks. WMT’s Q3 FY25 strength and e-commerce growth provide stability, supporting resilience near $94.36.
OFD summary and implications reveal bearish pressure from Vanna (-$0.04), Charm (-$0.02), and DEX (-$0.06), driven by put-heavy flow and hedging demand tied to tariff fears. However, GEX (+$0.08) at the $95 strike pins price, stabilizing volatility and supporting a neutral-to-bullish bounce for weekly contracts if $94.36 holds, aligning with oversold technicals.
Edge insights bolster the case for a bounce, with institutional buying at $94–$95 signaling accumulation, defensive retail sector strength outperforming cyclicals, and low short interest (1.4%) offering squeeze potential above $96.47. These factors enhance confidence in a tactical long bias for weekly contracts, provided support holds.
Strategic outlook implications emphasize consolidation near $95.09, with $94.36 as a critical pivot. A break below risks $88.50, driven by tariff fears and bearish options flow, while a move above $96.47 targets $98.50, fueled by oversold signals and institutional support. The VIX at 24.84 and put-heavy options flow underscore volatility, but WMT’s defensive positioning mitigates downside, favoring a bounce in a risk-off regime.
In summary, WMT’s weekly outlook hinges on defending $94.36, with oversold technicals, GEX pinning, and institutional buying supporting a bounce to $96.47–$98.50 for weekly contracts. Tariff risks, high yields, and DXY stability maintain a risk-off backdrop, capping upside and requiring vigilance for a break below support, which could shift bias to bearish. This balanced approach leverages WMT’s defensive strengths while navigating weekly volatility, aligning with Buffett’s preference for resilient businesses with tactical opportunities.

WALMART 1W MA50 rebound makes a solid long-term investment.Walmart (WMT) ended its 2 month correction with an emphatic rebound on its 1W MA50 (blue trend-line). This is the first time it touches the 1W MA50 since December 11 2023 but it's not uncommon at all within its 10-year Channel Up.
Every time the stock hi its 1W MA50 while the 1W RSI was this low, it was the most common long-term buy opportunity. Better than that was only the one time it hit the 1W MA200 (orange trend-line) during the 2022 Inflation Crisis.
As a result, we expect at least a 2.0 Fibonacci extension rebound similar to the May 2018 Low, and our long-term Target is now $135.00.
-------------------------------------------------------------------------------
** Please LIKE 👍, FOLLOW ✅, SHARE 🙌 and COMMENT ✍ if you enjoy this idea! Also share your ideas and charts in the comments section below! This is best way to keep it relevant, support us, keep the content here free and allow the idea to reach as many people as possible. **
-------------------------------------------------------------------------------
💸💸💸💸💸💸
👇 👇 👇 👇 👇 👇

Walmart (WMT) shares reach highest level since early MarchWalmart (WMT) shares reach highest level since early March
As shown on the chart of Walmart (WMT) shares, trading closed yesterday above the $94 mark – a level not seen since the beginning of March. This means that since the start of 2025, Walmart’s share price has risen by approximately 5.5%.
This positive trend stands in stark contrast to the S&P 500 index (US SPX 500 mini on FXOpen), which has declined by more than 8% over the same period.
Why are Walmart (WMT) shares outperforming the index?
Apparently, from the market’s point of view, this is due to the fact that Walmart’s supermarkets are a source of essential goods for Americans, giving the company an advantage in a scenario where the US economy may slide into recession.
According to Mizuho Bank analyst David Bellinger, Walmart is a sensible choice for investors trying to stay afloat in a volatile market. He forecasts that WMT’s share price could rise to $105 – around 15% higher than its current level.
Bellinger notes that Walmart continues to attract price-conscious shoppers and has made significant progress in e-commerce, helping the company remain resilient even amid the prospect of economic slowdown.
Technical analysis of Walmart (WMT) shares
The chart shows that the share price is moving within a long-term upward trend. The black dashed line, which had acted as support for many months, has been broken:
- This suggests that the line may now act as a median.
- Allowed us to widen the channel and find its lower boundary, which is expected to offer support.
Indeed, the lower boundary of the expanded channel provided support in the first half of April, with particular attention drawn to the large bullish candlestick on 9 April (marked with an arrow). According to the NYSE, over 46 million shares were traded on that day – more than twice the average volume. This highlights the strength of demand.
It is possible that WMT shares may continue to outperform the index going forward, forming fluctuations while:
- receiving support from the psychological $90 level (previously a resistance point);
- gradually approaching the median of the aforementioned channel.
This article represents the opinion of the Companies operating under the FXOpen brand only. It is not to be construed as an offer, solicitation, or recommendation with respect to products and services provided by the Companies operating under the FXOpen brand, nor is it to be considered financial advice.
