WOO Buy/Long Setups (4H)The order blocks at the top of the chart have been consumed, and most sellers have lost a large portion of their orders.
Price has completed a strong CH and is currently trading around a key level. There is also a liquidity pool visible above the chart near the Swing High (SW H).
All of these signs indicate that if a pullback occurs, price could move back toward higher levels.
The targets are marked on the chart, but the main target is the red supply zone.
For risk control, a pullback is needed to enter at a more favorable price, since the invalidation level must be placed properly to avoid losses if price drops.
If a pullback occurs, we will enter a buy/long position.
For risk management, please don't forget stop loss and capital management
When we reach the first target, save some profit and then change the stop to entry
Comment if you have any questions
Thank You
WOOUSDT

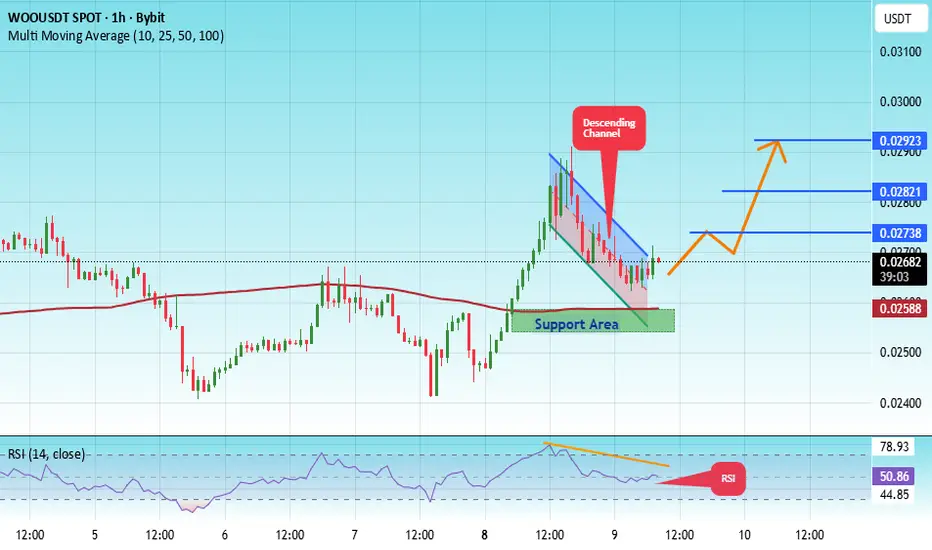
#WOO/USDT Ready for Breakout After Long Consolidation!#WOO
The price is moving in a descending channel on the 1-hour timeframe. It has reached the lower boundary and is heading towards breaking above it, with a retest of the upper boundary expected.
We have a downtrend on the RSI indicator, which has reached near the lower boundary, and an upward rebound is expected.
There is a key support zone in green at 0.02557. The price has bounced from this level multiple times and is expected to bounce again.
We have a trend towards consolidation above the 100-period moving average, as we are moving close to it, which supports the upward movement.
Entry price: 0.02688
First target: 0.02738
Second target: 0.02821
Third target: 0.02923
Don't forget a simple principle: money management.
Place your stop-loss below the support zone in green.
For any questions, please leave a comment.
Thank you.
WOO Looks Bullish (2H)At the top of the chart, we have a large liquidity pool.
Currently, WOOUSDT has created conditions that, with an appropriate risk-to-reward ratio, may move toward the targets and sweep the liquidity pools.
We have a bullish CH and BOS on the chart, and the momentum is strong.
Remember, if you enter a position, stick to your stop-loss, as the risk-to-reward is only valuable if you respect it.
Touching the invalidation level will invalidate this analysis and signal.
Do not enter the position without capital management and stop setting
Comment if you have any questions
thank you

Carry Trade in the Global Market1. Understanding the Concept of Carry Trade
A carry trade involves taking advantage of the difference in interest rates between two currencies. Traders borrow in a funding currency with a low-interest rate (for example, the Japanese Yen or Swiss Franc) and use the proceeds to buy a target currency with a higher interest rate (such as the Australian Dollar or Indian Rupee). The trader earns profit from the interest rate differential, assuming that exchange rates remain stable or move in a favorable direction.
For example, if Japan’s interest rate is 0.1% and Australia’s is 4%, a trader can borrow in Japanese Yen, convert it into Australian Dollars, and invest in Australian bonds. The yield difference (approximately 3.9%) represents the carry return — excluding currency movement and transaction costs.
2. The Economic Logic Behind Carry Trades
Interest rate differentials often arise due to differences in monetary policy, economic growth, and inflation across countries. Central banks in developed economies with stable inflation, such as Japan or Switzerland, tend to maintain low or even negative interest rates to stimulate growth. Meanwhile, emerging economies or commodity-rich nations, such as Brazil, India, or Australia, often have higher interest rates to control inflation or attract foreign investment.
Traders exploit this imbalance. When many investors follow the same strategy, it can influence global capital flows and even cause appreciation of high-yielding currencies. This interplay between monetary policy and speculative trading is a crucial feature of global financial dynamics.
3. Example of a Classic Carry Trade
Let’s take the “Yen Carry Trade”, one of the most famous examples in global finance.
For decades, Japan’s central bank kept interest rates near zero to combat deflation. Global investors borrowed massive amounts in Japanese Yen at almost no cost and invested in assets from countries like Australia, New Zealand, and the U.S., where interest rates were much higher.
When the Japanese Yen remained weak, investors made strong profits from both the interest rate differential and occasional currency appreciation in the higher-yielding countries. However, when the Yen unexpectedly strengthened, it caused rapid unwinding of carry trades, leading to sharp volatility in global markets.
This phenomenon was particularly evident during the 2008 Global Financial Crisis, when investors rushed to unwind their positions, leading to a sudden strengthening of the Yen and sell-offs in risk assets worldwide.
4. Mechanics of Carry Trade
A typical carry trade transaction involves the following steps:
Borrowing in a Low-Interest Currency:
The investor takes a loan in a country where borrowing costs are minimal.
Currency Conversion:
The borrowed currency is exchanged for a higher-yielding currency in the forex market.
Investing in Higher-Yielding Assets:
The funds are then invested in assets such as government bonds, equities, or other interest-bearing instruments.
Earning the Differential:
The investor earns the interest rate difference (carry) as long as the exchange rate between the two currencies remains stable.
Closing the Trade:
When the trade is closed, the investor converts the funds back to the original currency to repay the borrowed amount, hoping that the exchange rate has not moved adversely.
5. Key Determinants of Carry Trade Success
Several factors determine whether a carry trade will be profitable or not:
Interest Rate Differentials:
The larger the gap between two countries’ interest rates, the more attractive the carry trade becomes.
Exchange Rate Stability:
Since profits are denominated in foreign currencies, even small exchange rate fluctuations can wipe out gains.
Global Risk Appetite:
Carry trades thrive during periods of low volatility and high investor confidence. In contrast, during crises or uncertainty, investors tend to move toward “safe-haven” currencies, causing massive unwinding.
Monetary Policy Expectations:
Any hints from central banks regarding interest rate changes can significantly influence carry trade positions.
6. Risks Involved in Carry Trading
Although the potential returns from carry trades can be substantial, the strategy carries notable risks:
Exchange Rate Risk:
The most significant risk is currency fluctuation. If the target currency depreciates against the funding currency, it can erase all interest gains and lead to losses.
Leverage Risk:
Many traders use leverage to magnify returns. However, leverage also amplifies losses during adverse currency movements.
Liquidity Risk:
During market stress, traders may not be able to unwind positions quickly, causing severe losses.
Interest Rate Risk:
A sudden change in central bank policy—such as a surprise rate cut in the high-yield country or a rate hike in the funding country—can reduce or eliminate carry returns.
7. Global Impact of Carry Trades
Carry trades can influence not only individual traders but also entire financial markets. Massive capital inflows into high-yielding countries can cause currency appreciation, asset bubbles, and distortions in capital allocation. Conversely, when carry trades unwind rapidly, they can trigger currency crashes and financial instability.
For example, during 2006–2008, the influx of carry-trade capital into emerging markets contributed to asset price inflation. But once global risk aversion rose during the financial crisis, those trades reversed quickly, leading to a sharp outflow of funds and market turbulence.
8. The Role of Central Banks
Central banks are acutely aware of the effects of carry trades on their economies. They monitor capital flows, exchange rate movements, and foreign reserves to manage potential overheating or excessive volatility.
For instance:
The Bank of Japan (BoJ) has historically maintained ultra-low rates, making the Yen a popular funding currency.
The Reserve Bank of Australia (RBA) often has higher rates, attracting carry-trade investors.
The U.S. Federal Reserve’s monetary tightening or easing directly influences global carry trade attractiveness.
9. Modern Carry Trade Strategies
In the modern era, carry trades have evolved beyond simple currency borrowing. Institutional investors and hedge funds use algorithmic models, derivatives, and cross-asset carry strategies involving bonds, equities, and even commodities.
Moreover, with global interest rates converging after the pandemic, traders now focus on relative value trades—seeking smaller but safer differentials between economies with stable monetary policies. Emerging markets like India, Brazil, and Indonesia have become attractive targets due to relatively higher yields.
10. Current Trends and the Future of Carry Trades
As of the mid-2020s, global carry trade dynamics are shaped by three major forces:
Diverging Monetary Policies:
The U.S. Federal Reserve and European Central Bank are gradually normalizing policy, while Japan still maintains ultra-loose conditions. This sustains interest in Yen-funded trades.
Inflation and Geopolitical Risks:
Rising global inflation and geopolitical tensions occasionally disrupt carry flows, creating volatility.
Technological Advancements:
High-frequency trading and AI-driven strategies have made carry trades faster and more data-dependent.
Looking forward, carry trades will continue to play a vital role in global liquidity, currency valuation, and capital mobility. However, investors must remain cautious—profit opportunities can quickly turn into losses when global risk sentiment changes.
Conclusion
Carry trade is one of the most fascinating strategies in global financial markets—simple in concept but deeply influenced by macroeconomic and psychological forces. It highlights the interconnectedness of interest rates, currencies, and risk behavior across nations. While it offers steady profits in stable conditions, it can turn perilous during turbulence. For both institutional and retail participants, understanding carry trades means understanding the pulse of global finance itself.

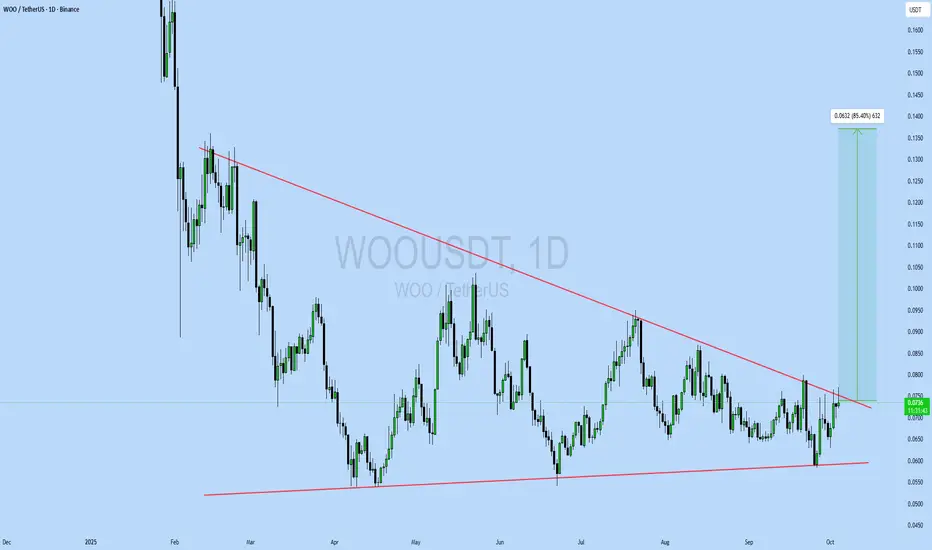
WOOUSDT UPDATE#WOO
UPDATE
WOO Technical Setup
Pattern: Bullish falling wedge pattern
Current Price: $0.0735
Target Price: $0.1367
Target % Gain: 85.40%
SWB:WOO is breaking out of a falling wedge pattern on the 1D timeframe. Current price is $0.0735 with a target near $0.1367, showing about 85% potential upside. The breakout signals a strong bullish reversal setup, indicating possible continuation to the upside. Always use proper risk management.
Time Frame: 1D
Risk Management Tip: Always use proper risk management.
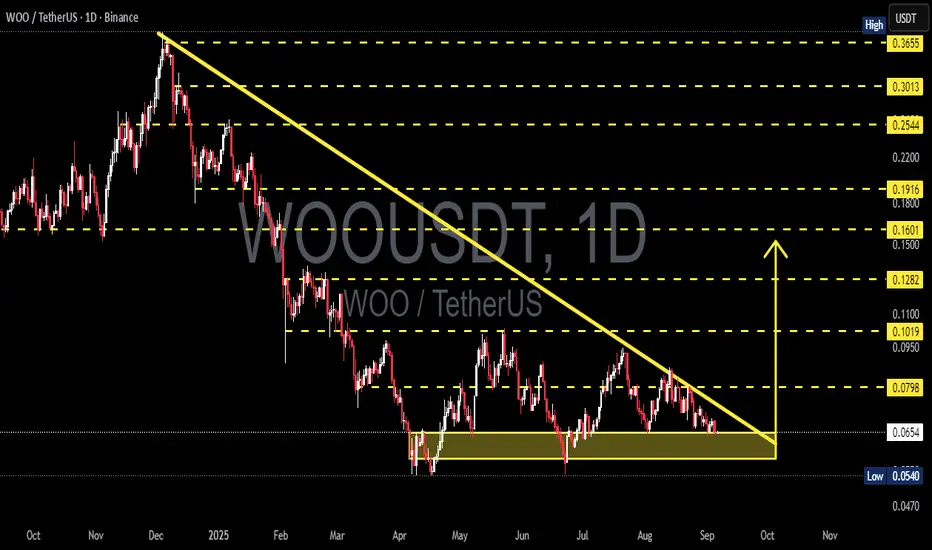
WOO/USDT – Descending Triangle Pressing Price at Key Zone!📌 Technical Overview
WOO/USDT is currently trapped inside a Descending Triangle on the daily timeframe. Sellers are consistently creating lower highs, while buyers are defending the critical support zone at 0.054–0.066.
This structure reflects the final stage of accumulation or distribution before the market makes a decisive move. With the triangle’s apex approaching (late September – early October), a major breakout or breakdown is likely imminent.
---
📊 Pattern Details
Main pattern: Descending Triangle (statistically bearish, but upside breakout still possible).
Key support: 0.0540 – 0.0660 (golden zone).
Immediate resistance: Descending trendline + horizontal barrier at 0.0798.
Volume: Declining, showing the market is waiting for a trigger. A volume spike on breakout/breakdown will confirm direction.
Apex: Nearing → price will soon be forced to choose a side.
---
🟢 Bullish Scenario
Confirmation: Daily close above the descending trendline and 0.0798 with strong volume.
Upside targets:
Target 1: 0.0798 → +22%
Target 2: 0.1019 → +56%
Target 3: 0.1282 (major supply zone) → +96%
Invalidation: Close back below 0.065 after breakout (false breakout).
---
🔴 Bearish Scenario
Confirmation: Daily close below 0.0540 with a failed retest (support flips into resistance).
Downside target:
Measured move projection: ~0.0282 (approx. −57% from current price).
Invalidation: Fast recovery above 0.065–0.07 after breakdown.
---
📌 Strategy & Notes
Wait for daily close confirmation with volume before taking positions.
Breakouts/breakdowns without strong volume = high risk of false signals.
Safer entries come after a successful retest of breakout levels.
Always apply risk management (set stops at invalidation levels).
Descending triangles in downtrends lean bearish, but if bulls defend the support zone, it could trigger a strong rally.
---
📝 Conclusion
WOO is at a make-or-break zone.
Holding 0.054 and breaking above the trendline could lead to a rally toward 0.1282.
Losing 0.054 support opens the door to a sharp drop toward ~0.0282.
At this stage, patience and confirmation are key. The market is quiet now, but a strong move is coming soon.
---
#WOO #WOOUSDT #Crypto #Altcoins #TechnicalAnalysis #DescendingTriangle #Breakout #Bearish #Bullish
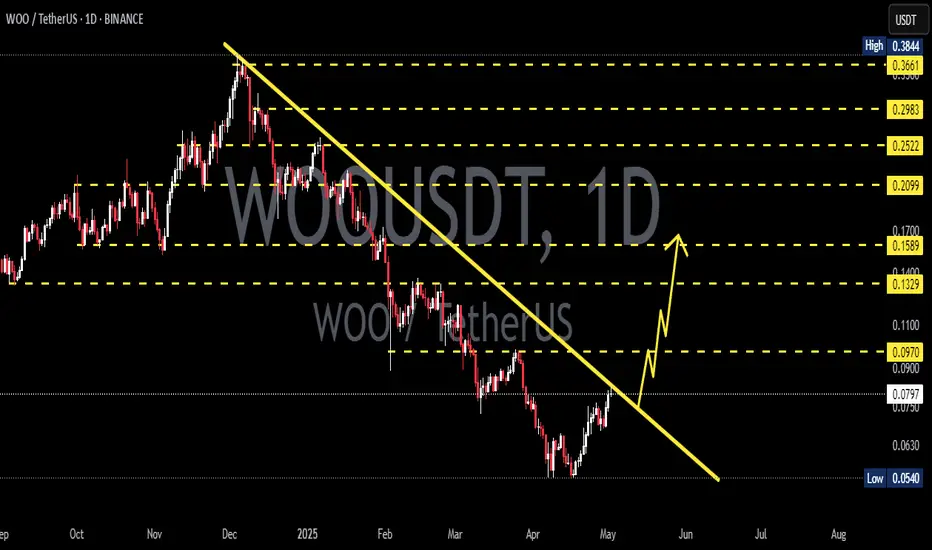
WOO/USDT Ready for Breakout After Long Consolidation!Chart Analysis (1D Time Frame):
This WOO/USDT chart shows a potential breakout setup after months of accumulation and downward pressure.
📉 Descending Trendline Resistance:
The price has been in a steady downtrend since December 2024, repeatedly rejecting from a descending resistance line.
🟨 Strong Accumulation & Support Zone (0.0540 – 0.0643 USDT):
A strong horizontal support zone has formed since April 2025. Price has bounced multiple times from this area, indicating growing buying pressure.
📈 Breakout Potential:
If WOO breaks above the descending trendline with strong volume, this could signal the start of a major bullish move.
🎯 Potential Upside Targets (Key Resistance Levels):
1. 0.0798 USDT – Initial breakout confirmation.
2. 0.0963 USDT – First bullish target.
3. 0.1334 USDT – Medium-term target.
4. 0.1916 USDT – Aggressive target.
5. 0.2544 USDT – Extended bullish continuation target.
6. 0.3655 – 0.3844 USDT – Long-term major resistance zone.
⚠️ Risk Note:
A fake breakout is possible if the volume is weak. If price breaks below the accumulation zone, the bearish trend may continue.
📌 Conclusion:
WOO is at a critical decision point. A confirmed breakout from this descending structure could trigger a significant bullish rally. A must-watch setup for both traders and investor.

WOOUSDT at weekly support, eyeing for 0.25$Here is how I see WOOUSDT to play out.
The price is currently dipping into weekly support zone WS1.
It is likely that the price will bounce from here towards weekly resistance zone WR1.
In case the price reaches this weekly resistance zone WR1, it is likely to experience some pullback.
However, this pullback will be only to gather some momentum to break WR1 on the next attempt and move towards next weekly resistance WR2.
Other indicators are also looking healthy for this one, thereofore, it seems that it going to resume its upward journey, that started in the beginning of April 2025, soon.
I am scaling in this one now an as the price dips deeper into this support zone. This one is a good bet and will provide a good return with considerably limited risk.
Whats your thoughts on that? Share with me in the comment.

#WOO/USDT#WOO
The price is moving within a descending channel on the 1-hour frame, adhering well to it, and is heading for a strong breakout and retest.
We are seeing a bounce from the lower boundary of the descending channel, which is support at 0.0870.
We have a downtrend on the RSI indicator that is about to be broken and retested, supporting the upward trend.
We are looking for stability above the 100 moving average.
Entry price: 0.0880
First target: 0.0892
Second target: 0.0905
Third target: 0.0922

WOO Buy/Long Setup (4H)The trigger line has been broken, we have a bullish CH, and a double bottom is also visible.
As long as the green zone holds, it can move toward the TPs. The targets are marked on the chart.
A daily candle closing below the invalidation level will invalidate this analysis.
For risk management, please don't forget stop loss and capital management
When we reach the first target, save some profit and then change the stop to entry
Comment if you have any questions
Thank You

Wootrade Network: Your Altcoin Choice (S5)The downtrend has been broken. When the downtrend is broken the bearish action ends. When the bearish action is over it is the start of the bullish cycle. Cycle implies long-term not only a bullish jump like we saw before. In late 2024, in late 2023 and so on, no! This time it will be different of course because the market takes time to grow big, to accumulate to prepare for the bull run phase in late 2025. We will have a mini bull run within 1-2 months.
So the downtrend is represented by the upper magic red line on the descending channel. Notice the end of the channel produces a rounded bottom (the cup pattern) and then the action moves above the red line. So here the downtrend is broken based on TA.
The force that was pushing prices lower is no more. The market is no longer under this bearish influence. This is what it means when we say the downtrend is broken. No more bearish momentum and hopefully no more lower lows. There can be shakeouts, swings and retraces but these would end in a higher low compared to the channel bottom.
In some instances, the market can test support on wick and close above it. This wouldn't invalidate the bullish bias and potential and we can interpret it and understand it for what it is, a shakeout.
The time for shakeouts is gone and now we are set to experience long-term growth.
Thanks a lot for your continued support.
Wootrade Network hits bottom. From the bottom we grow.
Namaste.


WOOUSDT 1D AnalysisWOO ~ 1D Analysis
#WOO Buy after successfully penetrating this resistant line with a short -term target of at least 10%+ from here.
WOO Price Action Update – Major Breakout Incoming?Current Market Structure:
🔹 #WOO is trading in a perfect Accumulation Phase after a prolonged downtrend. Smart money seems to be accumulating, and a strong breakout could be on the horizon!
Bullish Confirmation:
🔹 A bullish divergence is forming on the 4-hour timeframe, signaling potential upside momentum. However, confirmation will come when #WOO breaks out and closes above the Accumulation Phase.
Trade Plan:
🔹 Wait for a break and retest above the accumulation zone.
🔹 Look for a strong bullish candle closure to confirm momentum.
🔹 Target key resistance zones while maintaining proper risk management.
Key Levels to Watch:
🔹 Resistance: $0.14 (Breakout Zone)
🔹 Support: $0.1350 - 0.09 (Accumulation Support)
What’s Your Take?
Are you bullish or bearish on #WOO? Drop your analysis in the comments below! Let's discuss.

#WOO/USDT#WOO
The price is moving in a descending channel on the 1-hour frame and is adhering to it well and is heading to break it strongly upwards and retest it
We have a bounce from the lower limit of the descending channel, this support is at a price of 0.1200
We have a downtrend on the RSI indicator that is about to break and retest, which supports the rise
We have a trend to stabilize above the moving average 100
Entry price 0.1210
First target 0.1248
Second target 0.1290
Third target 0.1335

WOOUSDT 4DWOO ~ 4D Analysis
#WOO This is the lowest support for now. Buy from here if you still have a Conviction on this coin with a minimum target of 20%+

WOO/USDT: Stop Buy Order Set > Watching for BreakoutHey traders,
Here's a quick look at a potential BINANCE:WOOUSDT long setup I'm watching.
Following a dip to $0.1700, WOO seems to have found support and is potentially gearing up for a move higher.
>>I've set a stop buy order just above $0.1780 to enter if it breaks out.<<
Good luck out there!
Disclaimer: This analysis is for informational purposes only and should not be considered financial advice. I am not a financial advisor. Trading cryptocurrencies involves significant risk, and you could lose some or all of your investment. Conduct your own research and due diligence before making any trading decisions. Past performance is not indicative of future results.


WOO ANALYSIS📊 #WOO Analysis
✅As we can see that #WOO was consolidating in a small range but right now there is a breakout or major resistance level. We would see a good bullish movement in #WOO
👀Current Price: $0.2490
🚀 Target Price: $0.2880
⚡️What to do ?
👀Keep an eye on #WOO price action and volume. We can trade according to the chart and make some profits⚡️⚡️
#WOO #Cryptocurrency #TechnicalAnalysis #DYOR

#WOO Getting Ready for a Major Breakout | Key Levels to WatchYello, Paradisers! Will #WOOUSDT finally break out of its descending channel, or are we heading for another drop? Let’s break it down #WOO:
💎#WOO has been trading within a descending channel on the 8-hour chart, showcasing a classic consolidation structure. Currently, the price is approaching a critical descending resistance, making this a pivotal moment for traders.
💎A break above the resistance at $0.3041 could confirm a bullish breakout which would set the stage for an extended rally. If bulls gain control, the next target zone lies between $0.4000–$0.4500, a significant supply zone where sellers may reappear. We need strong confirmation with robust volume and bullish momentum for this scenario to play out.
💎On the downside, $0.2044 serves as an essential demand zone and has been a reliable support level during the recent consolidation. If #WOOUSD fails to hold this demand we may see a retest of this strong support at $0.161.
💎A close below the $0.161 strong support would invalidate the bullish outlook and could result in a deeper correction. If this happens, the price may drop to test the $0.1500 region, marking a significant shift in sentiment.
Stay focused, patient, and disciplined, Paradisers🥂
MyCryptoParadise
iFeel the success🌴

Woolish not yet well i am a fan of Woo and their team the way they have managed to bring all the things together is awesome but i may be biased but still think that box is yet to filled i may miss the bottom entry but my gut says that it will fill any ways if it don't i don't run this market flip the orange level and stay ther for a week or two and then lets go woolish
bitcoin is bullish so that may be a push ahead for sure

#WOO Ready for a Major Upward Move Or Not? Key Levels to WatchYello, Paradisers! Are #WOO bulls ready to maintain momentum above or not? Let's discuss the latest analysis of #WOO and see what's happening:
💎#WOO has recently broken above the resistance of its ascending channel, igniting bullish momentum and raising expectations for a potential rally toward higher price levels. However, the next move will depend heavily on the $0.34-0.37 supply zone, a critical barrier that traders must closely monitor.
💎If #WOO can decisively break above $0.34, it would confirm a continuation of the bullish breakout, opening the door for a run toward the major resistance zone between $0.63–$0.70. Such a move would likely attract fresh buying interest and signal the start of a stronger upward trend.
💎However, there’s still a risk of a pullback. If WOO fails to maintain momentum above $0.34, a retracement to the $0.2354–$0.2021 demand zone becomes likely. This zone will act as the key support area, and any dip into this level could provide a re-entry opportunity for bulls.
💎Should #WOO close a daily candle below the $0.2021 level, it would invalidate the bullish breakout entirely and confirm a bearish reversal. Such a move could trigger a deeper correction, with the price potentially revisiting the $0.15 region, reinforcing bearish sentiment and shaking out over-leveraged traders.
Stay focused, patient, and disciplined, Paradisers🥂
MyCryptoParadise
iFeel the success🌴

TradeCityPro | WOOUSDT Analysis Futures Opportunity👋 Welcome to the TradeCityPro channel!
Let’s take a detailed look at the WOOUSDT coin triggers, even on this relaxed Friday! 😊
🌍 Bitcoin's Market Overview
Before diving into WOO, as always, let’s check Bitcoin
Yesterday's analysis: After breaking 96610, a long position was suggested.
Additionally, if Bitcoin dominance decreases, it could confirm favorable setups for altcoins. However, Bitcoin remained range-bound, moving in sync with the overall market.
📊 Weekly Timeframe
WOO is one of those coins that hasn’t made any significant moves yet, but the buy trigger has been activated.
After breaking 0.2228, a mid-term buy was possible, and there’s still a logical opportunity to buy at market price with a stop loss at 0.1308, supported by increased volume and RSI entering the overbought zone.
If you missed this trigger, you can wait and join this coin upon breaking 0.3369.
📈 Daily Timeframe
We’ve seen a relatively strong move, but the price has hit a significant daily resistance at 0.275
where it has been ranging for several days. After breaking this resistance, further upward movement could begin.
Additionally, RSI is nearing the overbought zone. For a risky buy in the daily time frame, consider entering after breaking this resistance, with a risky stop loss at 0.2129 or a safer stop loss at 0.1550.
⏱ 4-Hour Timeframe
The price shows compression, forming something resembling a triangle, with higher lows being created consistently. This increases the probability of breaking the 4-hour resistance at 0.2779, which could serve as a solid trigger for a futures trade.
📈 Long Position Trigger
The trigger is clear after breaking 0.2779, aim to open a long position with a safe stop loss, such as 0.2340.
📉 Short Position Trigger
The market currently lacks momentum for shorts. Even with a 20% drop driven by whales, short positions aren’t attractive now. It’s better to wait for stronger bearish momentum to enter with smaller stop losses.
💡 BTC Pair Insight
WOO has been bearish against Bitcoin in the long term but currently shows significant trend weakness and is ranging within its daily box. Compared to most altcoins, WOO demonstrates better strength relative to Bitcoin. If lower time frames confirm a breakout, an upward trend could begin.
📝 Final Thoughts
Stay calm, trade wisely, and let's capture the market's best opportunities!
This analysis reflects our opinions and is not financial advice.
Share your thoughts in the comments, and don’t forget to share this analysis with your friends! ❤️
