WOO will explode soon [By Ivan | Skyrex]Hello, Skyrexians!
Let's continue analyze altcoins with the greated potential. Today's coin of the day is WOO. It has the clear Elliott wave structure. The asset have already formed waves from 1 to 4. Now price is inside the target area for wave 4 and it's about to go to new highs.
Follow us and

Long WOO StochRSI is oversold alert
Bullish breakup at fibo area
Entry: 0,1804
SL : 0,1756
TP 1 : 0,1945
TP2 : 0,2142
RR risk: 1-3%
DYOR
NFA

Woo analaysisThe Woo altcoin has already absorbed sellside liquidity, leading me to expect a bullish movement from this point forward.

WOO - Many such casesA lot of these earlier good performing coins are starting to get back to htf levels of interest.
When we zoom out and look for high volume nodes or volume levels of interest, it becomes easy to find a few good setups, even if just for a bearish retest or lower high.
Levels to watch:
High Volume No

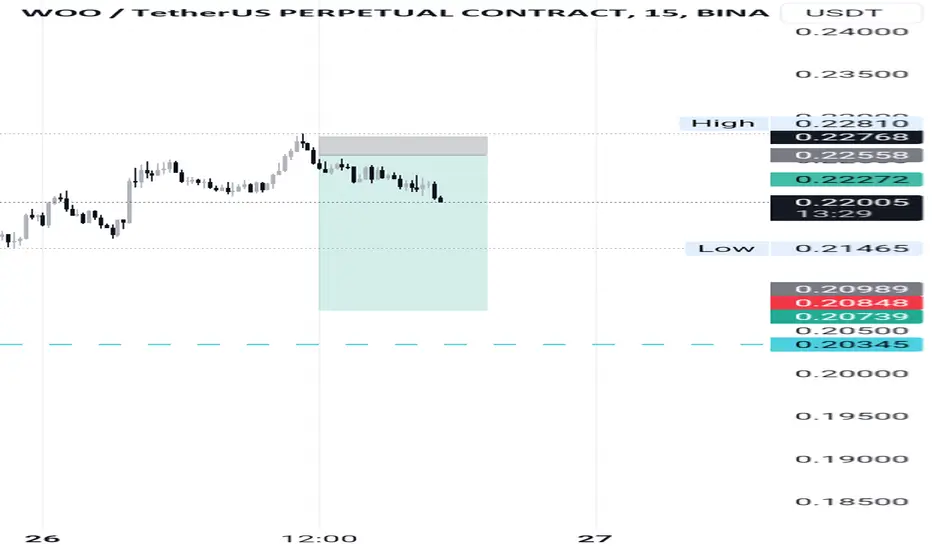
Woo short term Target I am shorting woo and taking profits at appropriate levels. It's a good time to short because an indicator is showing a bearish divergence.
$WOO - DeFi Coin with Rising WedgeBefore my porto,
RWA - LSE:ONDO
AI - SEED_DONKEYDAN_MARKET_CAP:AGIX
Now, for DeFi - GETTEX:WOO
Looks promising with Rising Wedge pattern.
Expecting for bounce from the bottom line the pattern.
My buy zone in grey with final target at purple.

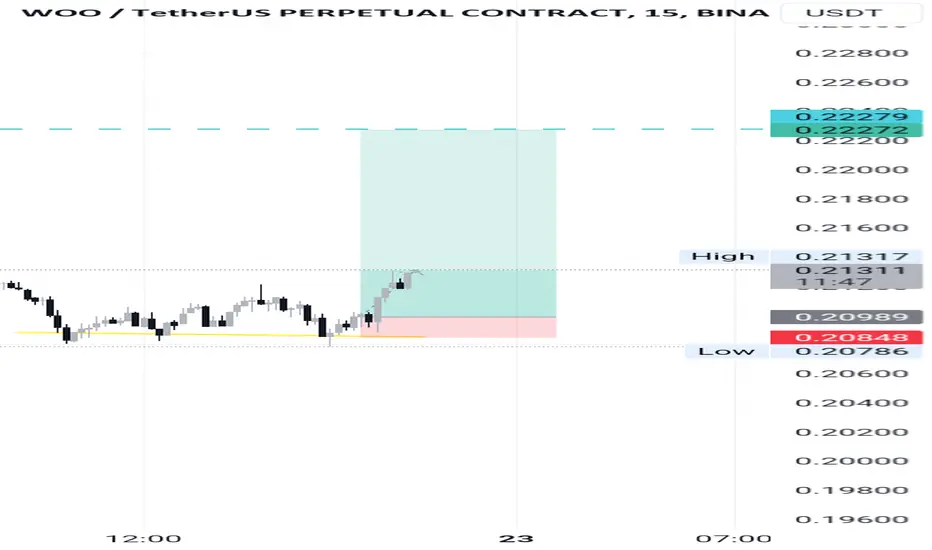
Woo Based on the bullish trend across all time frames and the presence of a bullish divergence on the lower timeframe, I have decided to enter a long position.
WOOUSDT: Bullish Trend (Harmonic Pattern)WOOUSDT is formed perfect Harmonic Pattern and also touch the strong support area, with strong bullish divergence so that are perfect reversal points. So we will wait for the break of the previous LHs to confirm the bullish trend and take a long/buy trade.
Note: Today is also news in New York sessi

$WOO longMere looking at this chart, you can confirm chat has fallen very much lower from the value zone. It also broke-out from the rising wedge and feel so short (double confirmation).
This also sees the fall to a daily support level which presents an option to buy.
I am optimistic it will take the turn

$WOO Daily Long SetupConfluences:
* Lying on daily demand zone.
* Retesting Range Low.
* Making Bullish Bat Pattern.
Targets and stop-loss is mentioned in the chart.
Easy invalidation with strong RR.
Do not forget to follow and support my charts.
Cheers!🥂

See all ideas