AI, Robotics & Future Technology Investing1. The Landscape of AI and Robotics
Artificial Intelligence (AI) refers to machines’ ability to perform tasks that typically require human intelligence, including learning, problem-solving, reasoning, perception, and language understanding. AI is not a single technology but a set of technologies, including machine learning (ML), natural language processing (NLP), computer vision, and generative AI. AI is increasingly embedded in sectors such as healthcare, finance, manufacturing, transportation, and consumer services, making it a pervasive force in the modern economy.
Robotics involves the design, construction, and operation of machines capable of performing tasks autonomously or semi-autonomously. Modern robotics integrates AI for perception, decision-making, and adaptability, enabling applications ranging from industrial automation and warehouse logistics to surgical robotics and autonomous vehicles. Robotics is no longer limited to factories; it is entering service industries, agriculture, defense, and even household applications.
Future technologies encompass a broader set of innovations, including quantum computing, advanced semiconductors, nanotechnology, biotechnology, augmented and virtual reality (AR/VR), blockchain, and next-generation telecommunications such as 5G and 6G. These technologies often act as enablers for AI and robotics, creating a synergistic effect that accelerates adoption and market disruption.
2. Market Growth and Investment Potential
The AI and robotics market is experiencing explosive growth. According to industry estimates, the global AI market could exceed $500 billion by the late 2020s, while the robotics market is expected to reach $300 billion within the same period. The growth is fueled by increasing automation demands, technological breakthroughs in AI algorithms, cheaper and faster computing power, and the rising need for efficiency across industries.
For investors, these numbers indicate potential high returns, but the landscape is highly competitive and fragmented. Companies range from large, established tech giants—like NVIDIA, Alphabet, Microsoft, and Boston Dynamics—that provide hardware, software, and AI cloud platforms, to small, specialized startups focused on niche applications such as autonomous delivery, medical diagnostics, or industrial robotics.
3. Investment Approaches
Investors can engage with AI, robotics, and future technologies through multiple approaches:
a. Direct Equity Investment: Buying shares of companies actively involved in AI or robotics allows investors to participate in their growth. For example, semiconductor companies like NVIDIA supply GPUs critical for AI processing, while companies like ABB or Fanuc manufacture industrial robots used globally. Equity investment requires careful selection, as valuations can be volatile, especially for high-growth startups.
b. Exchange-Traded Funds (ETFs) and Mutual Funds: Specialized ETFs, such as those focusing on AI, robotics, or technology innovation, provide diversified exposure without the need to pick individual stocks. These funds often include a mix of large-cap tech companies and emerging innovators, spreading risk while capturing sector-wide growth.
c. Venture Capital and Private Equity: For sophisticated investors, direct investment in early-stage startups in AI, robotics, or frontier technologies offers high growth potential but comes with significant risk. Venture capital funds often focus on transformative technologies such as autonomous vehicles, AI-driven healthcare solutions, or quantum computing startups.
d. Thematic Investment: This involves investing in companies or sectors tied to broader technological trends. For instance, investing in cloud computing providers, semiconductor manufacturers, or 5G infrastructure developers indirectly captures growth in AI and robotics.
4. Key Investment Drivers
Several factors are driving the investment case for AI, robotics, and future technologies:
Automation Demand: Businesses seek efficiency and cost reduction, creating a rising need for robotic automation and AI-driven analytics. Manufacturing, logistics, and warehousing are prime examples where AI-powered robotics enhance productivity.
Technological Innovation: Advancements in machine learning models, robotics hardware, edge computing, and sensor technology continuously expand the capabilities of AI and robotics applications.
Government and Corporate Investment: Many governments recognize AI and robotics as strategic priorities, providing funding and incentives for R&D. Similarly, corporations are allocating massive budgets to integrate AI into operations, supply chains, and customer engagement.
Data Explosion: AI thrives on data. The rapid increase in digital data from IoT devices, social media, and enterprise operations fuels machine learning, creating opportunities for software, cloud infrastructure, and analytics platforms.
Consumer Adoption: Emerging AI-driven applications like autonomous vehicles, smart home devices, AR/VR experiences, and AI-powered healthcare solutions are gaining mainstream acceptance, boosting market potential.
5. Risks and Challenges
Despite the promising growth trajectory, investing in AI, robotics, and future technologies carries inherent risks:
Technological Uncertainty: Not all innovations succeed, and breakthroughs may disrupt existing solutions. Investing in a company before a technology proves scalable carries high risk.
Valuation Volatility: High-growth tech stocks often experience sharp price swings, influenced by market sentiment, regulatory developments, or technological hype cycles.
Regulatory and Ethical Concerns: AI and robotics raise privacy, ethical, and security questions. Regulations may evolve rapidly, affecting market potential for certain applications.
Competition: The sector is highly competitive, with both global tech giants and nimble startups vying for market dominance. Market leadership can shift quickly.
Dependency on Infrastructure: AI and robotics often rely on advanced semiconductors, cloud computing, and connectivity infrastructure. Supply chain disruptions or geopolitical tensions can impact growth.
6. Future Outlook
The long-term outlook for AI, robotics, and future technology investing remains strong. Several megatrends are expected to drive the next decade of growth:
Autonomous Systems: Self-driving cars, drones, and automated logistics platforms will continue to expand, transforming transportation and delivery industries.
Healthcare Revolution: AI-powered diagnostics, robotic surgery, personalized medicine, and drug discovery will redefine healthcare delivery and efficiency.
Industrial and Smart Manufacturing: “Smart factories” utilizing robotics, AI analytics, and IoT devices will optimize production processes and supply chain management.
Human-Machine Collaboration: AI and robotics will increasingly augment human capabilities, from warehouse assistance and office automation to creative and professional tasks.
Sustainable Technologies: Robotics and AI will play a key role in renewable energy, precision agriculture, and environmental monitoring, aligning technological innovation with sustainability goals.
AI-Driven Creativity and Content: Generative AI will continue to disrupt content creation, marketing, entertainment, and design, opening new business models and monetization opportunities.
7. Strategic Considerations for Investors
To invest successfully in AI, robotics, and future technologies:
Diversify: Spread investments across multiple sub-sectors to reduce risk and capture growth from different innovation areas.
Focus on Fundamentals: Evaluate companies based on technological advantage, intellectual property, management capability, and scalability potential.
Stay Informed: Technology evolves rapidly. Continuous research on emerging trends, regulatory changes, and competitive landscapes is critical.
Consider Long-Term Horizon: Many technological innovations take years to achieve commercial success. Patience and a long-term perspective are essential.
Risk Management: Use portfolio strategies to mitigate volatility, including allocation to ETFs, diversified tech funds, or hedging strategies.
Conclusion
Investing in AI, robotics, and future technologies is a journey into the frontiers of innovation, offering opportunities to participate in transformative change across industries and societies. While the growth potential is immense, the risks are equally significant, requiring careful selection, diversification, and continuous monitoring. Investors who understand the interplay between emerging technologies, market dynamics, and societal adoption will be best positioned to capture the rewards of this transformative era.
In essence, AI, robotics, and future technology investing is not just about chasing profits—it is about investing in the future itself, a future increasingly shaped by intelligent machines, autonomous systems, and the relentless pace of technological innovation.
Workfromhome

Global Interest Rate Cycle and Central Bank PoliciesUnderstanding the Global Interest Rate Cycle
The global interest rate cycle is not a single, perfectly synchronized process but rather a broad pattern observed across major economies. It typically consists of four phases:
Easing Phase (Low or Falling Rates): Central banks cut interest rates to stimulate economic activity during periods of slow growth, recession, or financial stress. Lower rates reduce borrowing costs, encourage consumption and investment, and support asset prices.
Recovery and Normalization Phase: As economic conditions improve, central banks gradually raise rates from exceptionally low levels to prevent overheating and restore policy flexibility.
Tightening Phase (Rising Rates): When inflationary pressures build due to strong demand, tight labor markets, or supply constraints, central banks raise rates more aggressively to cool the economy.
Peak and Pause Phase: Interest rates reach a peak when central banks believe policy is sufficiently restrictive. This is often followed by a pause before rates are eventually cut again if growth slows or inflation falls.
These cycles are influenced by global factors such as commodity prices, technological changes, demographic trends, geopolitical tensions, and cross-border capital movements. Because financial markets are highly interconnected, interest rate decisions in major economies—particularly the United States—often have spillover effects on the rest of the world.
Role of Central Banks in Shaping the Cycle
Central banks are the primary architects of interest rate cycles through their monetary policy frameworks. Their core mandates usually include price stability, economic growth, and, in many cases, financial stability and employment. To achieve these objectives, central banks use several tools:
Policy Interest Rates: The benchmark rate (such as the federal funds rate, repo rate, or bank rate) directly influences short-term borrowing costs in the economy.
Open Market Operations: Buying or selling government securities to manage liquidity and influence interest rates.
Reserve Requirements: Adjusting the amount of reserves banks must hold, affecting their capacity to lend.
Unconventional Tools: Quantitative easing (QE), quantitative tightening (QT), forward guidance, and yield curve control, especially when conventional rate tools are constrained.
Through these tools, central banks attempt to align financial conditions with macroeconomic goals, thereby guiding the economy through different phases of the interest rate cycle.
Inflation Control and Interest Rate Decisions
Inflation is the most critical factor influencing central bank interest rate decisions. When inflation rises above target levels, central banks typically increase interest rates to reduce demand and anchor inflation expectations. Higher rates make borrowing more expensive, slow credit growth, and dampen consumer spending and business investment. Conversely, when inflation is too low or deflationary risks emerge, central banks cut rates to stimulate economic activity.
The credibility of a central bank in managing inflation is vital. If markets believe that a central bank will act decisively to control inflation, long-term interest rates and inflation expectations remain stable, reducing the need for extreme policy actions. Thus, interest rate cycles are closely tied to how effectively central banks manage inflation expectations over time.
Growth, Employment, and Monetary Policy Trade-offs
Central banks must constantly balance inflation control with the need to support economic growth and employment. During economic downturns, rate cuts are used to stimulate demand and prevent job losses. However, prolonged periods of low interest rates can lead to excessive risk-taking, asset price bubbles, and misallocation of capital.
In contrast, aggressive rate hikes aimed at controlling inflation can slow growth sharply, increase unemployment, and strain highly indebted sectors. This trade-off makes the timing and pace of interest rate changes a critical aspect of central bank policy, influencing the shape and duration of the global interest rate cycle.
Global Spillovers and Policy Synchronization
In a globalized financial system, interest rate decisions by major central banks—such as the US Federal Reserve, European Central Bank, and Bank of Japan—have significant spillover effects. When a major central bank raises rates, global capital often flows toward that economy in search of higher returns, leading to currency depreciation, higher borrowing costs, and financial stress in emerging markets.
As a result, many central banks adjust their policies not only based on domestic conditions but also in response to global financial trends. This interconnectedness can lead to periods of policy synchronization, where multiple countries tighten or ease monetary policy around the same time, reinforcing the global interest rate cycle.
Exchange Rates and Capital Flows
Interest rate differentials between countries strongly influence exchange rates and capital flows. Higher interest rates tend to attract foreign investment, strengthening a country’s currency, while lower rates may lead to capital outflows and currency depreciation. Central banks must consider these effects when setting policy, especially in open economies.
For emerging markets, managing interest rates is particularly challenging. They must balance domestic growth and inflation objectives with the need to maintain currency stability and attract stable capital flows. Sudden shifts in global interest rate cycles can expose vulnerabilities in economies with high external debt or weak financial systems.
Unconventional Policies and Changing Cycles
In recent decades, traditional interest rate cycles have been altered by the use of unconventional monetary policies. After global financial crises, many central banks kept interest rates near zero for extended periods and relied on asset purchases to stimulate growth. This prolonged low-rate environment reshaped global financial behavior, encouraging leverage and increasing sensitivity to future rate hikes.
As central banks eventually unwind these policies through rate hikes and balance sheet reductions, the global interest rate cycle becomes more complex, with greater market volatility and heightened sensitivity to policy signals.
Long-Term Implications
The global interest rate cycle and central bank policies have long-term implications for debt sustainability, asset valuations, income distribution, and economic resilience. Governments face higher debt servicing costs during tightening phases, while households and businesses must adjust to changing borrowing conditions. Over time, effective central bank policies can smooth economic fluctuations, while policy missteps can amplify cycles and trigger financial instability.
Conclusion
The global interest rate cycle is a dynamic process shaped by economic conditions, inflation trends, and the strategic decisions of central banks. Through interest rate adjustments and broader monetary policy tools, central banks seek to stabilize economies, control inflation, and support sustainable growth. However, in an interconnected global system, these policies also generate cross-border effects, influencing capital flows, exchange rates, and financial stability worldwide. Understanding this relationship is essential for navigating economic cycles and anticipating the broader impact of monetary policy decisions on the global economy.

The Impact of Corporations on Global Trade1. Corporations as Drivers of Globalization
Corporations, particularly multinational corporations (MNCs), are central to the process of globalization. By establishing subsidiaries, joint ventures, and strategic partnerships in multiple countries, corporations integrate local economies into global networks. Companies like Apple, Amazon, Toyota, and Unilever are not merely exporters of goods and services; they are conduits through which capital, technology, and knowledge flow internationally. Their operations help standardize products, services, and business practices worldwide, contributing to a more interconnected global economy.
MNCs often pursue globalization to access new markets, reduce production costs, and diversify risk. For example, a corporation may locate manufacturing facilities in countries with lower labor costs while maintaining research and development hubs in developed nations. This cross-border allocation of resources enhances efficiency, drives competition, and often leads to lower prices for consumers globally.
2. Supply Chains and Production Networks
One of the most significant ways corporations influence global trade is through complex supply chains. Modern corporations do not produce everything in one location; instead, they rely on global production networks. Components of a single product may come from multiple countries before final assembly and sale. For instance, a smartphone may have chips from Taiwan, screens from South Korea, and assembly in China, then be sold worldwide.
These supply chains optimize costs and leverage comparative advantages of different countries. However, they also create vulnerabilities: disruptions in one country can affect production globally. The COVID-19 pandemic and events like the Suez Canal blockage highlighted the fragility of such interconnected systems, demonstrating how corporations can both drive and expose the risks inherent in global trade networks.
3. Economic Power and Market Influence
Corporations wield immense economic power, which directly shapes global trade flows. Large corporations can influence commodity prices, control supply of critical resources, and dominate specific markets. For instance, oil giants such as ExxonMobil, Shell, and BP have historically influenced global oil prices, affecting trade balances and energy security worldwide. Similarly, tech giants like Amazon and Google impact digital trade and e-commerce markets globally, affecting competition and trade policies.
Through mergers, acquisitions, and strategic alliances, corporations consolidate market power, enabling them to negotiate favorable terms with suppliers and governments. This power can shape trade agreements, investment flows, and regulations to align with corporate interests, sometimes at the expense of smaller players or developing countries.
4. Technology Transfer and Innovation
Corporations are key agents in transferring technology across borders. By establishing subsidiaries, licensing technology, or engaging in research collaborations, corporations help spread innovations globally. This can boost productivity, create new industries, and enhance international competitiveness.
For example, the automotive sector has seen a rapid diffusion of electric vehicle technology, largely driven by corporations investing in R&D in multiple countries. Similarly, the pharmaceutical industry relies on cross-border collaborations to develop and distribute vaccines and treatments efficiently. Corporations’ role in innovation thus directly impacts global trade by shaping the competitiveness and capabilities of countries worldwide.
5. Labor, Employment, and Socioeconomic Impact
Corporations affect global trade not just through goods and services but also by shaping labor markets. By locating production in countries with cheaper labor, corporations influence employment patterns, wage structures, and skill development. This can lead to economic growth and job creation in developing countries but may also result in labor exploitation or displacement in other regions.
Moreover, corporations often implement corporate social responsibility (CSR) programs to mitigate negative impacts on communities and promote sustainable practices. Their investment decisions in human capital, education, and skill development have long-term implications for workforce competitiveness and global trade capabilities.
6. Regulatory Influence and Trade Policy
Corporations often interact closely with governments to influence trade policies. Through lobbying, public-private partnerships, and participation in international trade organizations, corporations can shape tariffs, trade agreements, and regulatory standards. Their input can streamline international trade and reduce barriers, but it can also create regulatory environments that favor large corporations over smaller local businesses.
For example, corporations’ influence was critical in shaping agreements like the North American Free Trade Agreement (NAFTA) and the Comprehensive and Progressive Agreement for Trans-Pacific Partnership (CPTPP), which impact global trade flows significantly.
7. Challenges and Criticisms
Despite their contributions to global trade, corporations also face criticism. Their dominance can lead to monopolistic behavior, inequality, and environmental degradation. Outsourcing production to countries with lax environmental standards may reduce costs but can have adverse ecological consequences. Similarly, corporate consolidation can undermine local businesses, skewing trade benefits toward large entities while marginalizing smaller competitors.
Additionally, geopolitical tensions and protectionist policies can disrupt the operations of multinational corporations, creating volatility in trade flows. The dependence on a few corporations for critical goods, such as semiconductors or pharmaceuticals, highlights vulnerabilities in global trade systems.
8. Future Trends
Looking forward, corporations are likely to continue shaping global trade in significant ways. Digitalization, e-commerce, and fintech innovations are enabling corporations to trade digitally, breaking down traditional barriers of distance and regulation. Sustainable and green trade practices are becoming central to corporate strategies, with firms adopting environmentally responsible production methods and supply chain management.
Furthermore, emerging markets are becoming more integrated into global trade networks due to the investments and presence of multinational corporations. As technology advances and global supply chains evolve, corporations will continue to influence trade patterns, economic policies, and the distribution of wealth worldwide.
Conclusion
Corporations play a pivotal role in global trade. They drive globalization, shape supply chains, transfer technology, and influence policy. While their impact brings efficiency, innovation, and economic growth, it also raises concerns about inequality, environmental sustainability, and market dominance. Understanding the multifaceted role of corporations is essential for policymakers, businesses, and society to navigate the opportunities and challenges of global trade effectively.

International Payment GatewaysThe Backbone of Global Digital Transactions:
In today’s interconnected world, businesses and individuals operate beyond geographical boundaries. Whether it is an e-commerce company selling products overseas, a freelancer receiving payments from international clients, or a multinational corporation managing cross-border transactions, international payment gateways play a critical role. These gateways act as secure bridges that enable money to move smoothly between buyers and sellers across different countries, currencies, and banking systems.
What Are International Payment Gateways?
An international payment gateway is a technology-driven financial service that authorizes, processes, and settles online payments across borders. It connects merchants, customers, banks, card networks, and financial institutions, ensuring that a transaction initiated in one country can be completed in another. These gateways support multiple payment methods such as credit cards, debit cards, bank transfers, digital wallets, and sometimes even local payment systems specific to a country or region.
At their core, international payment gateways ensure security, speed, and reliability in global transactions while complying with international financial regulations.
How International Payment Gateways Work
The process begins when a customer initiates a payment on a merchant’s website or app. The payment gateway encrypts sensitive data such as card details and transmits it to the acquiring bank. The acquiring bank then forwards the request to the relevant card network (Visa, Mastercard, etc.), which communicates with the issuing bank of the customer. The issuing bank verifies the details and either approves or declines the transaction. Once approved, the funds are settled and eventually credited to the merchant’s account after currency conversion and fee deductions.
Although this entire process happens in a matter of seconds, it involves multiple institutions and complex backend systems working in harmony.
Key Features of International Payment Gateways
One of the most important features of international payment gateways is multi-currency support. Customers can pay in their local currency, while merchants receive funds in their preferred settlement currency. This reduces friction and improves the customer experience.
Another essential feature is payment method diversity. Different countries prefer different payment modes—credit cards dominate in the US, bank transfers are common in Europe, and digital wallets are popular in Asia. International gateways integrate these methods to cater to a global audience.
Security and fraud prevention are also critical. Gateways use encryption, tokenization, two-factor authentication, and compliance standards such as PCI-DSS to protect transactions. Advanced gateways also employ AI-driven fraud detection to minimize chargebacks and unauthorized payments.
Importance of International Payment Gateways in Global Trade
International payment gateways have become the backbone of global e-commerce and digital trade. They enable small businesses and startups to access international markets without setting up foreign bank accounts or local entities. This democratization of global commerce has empowered entrepreneurs, freelancers, and service providers worldwide.
For multinational companies, these gateways streamline financial operations by centralizing payment processing, improving cash flow visibility, and reducing administrative complexity. In sectors such as travel, education, SaaS, and digital content, international payment gateways are indispensable.
Benefits for Businesses
For businesses, international payment gateways offer several advantages. They expand market reach by allowing merchants to accept payments from customers worldwide. Faster settlements improve liquidity and working capital management. Automated currency conversion reduces operational hassle, while detailed reporting and analytics help businesses track international sales performance.
Additionally, offering trusted global payment options builds customer confidence. When customers see familiar payment methods, they are more likely to complete transactions, reducing cart abandonment rates.
Challenges and Limitations
Despite their advantages, international payment gateways come with challenges. Transaction fees are often higher than domestic payments due to currency conversion costs, cross-border charges, and intermediary fees. Businesses must factor these costs into pricing strategies.
Regulatory compliance is another challenge. Different countries have varying financial laws, taxation rules, and data protection regulations. Payment gateways must continuously adapt to remain compliant, and merchants must also understand local requirements.
Currency fluctuations can impact profitability, especially for businesses operating on thin margins. Delays in settlement or chargeback disputes can also affect cash flow if not managed properly.
Role of Technology and Innovation
Technology has significantly transformed international payment gateways. Cloud computing, APIs, and fintech innovations have made integrations faster and more flexible. Modern gateways offer plug-and-play solutions that can be integrated into websites and mobile apps with minimal technical effort.
Blockchain and real-time payment networks are emerging as potential game changers, promising faster settlements, lower costs, and increased transparency. Artificial intelligence is enhancing fraud detection, risk assessment, and customer authentication, making cross-border payments safer than ever.
Use Cases Across Industries
International payment gateways are widely used across industries. In e-commerce, they enable global sales and subscription-based models. In freelancing and remote work, they allow professionals to receive payments from clients worldwide. Education platforms rely on them to collect international tuition fees, while travel and hospitality businesses use them to process bookings from international travelers.
Even financial markets and investment platforms depend on robust international payment systems to facilitate fund transfers, trading margins, and settlement processes.
Future of International Payment Gateways
The future of international payment gateways is closely tied to the growth of digital economies and global connectivity. As cross-border trade continues to expand, gateways will focus on reducing costs, improving speed, and enhancing user experience. Localization, regulatory adaptability, and seamless mobile payments will be key drivers.
The integration of digital currencies and central bank digital currencies (CBDCs) may further reshape international payments, offering new possibilities for instant and low-cost cross-border transactions.
Conclusion
International payment gateways are more than just transaction processors—they are enablers of global economic participation. By bridging currencies, countries, and financial systems, they make international trade accessible, efficient, and secure. For businesses aiming to grow beyond borders, choosing the right international payment gateway is a strategic decision that can influence customer trust, operational efficiency, and long-term success.

International Finance TransformedEvolution from Traditional to Modern International Finance
Historically, international finance revolved around trade financing, foreign exchange settlements, and long-term development loans provided by institutions such as the International Monetary Fund (IMF) and the World Bank. Capital flows were relatively slow, heavily regulated, and largely controlled by national governments. Exchange rates were often fixed or tightly managed, and cross-border investments were limited.
The collapse of the Bretton Woods system in the early 1970s marked a turning point. Floating exchange rates replaced fixed regimes, increasing currency volatility but also enhancing market efficiency. Over time, countries liberalized their capital accounts, allowing money to move more freely across borders. This shift laid the foundation for a more dynamic and interconnected international financial system.
Globalization and Capital Mobility
One of the most significant transformations in international finance has been the dramatic increase in capital mobility. Globalization enabled investors to allocate capital across borders in search of higher returns and diversification benefits. Foreign direct investment (FDI), portfolio investments, and cross-border lending expanded rapidly, linking national economies more tightly than ever before.
Multinational corporations became key players in international finance, raising funds globally, managing foreign exchange risks, and optimizing capital structures across multiple jurisdictions. Financial markets, once largely domestic, evolved into global platforms where equities, bonds, derivatives, and currencies are traded around the clock.
While increased capital mobility has supported economic growth and development, it has also introduced vulnerabilities. Sudden capital inflows and outflows can destabilize economies, as seen during the Asian Financial Crisis, the Global Financial Crisis of 2008, and more recent emerging market shocks.
Technological Innovation and Digital Finance
Technology has been a powerful catalyst in transforming international finance. Advances in information technology, telecommunications, and data analytics have drastically reduced transaction costs and increased market transparency. Electronic trading platforms, real-time settlement systems, and algorithmic trading have revolutionized how financial assets are priced and exchanged globally.
The rise of digital finance, including fintech innovations, blockchain technology, and cryptocurrencies, has further disrupted traditional international financial systems. Cross-border payments, once slow and expensive, can now be executed in near real-time using digital platforms. Blockchain-based solutions promise greater efficiency, security, and transparency in international settlements and trade finance.
Central banks are also adapting to this transformation by exploring central bank digital currencies (CBDCs), which could redefine international monetary relations, reserve currency dynamics, and cross-border payment systems.
Transformation of Foreign Exchange Markets
Foreign exchange (forex) markets lie at the heart of international finance, and they too have been transformed. Today, the forex market is the largest and most liquid financial market in the world, operating 24 hours a day across global financial centers.
Technological advancements have enabled electronic trading, high-frequency strategies, and instant access for participants ranging from central banks and multinational corporations to hedge funds and retail traders. Exchange rate determination is now more market-driven, reflecting global macroeconomic conditions, interest rate differentials, capital flows, and geopolitical developments.
This transformation has improved efficiency and liquidity but has also increased volatility and complexity, making currency risk management a critical function for governments and businesses alike.
Changing Role of International Financial Institutions
International financial institutions have evolved significantly in response to global economic changes. Organizations such as the IMF, World Bank, and regional development banks have expanded their roles beyond traditional lending. They now focus on financial stability, policy coordination, poverty reduction, climate finance, and crisis prevention.
During periods of global stress, these institutions act as lenders of last resort and coordinators of international policy responses. Their influence has grown, but so have debates around governance, representation, and conditionality, especially as emerging economies seek a greater voice in global financial decision-making.
Financial Regulation and Risk Management
The transformation of international finance has necessitated stronger regulatory frameworks. The Global Financial Crisis exposed systemic weaknesses in global banking and financial markets, prompting reforms such as higher capital requirements, stress testing, and enhanced supervision.
International coordination through bodies like the Financial Stability Board and the Basel Committee has improved oversight of global financial institutions. Risk management has become more sophisticated, using derivatives, hedging strategies, and advanced analytics to manage exposure to interest rates, currencies, and credit risks.
Despite these improvements, regulatory challenges persist due to differences in national regulations, regulatory arbitrage, and the rapid pace of financial innovation.
Emerging Markets and Shifting Power Dynamics
Emerging markets have become increasingly influential in international finance. Countries such as China, India, and Brazil now play a significant role in global capital flows, trade finance, and currency markets. The rise of new financial centers and institutions reflects a gradual shift in economic power from advanced economies to emerging ones.
Alternative financial arrangements, such as regional development banks and bilateral currency swap agreements, have emerged alongside traditional institutions. These developments signal a more multipolar international financial system, where influence is shared among a broader group of nations.
Impact of Geopolitics and Sustainability
Geopolitical factors have gained prominence in shaping international finance. Sanctions, trade disputes, and geopolitical tensions affect capital flows, currency stability, and investment decisions. Financial systems are increasingly used as tools of foreign policy, influencing global financial architecture.
At the same time, sustainability considerations are transforming international finance. Climate change, environmental risks, and social governance issues have led to the growth of green finance, sustainable bonds, and ESG-focused investments. International finance is no longer driven solely by returns but also by long-term environmental and social impact.
Conclusion
International finance has been fundamentally transformed into a fast-moving, technology-driven, and globally interconnected system. While these changes have enhanced efficiency, access to capital, and economic integration, they have also introduced new risks, complexities, and inequalities. The future of international finance will depend on how effectively policymakers, institutions, and market participants balance innovation with stability, globalization with resilience, and growth with sustainability. As the global economy continues to evolve, international finance will remain a central force shaping economic development, cooperation, and competition worldwide.

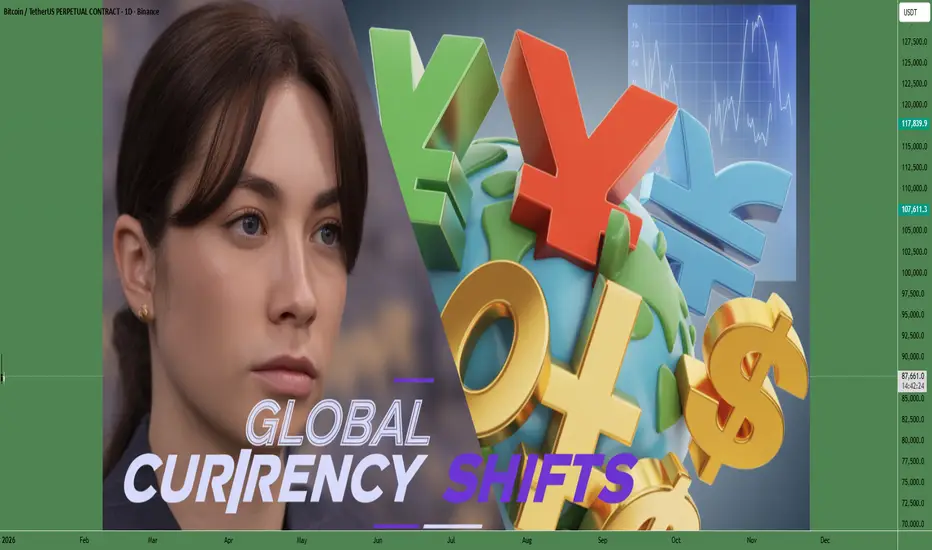
Global Currency ShiftsTransformations in the International Monetary Landscape
Introduction to Global Currency Shifts
Global currency shifts refer to long-term and short-term changes in the relative value, usage, dominance, and influence of national currencies in the global financial system.
These shifts are driven by economic growth patterns, trade balances, monetary policy decisions, geopolitical developments, technological innovation, and investor confidence.
In recent decades, the global economy has moved away from a single-currency-dominated system toward a more multipolar currency environment.
Historical Context of Currency Dominance
Historically, global currency leadership has shifted from the British pound during the colonial and gold-standard era to the US dollar after World War II.
The Bretton Woods system cemented the dollar’s role as the world’s reserve currency, backed initially by gold and later by US economic strength.
Over time, changing economic realities have challenged this dominance, leading to gradual diversification.
Role of the US Dollar in Global Shifts
The US dollar remains the most widely used reserve, trade invoicing, and settlement currency.
However, its share in global reserves has slowly declined as countries diversify holdings into other currencies.
Expansionary fiscal policies, rising debt levels, and frequent use of financial sanctions have influenced perceptions of dollar risk.
Emergence of Multipolar Currency System
A multipolar system involves multiple currencies sharing global influence instead of one dominant currency.
The euro, Chinese yuan, Japanese yen, and British pound now play important regional and functional roles.
This diversification reduces systemic risk but increases complexity in global trade and finance.
Rise of the Chinese Yuan (Renminbi)
China’s growing share of global trade has increased the international use of the yuan.
Bilateral trade agreements increasingly allow settlement in yuan instead of dollars.
Inclusion of the yuan in global reserve baskets marked a significant milestone, though capital controls still limit full convertibility.
Euro’s Role in Currency Shifts
The euro serves as the second most important reserve currency globally.
Its strength depends on economic integration, fiscal discipline, and political unity within the eurozone.
Periodic debt crises have slowed its rise but have not eliminated its global relevance.
Impact of De-dollarization Trends
De-dollarization refers to efforts by countries to reduce reliance on the US dollar in trade, reserves, and debt.
Motivations include reducing exposure to US monetary policy and geopolitical pressure.
While de-dollarization is gradual, it reflects a strategic shift rather than an abrupt replacement.
Currency Shifts and Global Trade Patterns
Trade invoicing increasingly reflects regional currency preferences.
Energy and commodity contracts, traditionally priced in dollars, are seeing experimentation with alternative currencies.
This reduces currency risk for exporters and importers within the same economic bloc.
Central Bank Policies and Interest Rate Differentials
Diverging interest rate policies strongly influence currency movements.
Higher interest rates attract capital inflows, strengthening currencies, while accommodative policies weaken them.
Policy divergence among major central banks contributes to volatility in exchange rates.
Inflation, Debt, and Currency Valuation
High inflation erodes purchasing power and undermines currency confidence.
Countries with rising public debt face pressure on their currencies if investors doubt repayment sustainability.
Sound fiscal and monetary discipline remains critical for currency stability.
Role of Emerging Market Currencies
Emerging market currencies are increasingly important in global trade and investment flows.
These currencies tend to be more volatile due to capital flow sensitivity and external shocks.
Strengthening domestic financial systems improves their long-term credibility.
Geopolitical Influences on Currency Shifts
Wars, sanctions, trade conflicts, and diplomatic alliances significantly affect currency preferences.
Countries under sanctions often seek alternative payment systems and reserve currencies.
Geopolitical fragmentation accelerates currency diversification.
Technological Advancements and Digital Currencies
Digital payment systems and blockchain technology are reshaping cross-border transactions.
Central bank digital currencies (CBDCs) may alter how currencies are used internationally.
Technology reduces transaction costs and weakens traditional currency monopolies.
Role of Capital Flows and Investment Sentiment
Global investors move capital based on growth prospects, stability, and returns.
Safe-haven currencies benefit during periods of uncertainty, while risk currencies suffer.
Shifts in sentiment can rapidly change exchange rate dynamics.
Commodity Prices and Currency Correlations
Commodity-exporting nations often see their currencies move in line with global commodity prices.
Rising commodity demand strengthens these currencies, while downturns weaken them.
This creates cyclical currency behavior linked to global growth.
Impact on Developing Economies
Currency shifts affect debt servicing costs, import prices, and inflation in developing countries.
Dollar strength often pressures emerging markets with dollar-denominated debt.
Diversification strategies help reduce vulnerability to external shocks.
Financial Stability and Systemic Risk
A more diversified currency system can reduce dependence on one economy.
However, it may also increase coordination challenges among central banks.
Global financial stability depends on cooperation and transparent policy frameworks.
Corporate and Business Implications
Multinational corporations must manage currency risk more actively.
Hedging strategies and multi-currency invoicing are increasingly important.
Currency shifts influence investment decisions and profit margins.
Long-Term Outlook for Global Currencies
No single currency is likely to completely replace the US dollar in the near future.
Gradual evolution toward shared dominance is the most probable scenario.
Stability, trust, and economic strength will determine future leaders.
Conclusion: Strategic Importance of Currency Shifts
Global currency shifts reflect deeper changes in economic power, politics, and technology.
Understanding these shifts is crucial for policymakers, investors, and businesses.
As the world economy becomes more interconnected yet fragmented, currency dynamics will remain a central force shaping global finance.
Dark Pools Exposed: The Hidden Side of Modern Financial MarketsOrigins and Purpose of Dark Pools
Dark pools emerged in the late 20th century as a response to a genuine market problem. Large institutional investors—such as mutual funds, pension funds, and insurance companies—often need to buy or sell millions of shares at a time. Executing such large orders on public exchanges can significantly move prices against them, a phenomenon known as market impact. For example, if the market sees a massive buy order, prices may rise before the order is fully executed, increasing costs for the buyer.
Dark pools were designed to solve this issue by allowing institutions to match large orders anonymously, minimizing price disruption and reducing transaction costs. In theory, this benefits the market by enabling smoother execution of large trades without unnecessary volatility.
How Dark Pools Actually Work
In practice, dark pools match buyers and sellers internally, often using prices derived from public exchanges (known as the “midpoint” of the best bid and offer). Trades are reported to the public tape only after execution, meaning the market learns about the transaction after the fact, not while it is happening.
There are different types of dark pools. Some are operated by large investment banks, others by independent firms, and some are run by exchanges themselves as off-exchange venues. Each type has its own rules regarding who can participate, how orders are matched, and what level of information is disclosed.
The Exposure: Why Dark Pools Are Under Scrutiny
“Dark pools exposed” reflects the increasing concern that these venues may no longer serve only their original purpose. Over time, dark pools have grown dramatically in size and influence. In some major markets, a significant percentage of daily trading volume now occurs off-exchange. This shift has raised several red flags.
One major issue is transparency. Because orders are hidden, the public market may not reflect the true supply and demand for a stock. This can distort price discovery, which is the process by which markets determine the fair value of securities. When too much trading happens in the dark, prices on public exchanges may become less reliable.
Another concern is fairness. Retail investors typically trade on lit exchanges, where they can see prices and volumes. Institutional players, on the other hand, often have access to dark pools, advanced algorithms, and preferential routing. This creates a two-tiered market, where sophisticated participants operate with more information and better execution options than everyday investors.
Dark Pools and High-Frequency Trading
One of the most controversial aspects of dark pools is their interaction with high-frequency trading (HFT). While dark pools were originally intended for long-term institutional investors, some have allowed HFT firms to participate. Critics argue that this undermines the very purpose of dark pools.
High-frequency traders use speed and algorithms to detect patterns, exploit tiny price differences, and react in microseconds. In some cases, HFT firms can infer the presence of large institutional orders in dark pools and trade ahead of them on public exchanges, a practice often referred to as “predatory trading.” This has led to accusations that certain dark pools effectively enable front-running, even if indirectly.
Regulatory Response and Investigations
As dark pools have grown, regulators around the world have begun to “expose” their inner workings through investigations, fines, and new rules. In the United States, the Securities and Exchange Commission (SEC) has fined several banks for misleading clients about how their dark pools operated, particularly regarding the presence of high-frequency traders. These cases revealed that some dark pools were not as neutral or protective as advertised.
In Europe, regulations such as MiFID II introduced caps on dark pool trading volumes and stricter reporting requirements. The goal was to push more trading back onto transparent, regulated exchanges and restore confidence in price discovery. Other markets, including India, have taken a more cautious approach, limiting or tightly regulating off-exchange trading to prevent excessive opacity.
Impact on Market Volatility and Stability
Another dimension of dark pools exposed is their impact on market stability. During periods of market stress, liquidity in dark pools can evaporate quickly, as participants withdraw to avoid risk. This can exacerbate volatility on public exchanges, where remaining orders may be thinner and more reactive.
Because dark pools rely on public markets for price references, any disruption in lit exchanges can ripple through the dark ecosystem. This interconnectedness means that while dark pools may seem separate, they are deeply embedded in the broader financial system.
Are Dark Pools Always Bad?
Despite the criticism, it is important to recognize that dark pools are not inherently malicious. When properly regulated and transparently operated, they can provide genuine benefits. Large institutions can execute trades efficiently, reducing costs that might otherwise be passed on to pensioners, mutual fund investors, and policyholders.
The problem arises when dark pools grow too large, operate with insufficient oversight, or prioritize profit over fairness. Lack of clear disclosure, conflicts of interest (especially in bank-owned pools), and unequal access can turn a useful market tool into a source of systemic risk and mistrust.
The Future: Toward Greater Transparency
The exposure of dark pools has sparked an ongoing debate about the future structure of financial markets. Some argue for stricter limits or even the elimination of dark pools, pushing all trading onto transparent exchanges. Others advocate for smarter regulation—enhancing disclosure, enforcing fair access rules, and ensuring that dark pools genuinely serve their stated purpose.
Technological advances, such as blockchain-based trading systems and real-time reporting tools, may also play a role in bridging the gap between efficiency and transparency. The challenge for regulators and market participants alike is to balance the need for liquidity and low trading costs with the fundamental principles of fairness and open price discovery.
Conclusion
“Dark Pools Exposed” is not just a phrase; it represents a broader reckoning within modern finance. As hidden trading venues continue to shape market outcomes, understanding their mechanics, benefits, and risks becomes essential for investors, regulators, and policymakers. Dark pools began as a solution to a real problem, but their evolution has raised critical questions about transparency, equality, and trust in financial markets. Exposing how they work—and where they can go wrong—is a crucial step toward building markets that are not only efficient, but also fair and resilient.

De-Dollarization and Currency WarsThe Shifting Battle for Global Monetary Power
The global financial system is entering a period of profound transformation, marked by two interlinked phenomena: de-dollarization and currency wars. For more than seven decades, the US dollar has stood at the center of global trade, finance, and reserves. It has been the primary invoicing currency for commodities, the dominant reserve asset for central banks, and the preferred safe haven during crises. However, geopolitical tensions, economic realignments, and structural imbalances are increasingly challenging this dominance. As nations seek to reduce reliance on the dollar and protect their economic interests, currency competition has intensified, giving rise to what is often described as modern currency wars.
Understanding De-Dollarization
De-dollarization refers to the gradual reduction in the use of the US dollar in international trade, financial transactions, foreign exchange reserves, and domestic economies. This does not imply the sudden collapse of the dollar’s role, but rather a slow and strategic diversification away from it. Countries pursue de-dollarization for several reasons.
First, geopolitical risk plays a major role. The extensive use of financial sanctions by the United States and its allies has highlighted the vulnerability of countries that depend heavily on the dollar-based financial system. Freezing of foreign exchange reserves and restrictions on dollar clearing have motivated nations to seek alternatives that provide greater monetary sovereignty.
Second, economic self-interest drives de-dollarization. Many emerging economies face currency volatility, imported inflation, and balance-of-payments pressures when the dollar strengthens. Reducing dollar exposure can help stabilize domestic economies and lower dependence on US monetary policy decisions, such as interest rate hikes by the Federal Reserve.
Third, regional integration and bilateral trade arrangements are encouraging the use of local currencies. Trade settlements in yuan, ruble, rupee, dirham, or euro are becoming more common, especially among countries with strong trade ties or shared political interests.
Mechanisms of De-Dollarization
De-dollarization manifests through several channels. One key method is diversification of foreign exchange reserves. Central banks are gradually increasing allocations to gold, the euro, the Chinese yuan, and other assets, while marginally reducing dollar holdings. Gold, in particular, has regained prominence as a neutral, sanction-resistant reserve asset.
Another mechanism is local-currency trade settlement. Countries are signing bilateral and multilateral agreements to invoice and settle trade in their own currencies, bypassing the dollar. This reduces transaction costs and currency risk while strengthening domestic financial systems.
A third channel is the development of alternative payment systems. Efforts to reduce reliance on dollar-centric systems have led to the creation of domestic and regional financial messaging and settlement platforms, as well as experimentation with central bank digital currencies (CBDCs).
What Are Currency Wars?
Currency wars occur when countries deliberately attempt to weaken their currencies to gain trade advantages, boost exports, or protect domestic growth. Unlike traditional trade wars that rely on tariffs and quotas, currency wars operate through monetary policy, foreign exchange intervention, and capital controls.
In a globalized economy, a weaker currency makes exports cheaper and more competitive, while imports become more expensive. This can support domestic industries and employment, but it can also trigger retaliation from trading partners. When multiple countries engage in competitive devaluation, the result is heightened volatility, inflationary pressures, and financial instability.
The Link Between De-Dollarization and Currency Wars
De-dollarization and currency wars are deeply interconnected. As countries move away from the dollar, exchange rate dynamics become more complex. Reduced dollar usage does not eliminate competition; instead, it redistributes it across multiple currencies.
When nations promote their own currencies for trade and reserves, they also seek to maintain favorable exchange rates. This can lead to implicit currency wars, where monetary easing, interest rate differentials, and managed exchange rates are used to influence capital flows and trade balances.
Furthermore, the weakening of dollar dominance could reduce the stabilizing effect of a single global anchor currency. In a more fragmented system, exchange rate volatility may increase, making currency management a more active and strategic policy tool.
Implications for Global Trade
The rise of de-dollarization may gradually reshape global trade patterns. A multipolar currency system could reduce the efficiency that came from a single dominant settlement currency, but it may also make trade more resilient by spreading risk across multiple currencies.
For exporters and importers, currency risk management will become more complex. Businesses may need to hedge exposure to several currencies rather than primarily the dollar. At the same time, countries with strong regional influence may benefit as their currencies gain greater acceptance in cross-border trade.
Impact on Emerging Markets
Emerging markets stand at the center of these shifts. On one hand, reduced dollar dependence can lower vulnerability to external shocks, particularly those caused by rapid changes in US monetary policy. On the other hand, currency wars can expose these economies to speculative capital flows and exchange rate instability.
For countries like India, balancing currency stability with export competitiveness is crucial. Excessive currency depreciation can fuel inflation, while excessive appreciation can hurt export growth. In a world of currency competition, prudent macroeconomic management becomes even more important.
The Future of the US Dollar
Despite the momentum behind de-dollarization, the US dollar is unlikely to lose its dominant position in the near term. Its strength lies in the depth of US financial markets, the rule of law, institutional credibility, and the dollar’s role as a safe haven during crises. However, its share of global reserves and trade settlement may continue to decline gradually.
Rather than a replacement, the future is more likely to be a multipolar currency system, where the dollar coexists with other major currencies such as the euro and the yuan. This transition will be slow, uneven, and shaped by geopolitical developments, economic reforms, and market confidence.
Conclusion
De-dollarization and currency wars represent a fundamental shift in the global monetary landscape. They reflect a world that is becoming more fragmented, multipolar, and strategically competitive. While de-dollarization seeks to reduce dependency and enhance sovereignty, currency wars highlight the risks of competitive policy actions in an interconnected system.
The challenge for policymakers is to navigate this transition without triggering excessive instability. Cooperation, transparency, and sound economic fundamentals will be essential. For investors, businesses, and governments alike, understanding these dynamics is no longer optional—it is central to navigating the future of global finance.

Understanding the Forces Shaping Worldwide Economies1. Economic Drivers of Market Movements
At the core of global market fluctuations are economic indicators that provide insights into growth, inflation, and employment. Gross Domestic Product (GDP) growth rates, unemployment figures, and consumer spending patterns all influence investor confidence. For instance, when major economies like the United States, China, or the European Union show slower growth, global markets often react negatively, fearing reduced demand for goods and services worldwide. Conversely, strong economic performance in leading nations can boost market sentiment and fuel investment across sectors.
Monetary policies also play a crucial role. Central banks, such as the Federal Reserve or the European Central Bank, control interest rates and money supply. A rate hike to curb inflation can reduce liquidity in markets, affecting stock and bond prices globally. Similarly, quantitative easing or stimulus measures can inject capital into financial systems, boosting asset prices. Exchange rates and currency stability further affect international trade and investments, especially for emerging markets that depend heavily on foreign capital flows.
2. Geopolitical Events and Market Volatility
Global markets are extremely sensitive to geopolitical tensions, including conflicts, sanctions, and trade wars. For example, tensions between major powers can disrupt supply chains, increase commodity prices, and reduce investor confidence. Trade disputes, such as tariffs imposed between countries, directly affect multinational corporations, altering profit expectations and causing stock market fluctuations. Political instability in key regions, such as the Middle East or parts of Africa, can impact oil prices and global energy markets, influencing inflation and production costs worldwide.
Natural disasters and environmental issues are increasingly significant in affecting markets. Hurricanes, floods, or wildfires disrupt production and logistics, affecting commodity supply chains. Climate change concerns drive investment shifts toward sustainable technologies, reshaping global market priorities and creating winners and losers in different sectors.
3. Technological Disruption and Market Adaptation
Technology has transformed global markets, accelerating the pace at which information is disseminated and trades are executed. Innovations in artificial intelligence, blockchain, and financial technologies (FinTech) have created new investment opportunities while also introducing risks. Rapid changes in technology can disrupt traditional industries; for example, renewable energy innovations impact the fossil fuel sector, while automation reshapes manufacturing labor dynamics. Investors react quickly to these shifts, often leading to volatility in global stock exchanges.
Additionally, digital trading platforms and algorithmic trading amplify the speed and scale of market reactions. News spreads globally in seconds, influencing investor behavior and triggering rapid market movements. While these technological advancements increase market efficiency, they also create susceptibility to sudden corrections and speculative bubbles.
4. Globalization and Interconnectedness
One of the defining features of modern markets is globalization. No country’s market operates in isolation. Financial integration means that an economic shock in one nation can have cascading effects worldwide. The 2008 global financial crisis is a prime example: the collapse of the U.S. housing market and financial institutions triggered recessions in Europe, Asia, and beyond. Similarly, a slowdown in China, the world’s manufacturing hub, can affect commodity prices, supply chains, and corporate earnings globally.
Trade networks, investment flows, and multinational corporations link countries economically, while global indices and mutual funds spread exposure across continents. This interconnectedness allows for diversification but also means that systemic risks can propagate quickly.
5. Market Sentiment and Investor Psychology
Investor psychology significantly impacts global markets. Fear, uncertainty, and speculation can lead to sudden sell-offs or bubbles. Market sentiment often amplifies the effect of fundamental events. For instance, even minor geopolitical news can trigger sharp declines if investors perceive risk, while positive economic announcements can fuel rallies. Behavioral finance highlights that emotions, herd behavior, and perception of risk often override rational decision-making, causing markets to react disproportionately.
Media coverage, social networks, and financial news outlets shape market sentiment globally. The instantaneous spread of information allows sentiment to influence international markets simultaneously, creating synchronized movements across regions.
6. Emerging Markets and Their Vulnerability
Emerging markets are particularly vulnerable to global market fluctuations. These economies often rely on exports, foreign investments, and commodity revenues. Changes in global demand, interest rates in developed nations, or capital outflows can destabilize emerging markets’ currencies, stock exchanges, and debt markets. While emerging markets offer high growth potential, they are highly sensitive to global volatility, highlighting the asymmetric impact of global market shocks.
7. The Role of Commodities and Energy Markets
Commodities—oil, metals, agricultural products—are highly sensitive to global market trends. Price fluctuations in these markets affect inflation, corporate costs, and trade balances. Energy markets, particularly oil and gas, are closely tied to geopolitical developments. A disruption in supply due to political conflicts or natural disasters can lead to global price spikes, affecting industries and consumers worldwide. Similarly, agricultural market disruptions can lead to food inflation and social unrest in dependent regions.
8. Strategies for Navigating Global Market Uncertainty
Investors, corporations, and governments employ several strategies to mitigate the impact of market fluctuations. Diversification across regions, sectors, and asset classes reduces exposure to localized shocks. Hedging through derivatives, such as options and futures, allows market participants to manage risk. Central banks and regulatory authorities also intervene with policies to stabilize financial systems during crises.
For businesses, understanding global supply chains, geopolitical risks, and currency exposure is critical. Long-term planning involves scenario analysis, stress testing, and adapting business models to changing global dynamics. Individual investors increasingly focus on sustainable and resilient investments, considering environmental, social, and governance (ESG) factors, which have shown relative stability during turbulent periods.
Conclusion
Global markets are inherently interconnected and influenced by a broad spectrum of economic, political, technological, and environmental factors. Their behavior reflects both tangible indicators, like GDP growth or commodity prices, and intangible forces, such as investor sentiment and geopolitical uncertainty. Understanding these influences is essential for investors, policymakers, and businesses to navigate risks and capitalize on opportunities.
The impact of global market fluctuations extends far beyond stock prices—it affects employment, production, trade, and the overall well-being of societies. As markets become increasingly complex and technology-driven, participants must remain vigilant, adaptable, and informed. Awareness of the intricate forces shaping global markets enables smarter decisions, resilience in the face of volatility, and a proactive approach to both challenges and opportunities in the world economy.

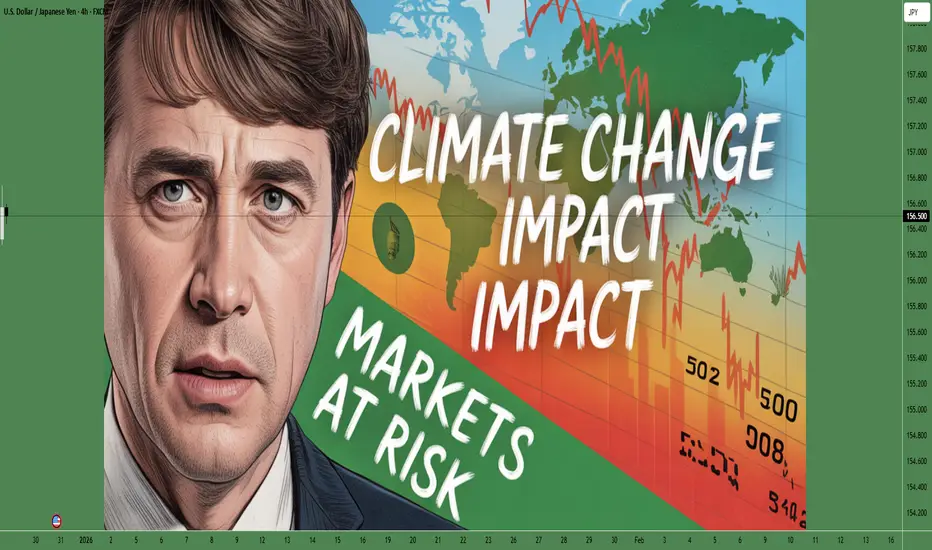
Climate Change: Market at Risk Understanding the Economic Implications
Climate change has evolved from being a purely environmental concern to a pressing economic and financial risk that impacts markets globally. Rising temperatures, extreme weather events, sea-level rise, and shifts in precipitation patterns are no longer abstract environmental phenomena—they are tangible forces reshaping industries, influencing investment decisions, and challenging the stability of global markets. This analysis explores the multifaceted ways in which climate change affects markets, investors, and economies, highlighting why understanding and addressing these risks is essential for long-term financial resilience.
1. Physical Risks: Direct Threats to Assets and Supply Chains
One of the most immediate ways climate change impacts markets is through physical risks. Extreme weather events such as hurricanes, floods, wildfires, and heatwaves can cause direct damage to infrastructure, production facilities, and logistical networks. For instance, floods in industrial hubs can halt manufacturing, disrupt supply chains, and reduce output, causing sudden market shocks. Agricultural sectors are particularly vulnerable, as changing rainfall patterns, droughts, and pest infestations can destroy crops and reduce commodity supply, leading to price volatility. Investors holding assets in vulnerable regions face increased uncertainty and potential losses, compelling markets to price in these risks.
Physical risks also extend to property markets. Coastal cities facing sea-level rise may see real estate values decline, impacting banks and investment portfolios with exposure to these areas. Similarly, insurance companies bear increasing claims from climate-related damages, potentially affecting the stability of the broader financial system. These physical risks underscore that climate change is not merely a future threat—it is already shaping asset valuations and market dynamics today.
2. Transition Risks: Economic Shifts Towards a Low-Carbon Future
Markets are not only affected by direct climate events but also by the transition toward a low-carbon economy. Transition risks arise from policy changes, technological innovations, and evolving consumer preferences aimed at reducing greenhouse gas emissions. Governments worldwide are implementing carbon taxes, emissions trading schemes, and stricter environmental regulations. Companies that fail to adapt—especially in carbon-intensive sectors like energy, transportation, and heavy industry—face increased costs, regulatory penalties, and declining competitiveness.
These transition dynamics influence markets by altering sectoral valuations. Renewable energy firms, electric vehicle manufacturers, and sustainable technology providers are attracting substantial investment, reflecting a shift in market sentiment toward companies aligned with climate goals. Conversely, traditional fossil fuel companies may see their stock values decline as investors anticipate reduced demand, regulatory pressures, and potential stranded assets. Financial markets are increasingly incorporating transition risk into pricing models, reshaping capital allocation patterns globally.
3. Market Volatility and Financial Stability
Climate change contributes to heightened market volatility and systemic financial risk. Sudden extreme events or policy shocks can lead to abrupt shifts in asset prices, liquidity constraints, and investor panic. For example, a severe drought affecting agricultural output can spike food prices, triggering inflationary pressures and affecting consumer spending across economies. Similarly, unexpected regulatory changes targeting carbon emissions can create uncertainty for corporate earnings and stock valuations.
Financial institutions are particularly exposed to climate-related risks. Banks, insurers, and investment funds with portfolios concentrated in vulnerable sectors or regions may face significant losses. Central banks are increasingly recognizing climate risks as a threat to financial stability, prompting stress testing frameworks and disclosure requirements for climate-related exposures. These measures aim to enhance market resilience, but the underlying volatility caused by climate uncertainty remains a challenge for investors and policymakers alike.
4. Sectoral Impacts: Winners and Losers
The effects of climate change on markets are not uniform; different sectors experience varied levels of risk and opportunity.
Energy Sector: Fossil fuel companies face declining demand and regulatory pressures, while renewable energy and clean technology sectors are gaining investor confidence.
Agriculture: Climate variability directly affects crop yields, commodity prices, and supply chain reliability, creating high exposure for agribusinesses.
Insurance and Reinsurance: Increasing claims from climate disasters drive up premiums and can strain the capital base of insurers.
Real Estate: Properties in flood-prone or wildfire-prone regions are losing value, affecting mortgage markets and institutional real estate portfolios.
Financial Services: Banks and investment funds exposed to vulnerable sectors face credit risk, default risk, and valuation uncertainty.
Understanding sector-specific risks is crucial for investors seeking to hedge against losses and capitalize on emerging opportunities in the green economy.
5. Investor Behavior and Market Adaptation
Climate change is shaping investor behavior in profound ways. Environmental, Social, and Governance (ESG) criteria are becoming central to investment decisions. Institutional investors, including pension funds and sovereign wealth funds, increasingly incorporate climate risk analysis into their portfolio management strategies. This shift is creating new market dynamics, with capital flowing toward sustainable industries and away from carbon-intensive sectors.
Markets are also adapting through innovations such as green bonds, climate derivatives, and sustainability-linked loans. These instruments allow investors to hedge risks and finance projects aligned with climate goals, reflecting a growing intersection between financial markets and environmental stewardship. As market participants increasingly price climate risks into asset valuations, companies are incentivized to adopt sustainable practices, creating a feedback loop that links environmental responsibility with financial performance.
6. Global Implications: Unequal Risk Distribution
Climate change impacts are not evenly distributed across countries and markets. Emerging markets often face higher physical and transition risks due to geographic vulnerability, limited infrastructure resilience, and constrained financial resources. For instance, small island nations are highly susceptible to sea-level rise, while arid regions face chronic water scarcity, threatening agricultural output and food security.
Developed economies, while more resilient, are not immune. Extreme weather events, policy shifts, and changing consumer behaviors affect corporate earnings and investment flows globally. The interconnectedness of global supply chains means that climate-induced disruptions in one region can ripple through markets worldwide, creating systemic risks that require coordinated international responses.
7. Strategic Implications for Businesses and Policymakers
For businesses, recognizing climate-related risks is essential for long-term sustainability and competitiveness. Firms must integrate climate scenarios into strategic planning, assess vulnerability across operations, and invest in adaptive technologies. Transparent reporting of climate risks is increasingly mandated by regulators and demanded by investors, further linking corporate performance with climate resilience.
Policymakers play a pivotal role in shaping market outcomes. By setting clear carbon reduction targets, incentivizing sustainable investments, and supporting resilient infrastructure, governments can mitigate financial risks while driving economic transformation. International coordination, such as through climate finance and carbon border adjustment mechanisms, is crucial for reducing systemic risks and supporting markets exposed to climate vulnerabilities.
8. Conclusion: Markets at the Crossroads of Climate Risk
The impact of climate change on markets is complex, pervasive, and accelerating. Physical risks from extreme weather, transition risks from the low-carbon shift, sectoral disparities, investor behavior, and global interconnectedness collectively create a new landscape for financial markets. Market participants must recognize that climate change is not a distant threat—it is a present-day economic reality influencing valuations, investment decisions, and financial stability.
Proactive adaptation, informed risk assessment, and strategic investment in sustainability are no longer optional; they are essential for market resilience. Investors, businesses, and policymakers must collaborate to manage risks, seize opportunities, and navigate a world where climate change is a central determinant of economic outcomes. By doing so, markets can transition from vulnerability to resilience, transforming climate challenges into opportunities for innovation, growth, and sustainable prosperity.
Emerging Market Capital FlowsDrivers, Risks, and the Future of Global Investment
Emerging market capital flows refer to the movement of foreign capital—both equity and debt—into and out of developing economies. These flows play a crucial role in shaping economic growth, financial stability, currency strength, and investment opportunities in emerging markets. Over the past few decades, emerging economies have become increasingly integrated into global financial systems, attracting capital from developed nations seeking higher returns, diversification, and growth potential. However, while capital inflows can accelerate development, sudden reversals can expose vulnerabilities and trigger economic stress. Understanding emerging market capital flows is therefore essential for policymakers, investors, and traders alike.
Nature and Types of Capital Flows
Capital flows into emerging markets generally fall into several categories. Foreign Direct Investment (FDI) involves long-term investments such as setting up factories, acquiring companies, or expanding operations. FDI is considered the most stable form of capital flow because it is driven by long-term economic prospects rather than short-term market movements. Portfolio investments, on the other hand, include investments in stocks, bonds, and other financial instruments. These are more volatile, as they can quickly enter or exit markets in response to changes in interest rates, risk sentiment, or global events. Bank lending and other debt flows also form a significant part of capital movements, particularly in infrastructure and corporate financing.
Each type of flow has different implications. Stable FDI supports job creation, technology transfer, and productivity growth, while volatile portfolio flows can amplify market cycles, strengthening markets during booms and worsening downturns during periods of stress.
Key Drivers of Capital Flows
Several global and domestic factors drive capital flows into emerging markets. One of the most important global drivers is monetary policy in developed economies, especially in the United States. When interest rates in developed markets are low, investors search for higher yields, directing funds toward emerging economies with higher interest rates and growth prospects. Conversely, when developed-market central banks tighten monetary policy, capital often flows back, strengthening developed-market currencies and putting pressure on emerging markets.
Global risk appetite is another critical factor. During periods of optimism, investors are more willing to take risks, leading to increased capital inflows into emerging markets. In contrast, during global crises—such as financial crashes, geopolitical tensions, or pandemics—investors tend to move capital into safer assets, resulting in capital outflows from emerging economies.
Domestic factors also matter greatly. Economic growth prospects, political stability, fiscal discipline, inflation control, and structural reforms all influence investor confidence. Countries that demonstrate credible policymaking, stable governance, and reform-oriented agendas are more likely to attract sustained capital inflows.
Benefits of Capital Inflows
When managed effectively, capital inflows offer significant benefits to emerging markets. They help bridge the savings-investment gap, allowing countries to invest more than they could using domestic savings alone. This supports infrastructure development, industrial expansion, and technological advancement. Capital inflows can also deepen domestic financial markets, improve liquidity, and lower borrowing costs for governments and businesses.
Additionally, foreign investment often brings managerial expertise, global market access, and innovation, especially through FDI. These spillover effects enhance productivity and long-term competitiveness, helping emerging economies move up the value chain.
Risks and Vulnerabilities
Despite their benefits, capital flows also introduce serious risks. One major concern is volatility. Sudden surges of capital can lead to asset price bubbles in equities, real estate, or bonds. If these inflows reverse abruptly—a phenomenon often referred to as “sudden stops”—they can cause sharp currency depreciation, financial instability, and economic contraction.
Emerging markets with high external debt, current account deficits, or weak foreign exchange reserves are particularly vulnerable to capital outflows. Currency depreciation can increase the burden of foreign-currency debt, leading to corporate or sovereign stress. In extreme cases, this can trigger banking crises or balance-of-payments problems.
Another challenge is the policy dilemma faced by central banks. Large capital inflows can lead to currency appreciation, hurting export competitiveness. To manage this, central banks may intervene in currency markets or adjust interest rates, but these actions can have unintended consequences such as inflation or financial distortions.
Role of Policy and Regulation
Effective policy frameworks are essential to managing capital flows. Many emerging markets use a combination of macroeconomic stability, flexible exchange rates, foreign exchange reserves, and macroprudential measures to reduce vulnerabilities. In some cases, governments also employ capital flow management tools, such as taxes on short-term inflows or restrictions on speculative investments, to curb excessive volatility.
Structural reforms—such as improving ease of doing business, strengthening institutions, and enhancing transparency—play a long-term role in attracting stable capital rather than speculative flows. Sound fiscal and monetary policies help build investor confidence and reduce the likelihood of disruptive capital movements.
Recent Trends and Shifting Dynamics
In recent years, emerging market capital flows have become more complex. The rise of passive investing, exchange-traded funds (ETFs), and algorithmic trading has increased the speed and correlation of capital movements. Capital now reacts more quickly to global news, often treating emerging markets as a single asset class rather than distinguishing between individual country fundamentals.
At the same time, geopolitical realignments, supply chain diversification, and technological changes are reshaping investment patterns. Some emerging markets are benefiting from manufacturing relocation and digital economy growth, attracting long-term capital despite global uncertainties.
Future Outlook
Looking ahead, emerging market capital flows are likely to remain volatile but strategically important. As global growth shifts toward developing economies, emerging markets will continue to attract capital seeking higher returns and diversification. However, increased global uncertainty, tighter financial conditions, and geopolitical fragmentation may lead to more selective and cautious investment behavior.
Countries that strengthen economic fundamentals, maintain policy credibility, and adapt to changing global dynamics will be best positioned to attract sustainable capital inflows. For investors, understanding the drivers, risks, and structural differences among emerging markets will be critical to navigating opportunities while managing volatility.
Conclusion
Emerging market capital flows are a powerful force shaping global finance and economic development. They offer immense opportunities for growth, modernization, and integration into the global economy, but also carry risks of volatility and instability. Balancing openness with resilience is the key challenge for emerging economies. As global financial conditions evolve, the ability of emerging markets to manage capital flows effectively will determine not only their economic stability but also their role in the future global financial system.

Global Finance and Central Control1. The Architecture of Global Finance
The modern global financial system is built on several interconnected layers:
a) International Financial Markets
These include:
Foreign exchange (Forex) markets where currencies are traded.
Global bond markets where governments and corporations borrow.
Equity markets where companies raise capital.
Derivatives markets where risk is traded through futures, options, and swaps.
These markets operate almost 24/7 and link every financial center—New York, London, Tokyo, Singapore, Dubai, Frankfurt.
b) Cross-Border Capital Flows
Capital moves across borders in the form of:
Foreign direct investment (FDI)
Portfolio investments in stocks and bonds
Bank lending
Remittances
Trade financing
These flows allow nations to grow, but they also expose countries to global shocks.
c) Financial Institutions
The key pillars include:
Global banks (JPMorgan, HSBC, Citi, Standard Chartered)
Multinational corporations
Pension funds and sovereign wealth funds
Hedge funds and private equity
Central banks and regulatory bodies
Together, these institutions shape how money circulates globally.
2. The Rise of Central Control in Global Finance
Although global finance appears “free-flowing,” it is not without central oversight. Control is exerted in three broad ways:
A. Central Banks: The Nerve Centers of Financial Power
Central banks are the most powerful financial institutions within countries, but their influence spills into global markets.
Key Functions
Set interest rates that influence global borrowing.
Control money supply and liquidity.
Stabilize inflation and currency value.
Act as lenders of last resort during crises.
Global Impact
When the Federal Reserve (US) raises or cuts rates, the effects cascade worldwide:
Global investors shift capital.
Emerging-market currencies rise or fall.
Commodity prices fluctuate.
Debt burdens in dollar-dependent nations increase or ease.
Similarly, the European Central Bank (ECB), Bank of England, and Bank of Japan impact global liquidity and yield curves.
In this sense, global finance is not only shaped by markets but by centralized monetary decisions from a handful of powerful institutions.
B. International Financial Institutions (IFIs)
These include:
International Monetary Fund (IMF)
World Bank
Bank for International Settlements (BIS)
Financial Stability Board (FSB)
Their Role in Central Control
1. The IMF
Provides emergency loans, sets macroeconomic rules, and monitors global financial stability. Countries receiving IMF support must often adopt conditions such as:
Fiscal tightening
Structural reforms
Currency adjustments
This creates a form of policy influence over sovereign nations.
2. The World Bank
Finances development projects and shapes the economic policies of emerging markets through program design and conditional funding.
3. The BIS
Known as the “central bank of central banks,” the BIS sets global banking norms through the Basel accords:
Basel I: Capital requirements
Basel II: Risk management
Basel III: Liquidity and leverage rules
These rules unify how banks operate across the world.
4. Financial Stability Board (FSB)
Coordinates global regulators and sets standards for the world’s largest banks and financial institutions.
C. Regulatory and Political Control
Global finance is also influenced by:
Government fiscal policies
Trade agreements
Sanctions and geopolitical decisions
Financial regulations (AML, KYC, FATF rules)
The Power of Sanctions
The U.S., EU, and UN often use financial sanctions to control, punish, or pressure countries.
Sanctions affect:
Banking access (SWIFT restrictions)
Global payments
Trade receipts
Ability to borrow internationally
This highlights how finance becomes a tool of geopolitical influence.
3. The USD-Centric Financial Order
The U.S. dollar is the anchor of global finance:
60% of global reserves
88% of all FX transactions
50%+ of global trade invoicing
This dominance gives the U.S. unparalleled financial power:
It influences global liquidity via Fed policy.
It controls access to dollar clearing.
It sets global borrowing costs.
It can impose financial sanctions with global impact.
In short, the dollar system is a centralized backbone of global finance.
4. Technology and the Future Centralization of Finance
Digital innovation is transforming financial control.
A. Central Bank Digital Currencies (CBDCs)
Many countries—including China, India, the EU, and the U.S.—are researching or piloting CBDCs.
Implications
Real-time monetary policy tools
Greater surveillance of transactions
More control over taxation and fiscal distribution
Potential reduction in cash usage
Cross-border settlement improvements
CBDCs strengthen central authority and expand the scope of financial oversight.
B. Digital Payments & Fintech Networks
Platforms like:
UPI (India)
PayPal
SWIFT gpi
Visa/Mastercard
RippleNet
Crypto exchanges
These networks process billions of transactions daily. While they make finance efficient, they also consolidate control within digital ecosystems.
C. Cryptocurrencies and Decentralized Finance (DeFi)
Crypto represents the opposite of central control:
No central intermediary
Blockchain-based transparency
Peer-to-peer value transfer
However, regulators are increasing oversight on:
Exchanges
Stablecoins
DeFi protocols
On- and off-ramps
This means even decentralized systems are gradually being integrated back into the centrally regulated financial order.
5. The Tension Between Free Markets and Central Control
Global finance operates under constant tension:
Free Market Forces
Capital flows to high-return markets.
Traders respond to price signals.
Currency values fluctuate.
Central Controls
Interest rate decisions
Capital controls
Sanctions
Regulatory requirements
Monetary interventions
The global system depends on maintaining a balance between these forces.
Too much freedom leads to speculative bubbles and crises.
Too much central control restricts innovation and creates financial rigidity.
6. Crises and the Need for Central Coordination
Major financial crises have shown why central coordination is essential:
1997 Asian Financial Crisis
Massive capital flight destabilized multiple economies.
2008 Global Financial Crisis
The collapse of U.S. mortgage markets triggered global recession.
2020 Pandemic Shock
Central banks injected unprecedented liquidity to prevent collapse.
During crises, free markets alone cannot stabilize the system—central intervention becomes indispensable.
7. The Direction of Global Finance Going Forward
The future will be shaped by three trends:
1. Increasing Centralization
CBDCs
Stronger regulatory norms
Coordinated global oversight
Tighter cross-border monitoring
2. Multipolar Financial Power
Rise of China’s yuan
India’s rapid economic growth
Regional currency arrangements
Asian, Middle Eastern, and African financial alliances
3. Hybrid Financial Models
Mix of centralized control (CBDCs, regulations) and decentralized innovation (blockchain, tokenized assets).
Conclusion
Global finance is a vast, interconnected system shaped by markets, institutions, and powerful central actors. Central banks, the IMF, World Bank, BIS, and regulatory bodies exercise significant control over capital movement, banking standards, and financial stability. At the same time, digital transformation—from CBDCs to fintech—will increase central oversight while creating new tensions with decentralized technologies like crypto.
In essence, global finance is both free-flowing and centrally influenced, a system where market dynamics meet institutional power. Understanding this balance is essential to understanding how the world’s economic engine truly works.
The U.S.–China Trade WarIntroduction
The U.S.–China trade war, one of the most significant economic confrontations in modern history, represents far more than a dispute over tariffs and trade imbalances. It is a geopolitical and economic conflict between the two largest economies in the world—one an established superpower, the United States, and the other, China, an emerging global powerhouse. At its core, the trade war reflects deeper struggles over technology, global influence, intellectual property rights, and the future architecture of the global economy.
Beginning officially in 2018 under the administration of U.S. President Donald Trump, the trade war disrupted global supply chains, affected billions of consumers, and redefined international trade relations. The tariffs imposed by both sides reshaped business decisions, investment patterns, and economic strategies across the globe. Although several rounds of negotiations and partial deals have attempted to ease tensions, the rivalry persists, influencing trade policy, economic planning, and diplomacy even into the mid-2020s.
This essay explores the origins, dynamics, and far-reaching consequences of the U.S.–China trade war. It examines the historical background, economic and political motivations, key developments, global reactions, and long-term implications for international trade and economic order.
1. Background: U.S.–China Economic Relations Before the Trade War
1.1 The Rise of China as a Global Economic Power
Over the past four decades, China’s economic transformation has been nothing short of remarkable. Following economic reforms initiated by Deng Xiaoping in 1978, China transitioned from a centrally planned system to a market-oriented economy. The nation’s entry into the World Trade Organization (WTO) in 2001 marked a turning point, integrating China into the global trading system and allowing it to become the “world’s factory.”
China’s GDP grew at an average of 9–10% annually for decades, lifting hundreds of millions out of poverty. Its exports—ranging from low-cost manufactured goods to high-tech products—flooded global markets. By 2010, China surpassed Japan to become the world’s second-largest economy.
1.2 The U.S.–China Trade Relationship
For decades, the U.S. and China maintained a mutually beneficial, though increasingly unbalanced, trade relationship. The United States became China’s largest export market, while American companies gained access to cheap Chinese manufacturing and labor. However, this relationship created large trade imbalances. By 2017, the U.S. trade deficit with China exceeded $375 billion, the largest bilateral trade deficit in the world.
While American consumers benefited from lower prices, U.S. policymakers and industries grew concerned about lost manufacturing jobs, intellectual property theft, and China’s alleged unfair trade practices. These issues planted the seeds of economic confrontation that would later erupt into a full-scale trade war.
2. Causes of the U.S.–China Trade War
2.1 The Trade Imbalance
A central grievance of the U.S. was the massive trade deficit with China. The Trump administration viewed this imbalance as evidence that trade relations were unfair and that China was manipulating the system to its advantage. While economists argue that trade deficits are not inherently harmful, politically, the deficit symbolized lost jobs and weakened American industries.
2.2 Intellectual Property and Technology Theft
Another major factor was the alleged theft of intellectual property (IP). The U.S. accused China of forcing American companies operating in China to transfer technology as a condition of market access. Reports suggested that Chinese firms benefited from stolen U.S. trade secrets, patents, and software, particularly in advanced sectors like aerospace, semiconductors, and biotechnology.
2.3 “Made in China 2025” Strategy
China’s “Made in China 2025” initiative, launched in 2015, aimed to transform the country into a global leader in advanced manufacturing and high-tech industries such as robotics, AI, and renewable energy. The U.S. perceived this policy as a direct challenge to American technological dominance and economic leadership. Washington feared that China’s state-led industrial policies would tilt global competition unfairly.
2.4 Currency Manipulation Accusations
The U.S. also accused China of artificially devaluing the yuan to make Chinese exports cheaper and imports more expensive, thereby maintaining its export competitiveness. Although this accusation has been debated, it contributed to the perception that China was manipulating market dynamics to gain an advantage.
2.5 Political and Strategic Rivalry
Beyond economics, the trade war was deeply rooted in strategic competition. The U.S. viewed China’s growing influence in Asia, its Belt and Road Initiative, and its military modernization as a challenge to American global dominance. Thus, the trade conflict became a proxy for broader geopolitical rivalry.
3. Timeline of Key Events
3.1 2018: The War Begins
March 2018: The U.S. imposed tariffs on steel (25%) and aluminum (10%) imports, targeting China among other nations.
April 2018: China retaliated with tariffs on $3 billion worth of U.S. goods, including agricultural products.
July 2018: The U.S. imposed 25% tariffs on $34 billion worth of Chinese goods. China responded in kind.
September 2018: The U.S. levied tariffs on $200 billion worth of Chinese imports, prompting further Chinese retaliation.
3.2 2019: Escalation and Negotiations
May 2019: Trade talks broke down, and the U.S. increased tariffs on $200 billion of Chinese goods from 10% to 25%.
August 2019: The U.S. labeled China a “currency manipulator.”
December 2019: Both nations agreed on a “Phase One” trade deal, easing tensions.
3.3 2020: The Phase One Deal
The Phase One Agreement, signed in January 2020, required China to purchase an additional $200 billion in U.S. goods over two years and improve intellectual property protections. However, the COVID-19 pandemic disrupted trade flows, and China failed to meet its purchase commitments.
3.4 2021–2024: Lingering Tensions
Even after President Joe Biden took office, most tariffs remained in place. The administration maintained a tough stance on China, focusing on strategic decoupling, technology restrictions, and alliances with other democratic nations to counter China’s rise. The U.S. CHIPS and Science Act (2022) and export controls on semiconductors further intensified competition.
4. Economic Impact of the Trade War
4.1 Impact on the U.S. Economy
The trade war had mixed effects on the American economy.
Manufacturing and Agriculture: U.S. manufacturers faced higher input costs due to tariffs on Chinese components, while farmers suffered from China’s retaliatory tariffs on soybeans, pork, and corn. The U.S. government provided billions in subsidies to affected farmers.
Consumers: American consumers paid higher prices for goods such as electronics, clothing, and furniture. Studies by the Federal Reserve and academic institutions found that most tariff costs were passed on to U.S. consumers.
Employment: While some domestic industries benefited from tariff protections, others faced uncertainty, layoffs, and reduced investment.
4.2 Impact on the Chinese Economy
China also faced significant challenges:
Export Decline: Chinese exports to the U.S. fell, forcing many manufacturers to seek alternative markets.
Economic Slowdown: China’s GDP growth slowed from over 6% in 2018 to around 5% in 2020.
Currency Fluctuations: The yuan depreciated during the height of the trade war, cushioning export losses but signaling instability.
Policy Response: China implemented fiscal stimulus measures and accelerated domestic innovation to reduce reliance on U.S. technologies.
4.3 Global Impact
The trade war had global ripple effects:
Supply Chains: Many multinational companies diversified production away from China to countries like Vietnam, India, and Mexico.
Commodity Markets: Global demand fluctuations affected prices for oil, metals, and agricultural goods.
Stock Markets: Trade tensions fueled market volatility and investor uncertainty.
Global Growth: The International Monetary Fund (IMF) estimated that the trade war shaved 0.8% off global GDP by 2020.
5. Technological Competition and Decoupling
5.1 The Technology Frontline
Technology became the heart of the trade war. The U.S. targeted Chinese tech giants like Huawei and ZTE, citing national security concerns. Restrictions were imposed on the export of American semiconductors, software, and equipment to Chinese firms. The U.S. also pressured allies to exclude Huawei from 5G networks.
5.2 Semiconductor and AI Race
Semiconductors emerged as the most critical battleground. The U.S. sought to limit China’s access to advanced chips used in artificial intelligence and defense systems. In response, China invested heavily in building its domestic semiconductor capabilities, aiming for technological self-sufficiency.
5.3 Digital Decoupling
The concept of “decoupling”—separating U.S. and Chinese technological ecosystems—gained traction. This shift included restrictions on data sharing, investment screening, and the creation of alternative technology supply chains. While full decoupling remains unlikely, the trend has reshaped the global tech landscape.
6. Political and Strategic Dimensions
6.1 Nationalism and Domestic Politics
In both countries, nationalism played a major role. In the U.S., the trade war was framed as a battle to protect American jobs and sovereignty. In China, the government used the conflict to rally domestic support and promote economic self-reliance under slogans like “dual circulation” and “national rejuvenation.”
6.2 Global Alliances and Power Shifts
The trade war pushed countries to reassess alliances and trade policies. The European Union, Japan, India, and ASEAN nations found themselves balancing relations between the U.S. and China. Many nations benefited from supply chain diversification, attracting new investments as companies sought alternatives to China.
6.3 The New Cold War Narrative
Many analysts have described the trade war as part of a broader “New Cold War”—an ideological, technological, and strategic struggle between democratic capitalism and authoritarian state capitalism. Unlike the U.S.–Soviet Cold War, however, the U.S. and China remain economically intertwined, creating a complex interdependence.
7. Lessons Learned and the Future of Global Trade
7.1 The Limits of Tariffs
The trade war demonstrated that tariffs alone cannot resolve complex structural issues. While they exerted pressure, they also harmed domestic stakeholders and disrupted global commerce. Both economies remained resilient but not without cost.
7.2 The Shift Toward Protectionism
The conflict accelerated a broader global shift toward economic nationalism and protectionism. Countries began to prioritize domestic production, strategic autonomy, and resilience over globalization. The COVID-19 pandemic further reinforced this trend.
7.3 The Redefinition of Global Supply Chains
Multinational corporations began adopting a “China + 1” strategy—maintaining operations in China while expanding production elsewhere. This diversification has benefited emerging economies like Vietnam, India, and Indonesia.
7.4 The Rise of Technological Sovereignty
Both nations are pursuing technological sovereignty—control over critical technologies like semiconductors, 5G, and AI. This race will define future power dynamics more than traditional trade measures.
8. The Way Forward
8.1 Diplomatic Engagement and Cooperation
Despite tensions, cooperation remains essential on global issues like climate change, cybersecurity, and pandemic response. Constructive dialogue and adherence to multilateral institutions such as the WTO can prevent further escalation.
8.2 Economic Rebalancing
Both nations must address the structural causes of imbalance. The U.S. should invest in innovation, education, and industrial competitiveness, while China should open markets, reform state enterprises, and enhance transparency.
8.3 The Role of Multilateralism
Global trade institutions need reform to reflect modern economic realities. A rules-based system that ensures fair competition and technological collaboration is crucial for global stability.
Conclusion
The U.S.–China trade war is more than a dispute over tariffs or trade deficits—it is a defining conflict of the 21st century that encapsulates the struggle for global leadership in economics, technology, and ideology. While both nations suffered short-term losses, the deeper consequence has been a reconfiguration of the global economic order.
The trade war accelerated shifts toward protectionism, technological nationalism, and supply chain diversification. It exposed vulnerabilities in global interdependence and highlighted the need for a balanced approach between competition and cooperation. As both the U.S. and China continue to shape the post-globalization era, the rest of the world watches closely, adapting to the new reality of multipolar economic power.
Ultimately, the future of global prosperity depends not on economic warfare but on how effectively the two giants can coexist—balancing competition with collaboration, and rivalry with responsibility. Only through a stable and fair trade environment can sustainable global growth be achieved in the decades ahead.

better educational, psychological, and moral foundation better educational, psychological, and moral foundation

Challenging Nas100 IdeaWell skills and experience are put are test here
This could still break the downward trendline i have in place there
it could still create a double top successfully create a new lower high then
lower low see breakout entry tell me what


Salesforce looks strongCRM has consolidated for almost 3 weeks, after gapping down on the news it had acquired Slack (WORK).
Risk reward ratio is around 3.
A potential test of the pre-gap candle lows might be in place before attempting to reach the 50sma, and subsequently the top of the gap.
OBV line has tested and is now respecting the line that was made before the gap higher.

Zoom december 13th week chartMy point of view of ZOOM, looking at different trend lines, resistance and support, and the rsi. Also if you think about the fact that the vaccine is only for emergency use for now, makes sense that ZM and other 'work from home' stocks should not dump next week, also we can see numerous lockdowns, for example in Germany, and the US.
Im overall bullish, even tho we might see a 360's to form a double bottom.

ZM to 490? Rise or Fall before Earnings - Cycle AnalysisBig day for ZM today. It faces resistance from the all time high line set since 19 Oct. The line has been a resistance on 28 Oct and 6 Nov after which it dipped massively to retest 370s.
If ZM can break out of the resistance today (mostly likely will need to be with a big gap opening) -- it's bullish until earnings. This is the likely scenario supported with cycle analysis.
If ZM falls below today, we test 350-382 as next resistance until Earnings. ZM may turn after earnings to highs of around 412.
Waiting patiently.
Good luck!

Zoom 8h Chart 11/2 Head & Shoulders May Have Bottomed@cptWORLD Gave some great insight on zoom so I went back to review and adjust accordingly at the the end of the day.
The bears failed today which I wasn't expecting until the last green trendline. This made me adjust my buy zone up slightly to 430-455. However, we need to see tomorrow and over the next few days how price reacts to this trend. Right now we are looking good for a bounce back up.
I've switched from short-term bearish to neutral. I'll be watching this closely as more lockdowns and stay-at-home orders are announced.
NASDAQ:ZM

Slack break out from 3M downward trend rejectedSlack (WORK) has failed to break out from its downward trend that started in June.
Despite my strong bullish long term view on Slack the outlook for the next few weeks remains not very positiv - support levels at 28.60 / 27.30 / 23.60 could be seen as entry points to accumulate.

WORK - Just Buy40+ in early 2021, if not sooner. Will depend on market conditions of course, but the demand for efficient and optimized at home working platforms will only increase as more companies shift to at-home employment. Benefits have already been realized, no turning back now no matter how hard anyone fights it. Slack is positioned well to be a leader in such an environment. Easy buy. Technicals point up as well, above 32.5 and we will test the supply zone above around 36-40.
