Forex Trading Options: Opportunities in the Global Market Understanding Forex Trading Options
A forex option is a derivative contract based on an underlying currency pair, such as EUR/USD, GBP/INR, or USD/JPY. The contract gives the buyer the right to either buy (call option) or sell (put option) the currency pair at a specific exchange rate, known as the strike price, on or before the expiration date. To acquire this right, the buyer pays a premium to the option seller (writer).
There are two primary types of forex options:
Call Options – Give the holder the right to buy a currency pair at the strike price.
Put Options – Give the holder the right to sell a currency pair at the strike price.
If market conditions move favorably, the option holder can exercise the option or sell it for profit. If not, the trader’s loss is limited to the premium paid, making options inherently risk-defined instruments.
Types of Forex Options
Forex options are broadly categorized into two structures:
1. Vanilla Options
These are standard options with fixed strike prices and expiration dates. They are widely used by institutional traders, corporates, and advanced retail traders for hedging and directional strategies.
2. Exotic Options
Exotic options include more complex structures such as barrier options, digital options, range options, and Asian options. Their payoff depends on specific conditions like price levels being touched or averages being reached. While they offer customization and lower premiums in some cases, they also carry higher complexity and risk.
How Forex Options Work
Forex options trading involves several key components:
Underlying Currency Pair: The base and quote currencies.
Strike Price: The price at which the option can be exercised.
Expiration Date: The date when the option expires.
Premium: The cost of purchasing the option.
Lot Size: The contract size, which varies by broker or exchange.
Options can be European-style (exercised only at expiration) or American-style (exercised anytime before expiration). Most over-the-counter (OTC) forex options are European-style, while exchange-traded options may offer more flexibility.
Advantages of Forex Trading Options
One of the biggest advantages of forex options is limited risk. Unlike spot forex trading, where losses can theoretically be unlimited if not managed properly, option buyers know their maximum loss upfront—the premium paid.
Other major benefits include:
Hedging Capability: Importers, exporters, and investors use forex options to protect against adverse currency movements.
Strategic Flexibility: Traders can profit in bullish, bearish, or sideways markets using different option strategies.
Leverage without Margin Calls: Options offer exposure without the same margin pressure as spot forex.
Volatility Trading: Traders can profit from changes in volatility, not just price direction.
Forex Options Trading Strategies
Forex options allow for a wide range of strategies depending on market outlook:
Long Call / Long Put: Simple directional bets on currency appreciation or depreciation.
Straddle: Buying both a call and a put to profit from high volatility.
Strangle: Similar to a straddle but with different strike prices to reduce premium cost.
Covered Call: Used by currency holders to generate income.
Protective Put: Acts as insurance against unfavorable currency moves.
Advanced traders may also employ spreads, combinations, and multi-leg strategies to fine-tune risk and reward.
Role of Volatility in Forex Options
Volatility is a critical factor in options pricing. Implied volatility reflects market expectations of future price fluctuations. When volatility rises, option premiums increase; when it falls, premiums decrease. Successful forex options traders closely monitor economic events, central bank decisions, geopolitical developments, and macroeconomic data, as these factors significantly influence volatility.
Forex Options vs Spot Forex Trading
While spot forex trading focuses on immediate buying and selling of currencies, forex options provide strategic depth. Spot trading often requires strict stop-loss management, whereas options embed risk control by design. However, options require a deeper understanding of pricing models, time decay, and volatility, making them more suitable for intermediate to advanced traders.
Risks and Limitations
Despite their advantages, forex options are not risk-free. Key risks include:
Time Decay (Theta): Options lose value as expiration approaches.
Complex Pricing: Factors like volatility and interest rate differentials affect premiums.
Liquidity Constraints: Some currency pairs or exotic options may have lower liquidity.
Seller Risk: Option writers face potentially large losses if not properly hedged.
Proper education, disciplined strategy selection, and risk management are essential to mitigate these risks.
Conclusion
Forex trading options are a powerful financial instrument that bridges risk management and speculative opportunity in the global currency market. They provide traders and businesses with flexibility, defined risk, and strategic tools to navigate currency fluctuations effectively. While they demand a higher level of knowledge compared to spot forex trading, the benefits of limited downside risk, hedging efficiency, and multi-dimensional strategy potential make forex options an invaluable component of modern forex trading.
For traders willing to invest time in learning their mechanics and strategies, forex options can transform how currency market opportunities are approached—shifting the focus from mere price movement to probability, volatility, and strategic positioning.
Wormhole

Dark Pools Exposed: The Hidden Side of Modern Financial MarketsOrigins and Purpose of Dark Pools
Dark pools emerged in the late 20th century as a response to a genuine market problem. Large institutional investors—such as mutual funds, pension funds, and insurance companies—often need to buy or sell millions of shares at a time. Executing such large orders on public exchanges can significantly move prices against them, a phenomenon known as market impact. For example, if the market sees a massive buy order, prices may rise before the order is fully executed, increasing costs for the buyer.
Dark pools were designed to solve this issue by allowing institutions to match large orders anonymously, minimizing price disruption and reducing transaction costs. In theory, this benefits the market by enabling smoother execution of large trades without unnecessary volatility.
How Dark Pools Actually Work
In practice, dark pools match buyers and sellers internally, often using prices derived from public exchanges (known as the “midpoint” of the best bid and offer). Trades are reported to the public tape only after execution, meaning the market learns about the transaction after the fact, not while it is happening.
There are different types of dark pools. Some are operated by large investment banks, others by independent firms, and some are run by exchanges themselves as off-exchange venues. Each type has its own rules regarding who can participate, how orders are matched, and what level of information is disclosed.
The Exposure: Why Dark Pools Are Under Scrutiny
“Dark pools exposed” reflects the increasing concern that these venues may no longer serve only their original purpose. Over time, dark pools have grown dramatically in size and influence. In some major markets, a significant percentage of daily trading volume now occurs off-exchange. This shift has raised several red flags.
One major issue is transparency. Because orders are hidden, the public market may not reflect the true supply and demand for a stock. This can distort price discovery, which is the process by which markets determine the fair value of securities. When too much trading happens in the dark, prices on public exchanges may become less reliable.
Another concern is fairness. Retail investors typically trade on lit exchanges, where they can see prices and volumes. Institutional players, on the other hand, often have access to dark pools, advanced algorithms, and preferential routing. This creates a two-tiered market, where sophisticated participants operate with more information and better execution options than everyday investors.
Dark Pools and High-Frequency Trading
One of the most controversial aspects of dark pools is their interaction with high-frequency trading (HFT). While dark pools were originally intended for long-term institutional investors, some have allowed HFT firms to participate. Critics argue that this undermines the very purpose of dark pools.
High-frequency traders use speed and algorithms to detect patterns, exploit tiny price differences, and react in microseconds. In some cases, HFT firms can infer the presence of large institutional orders in dark pools and trade ahead of them on public exchanges, a practice often referred to as “predatory trading.” This has led to accusations that certain dark pools effectively enable front-running, even if indirectly.
Regulatory Response and Investigations
As dark pools have grown, regulators around the world have begun to “expose” their inner workings through investigations, fines, and new rules. In the United States, the Securities and Exchange Commission (SEC) has fined several banks for misleading clients about how their dark pools operated, particularly regarding the presence of high-frequency traders. These cases revealed that some dark pools were not as neutral or protective as advertised.
In Europe, regulations such as MiFID II introduced caps on dark pool trading volumes and stricter reporting requirements. The goal was to push more trading back onto transparent, regulated exchanges and restore confidence in price discovery. Other markets, including India, have taken a more cautious approach, limiting or tightly regulating off-exchange trading to prevent excessive opacity.
Impact on Market Volatility and Stability
Another dimension of dark pools exposed is their impact on market stability. During periods of market stress, liquidity in dark pools can evaporate quickly, as participants withdraw to avoid risk. This can exacerbate volatility on public exchanges, where remaining orders may be thinner and more reactive.
Because dark pools rely on public markets for price references, any disruption in lit exchanges can ripple through the dark ecosystem. This interconnectedness means that while dark pools may seem separate, they are deeply embedded in the broader financial system.
Are Dark Pools Always Bad?
Despite the criticism, it is important to recognize that dark pools are not inherently malicious. When properly regulated and transparently operated, they can provide genuine benefits. Large institutions can execute trades efficiently, reducing costs that might otherwise be passed on to pensioners, mutual fund investors, and policyholders.
The problem arises when dark pools grow too large, operate with insufficient oversight, or prioritize profit over fairness. Lack of clear disclosure, conflicts of interest (especially in bank-owned pools), and unequal access can turn a useful market tool into a source of systemic risk and mistrust.
The Future: Toward Greater Transparency
The exposure of dark pools has sparked an ongoing debate about the future structure of financial markets. Some argue for stricter limits or even the elimination of dark pools, pushing all trading onto transparent exchanges. Others advocate for smarter regulation—enhancing disclosure, enforcing fair access rules, and ensuring that dark pools genuinely serve their stated purpose.
Technological advances, such as blockchain-based trading systems and real-time reporting tools, may also play a role in bridging the gap between efficiency and transparency. The challenge for regulators and market participants alike is to balance the need for liquidity and low trading costs with the fundamental principles of fairness and open price discovery.
Conclusion
“Dark Pools Exposed” is not just a phrase; it represents a broader reckoning within modern finance. As hidden trading venues continue to shape market outcomes, understanding their mechanics, benefits, and risks becomes essential for investors, regulators, and policymakers. Dark pools began as a solution to a real problem, but their evolution has raised critical questions about transparency, equality, and trust in financial markets. Exposing how they work—and where they can go wrong—is a crucial step toward building markets that are not only efficient, but also fair and resilient.

Understanding the Forces Shaping Worldwide Economies1. Economic Drivers of Market Movements
At the core of global market fluctuations are economic indicators that provide insights into growth, inflation, and employment. Gross Domestic Product (GDP) growth rates, unemployment figures, and consumer spending patterns all influence investor confidence. For instance, when major economies like the United States, China, or the European Union show slower growth, global markets often react negatively, fearing reduced demand for goods and services worldwide. Conversely, strong economic performance in leading nations can boost market sentiment and fuel investment across sectors.
Monetary policies also play a crucial role. Central banks, such as the Federal Reserve or the European Central Bank, control interest rates and money supply. A rate hike to curb inflation can reduce liquidity in markets, affecting stock and bond prices globally. Similarly, quantitative easing or stimulus measures can inject capital into financial systems, boosting asset prices. Exchange rates and currency stability further affect international trade and investments, especially for emerging markets that depend heavily on foreign capital flows.
2. Geopolitical Events and Market Volatility
Global markets are extremely sensitive to geopolitical tensions, including conflicts, sanctions, and trade wars. For example, tensions between major powers can disrupt supply chains, increase commodity prices, and reduce investor confidence. Trade disputes, such as tariffs imposed between countries, directly affect multinational corporations, altering profit expectations and causing stock market fluctuations. Political instability in key regions, such as the Middle East or parts of Africa, can impact oil prices and global energy markets, influencing inflation and production costs worldwide.
Natural disasters and environmental issues are increasingly significant in affecting markets. Hurricanes, floods, or wildfires disrupt production and logistics, affecting commodity supply chains. Climate change concerns drive investment shifts toward sustainable technologies, reshaping global market priorities and creating winners and losers in different sectors.
3. Technological Disruption and Market Adaptation
Technology has transformed global markets, accelerating the pace at which information is disseminated and trades are executed. Innovations in artificial intelligence, blockchain, and financial technologies (FinTech) have created new investment opportunities while also introducing risks. Rapid changes in technology can disrupt traditional industries; for example, renewable energy innovations impact the fossil fuel sector, while automation reshapes manufacturing labor dynamics. Investors react quickly to these shifts, often leading to volatility in global stock exchanges.
Additionally, digital trading platforms and algorithmic trading amplify the speed and scale of market reactions. News spreads globally in seconds, influencing investor behavior and triggering rapid market movements. While these technological advancements increase market efficiency, they also create susceptibility to sudden corrections and speculative bubbles.
4. Globalization and Interconnectedness
One of the defining features of modern markets is globalization. No country’s market operates in isolation. Financial integration means that an economic shock in one nation can have cascading effects worldwide. The 2008 global financial crisis is a prime example: the collapse of the U.S. housing market and financial institutions triggered recessions in Europe, Asia, and beyond. Similarly, a slowdown in China, the world’s manufacturing hub, can affect commodity prices, supply chains, and corporate earnings globally.
Trade networks, investment flows, and multinational corporations link countries economically, while global indices and mutual funds spread exposure across continents. This interconnectedness allows for diversification but also means that systemic risks can propagate quickly.
5. Market Sentiment and Investor Psychology
Investor psychology significantly impacts global markets. Fear, uncertainty, and speculation can lead to sudden sell-offs or bubbles. Market sentiment often amplifies the effect of fundamental events. For instance, even minor geopolitical news can trigger sharp declines if investors perceive risk, while positive economic announcements can fuel rallies. Behavioral finance highlights that emotions, herd behavior, and perception of risk often override rational decision-making, causing markets to react disproportionately.
Media coverage, social networks, and financial news outlets shape market sentiment globally. The instantaneous spread of information allows sentiment to influence international markets simultaneously, creating synchronized movements across regions.
6. Emerging Markets and Their Vulnerability
Emerging markets are particularly vulnerable to global market fluctuations. These economies often rely on exports, foreign investments, and commodity revenues. Changes in global demand, interest rates in developed nations, or capital outflows can destabilize emerging markets’ currencies, stock exchanges, and debt markets. While emerging markets offer high growth potential, they are highly sensitive to global volatility, highlighting the asymmetric impact of global market shocks.
7. The Role of Commodities and Energy Markets
Commodities—oil, metals, agricultural products—are highly sensitive to global market trends. Price fluctuations in these markets affect inflation, corporate costs, and trade balances. Energy markets, particularly oil and gas, are closely tied to geopolitical developments. A disruption in supply due to political conflicts or natural disasters can lead to global price spikes, affecting industries and consumers worldwide. Similarly, agricultural market disruptions can lead to food inflation and social unrest in dependent regions.
8. Strategies for Navigating Global Market Uncertainty
Investors, corporations, and governments employ several strategies to mitigate the impact of market fluctuations. Diversification across regions, sectors, and asset classes reduces exposure to localized shocks. Hedging through derivatives, such as options and futures, allows market participants to manage risk. Central banks and regulatory authorities also intervene with policies to stabilize financial systems during crises.
For businesses, understanding global supply chains, geopolitical risks, and currency exposure is critical. Long-term planning involves scenario analysis, stress testing, and adapting business models to changing global dynamics. Individual investors increasingly focus on sustainable and resilient investments, considering environmental, social, and governance (ESG) factors, which have shown relative stability during turbulent periods.
Conclusion
Global markets are inherently interconnected and influenced by a broad spectrum of economic, political, technological, and environmental factors. Their behavior reflects both tangible indicators, like GDP growth or commodity prices, and intangible forces, such as investor sentiment and geopolitical uncertainty. Understanding these influences is essential for investors, policymakers, and businesses to navigate risks and capitalize on opportunities.
The impact of global market fluctuations extends far beyond stock prices—it affects employment, production, trade, and the overall well-being of societies. As markets become increasingly complex and technology-driven, participants must remain vigilant, adaptable, and informed. Awareness of the intricate forces shaping global markets enables smarter decisions, resilience in the face of volatility, and a proactive approach to both challenges and opportunities in the world economy.

WUSD - Wormhole | Leading Interoperability Platform | BlackRockHi
Wormhole has 2B+ in TVL and leads bridging and crosschains transactions for BlackRock and some other big institutions.
This is not a trading advice.
Thanks
Gex

Global Finance and Central Control1. The Architecture of Global Finance
The modern global financial system is built on several interconnected layers:
a) International Financial Markets
These include:
Foreign exchange (Forex) markets where currencies are traded.
Global bond markets where governments and corporations borrow.
Equity markets where companies raise capital.
Derivatives markets where risk is traded through futures, options, and swaps.
These markets operate almost 24/7 and link every financial center—New York, London, Tokyo, Singapore, Dubai, Frankfurt.
b) Cross-Border Capital Flows
Capital moves across borders in the form of:
Foreign direct investment (FDI)
Portfolio investments in stocks and bonds
Bank lending
Remittances
Trade financing
These flows allow nations to grow, but they also expose countries to global shocks.
c) Financial Institutions
The key pillars include:
Global banks (JPMorgan, HSBC, Citi, Standard Chartered)
Multinational corporations
Pension funds and sovereign wealth funds
Hedge funds and private equity
Central banks and regulatory bodies
Together, these institutions shape how money circulates globally.
2. The Rise of Central Control in Global Finance
Although global finance appears “free-flowing,” it is not without central oversight. Control is exerted in three broad ways:
A. Central Banks: The Nerve Centers of Financial Power
Central banks are the most powerful financial institutions within countries, but their influence spills into global markets.
Key Functions
Set interest rates that influence global borrowing.
Control money supply and liquidity.
Stabilize inflation and currency value.
Act as lenders of last resort during crises.
Global Impact
When the Federal Reserve (US) raises or cuts rates, the effects cascade worldwide:
Global investors shift capital.
Emerging-market currencies rise or fall.
Commodity prices fluctuate.
Debt burdens in dollar-dependent nations increase or ease.
Similarly, the European Central Bank (ECB), Bank of England, and Bank of Japan impact global liquidity and yield curves.
In this sense, global finance is not only shaped by markets but by centralized monetary decisions from a handful of powerful institutions.
B. International Financial Institutions (IFIs)
These include:
International Monetary Fund (IMF)
World Bank
Bank for International Settlements (BIS)
Financial Stability Board (FSB)
Their Role in Central Control
1. The IMF
Provides emergency loans, sets macroeconomic rules, and monitors global financial stability. Countries receiving IMF support must often adopt conditions such as:
Fiscal tightening
Structural reforms
Currency adjustments
This creates a form of policy influence over sovereign nations.
2. The World Bank
Finances development projects and shapes the economic policies of emerging markets through program design and conditional funding.
3. The BIS
Known as the “central bank of central banks,” the BIS sets global banking norms through the Basel accords:
Basel I: Capital requirements
Basel II: Risk management
Basel III: Liquidity and leverage rules
These rules unify how banks operate across the world.
4. Financial Stability Board (FSB)
Coordinates global regulators and sets standards for the world’s largest banks and financial institutions.
C. Regulatory and Political Control
Global finance is also influenced by:
Government fiscal policies
Trade agreements
Sanctions and geopolitical decisions
Financial regulations (AML, KYC, FATF rules)
The Power of Sanctions
The U.S., EU, and UN often use financial sanctions to control, punish, or pressure countries.
Sanctions affect:
Banking access (SWIFT restrictions)
Global payments
Trade receipts
Ability to borrow internationally
This highlights how finance becomes a tool of geopolitical influence.
3. The USD-Centric Financial Order
The U.S. dollar is the anchor of global finance:
60% of global reserves
88% of all FX transactions
50%+ of global trade invoicing
This dominance gives the U.S. unparalleled financial power:
It influences global liquidity via Fed policy.
It controls access to dollar clearing.
It sets global borrowing costs.
It can impose financial sanctions with global impact.
In short, the dollar system is a centralized backbone of global finance.
4. Technology and the Future Centralization of Finance
Digital innovation is transforming financial control.
A. Central Bank Digital Currencies (CBDCs)
Many countries—including China, India, the EU, and the U.S.—are researching or piloting CBDCs.
Implications
Real-time monetary policy tools
Greater surveillance of transactions
More control over taxation and fiscal distribution
Potential reduction in cash usage
Cross-border settlement improvements
CBDCs strengthen central authority and expand the scope of financial oversight.
B. Digital Payments & Fintech Networks
Platforms like:
UPI (India)
PayPal
SWIFT gpi
Visa/Mastercard
RippleNet
Crypto exchanges
These networks process billions of transactions daily. While they make finance efficient, they also consolidate control within digital ecosystems.
C. Cryptocurrencies and Decentralized Finance (DeFi)
Crypto represents the opposite of central control:
No central intermediary
Blockchain-based transparency
Peer-to-peer value transfer
However, regulators are increasing oversight on:
Exchanges
Stablecoins
DeFi protocols
On- and off-ramps
This means even decentralized systems are gradually being integrated back into the centrally regulated financial order.
5. The Tension Between Free Markets and Central Control
Global finance operates under constant tension:
Free Market Forces
Capital flows to high-return markets.
Traders respond to price signals.
Currency values fluctuate.
Central Controls
Interest rate decisions
Capital controls
Sanctions
Regulatory requirements
Monetary interventions
The global system depends on maintaining a balance between these forces.
Too much freedom leads to speculative bubbles and crises.
Too much central control restricts innovation and creates financial rigidity.
6. Crises and the Need for Central Coordination
Major financial crises have shown why central coordination is essential:
1997 Asian Financial Crisis
Massive capital flight destabilized multiple economies.
2008 Global Financial Crisis
The collapse of U.S. mortgage markets triggered global recession.
2020 Pandemic Shock
Central banks injected unprecedented liquidity to prevent collapse.
During crises, free markets alone cannot stabilize the system—central intervention becomes indispensable.
7. The Direction of Global Finance Going Forward
The future will be shaped by three trends:
1. Increasing Centralization
CBDCs
Stronger regulatory norms
Coordinated global oversight
Tighter cross-border monitoring
2. Multipolar Financial Power
Rise of China’s yuan
India’s rapid economic growth
Regional currency arrangements
Asian, Middle Eastern, and African financial alliances
3. Hybrid Financial Models
Mix of centralized control (CBDCs, regulations) and decentralized innovation (blockchain, tokenized assets).
Conclusion
Global finance is a vast, interconnected system shaped by markets, institutions, and powerful central actors. Central banks, the IMF, World Bank, BIS, and regulatory bodies exercise significant control over capital movement, banking standards, and financial stability. At the same time, digital transformation—from CBDCs to fintech—will increase central oversight while creating new tensions with decentralized technologies like crypto.
In essence, global finance is both free-flowing and centrally influenced, a system where market dynamics meet institutional power. Understanding this balance is essential to understanding how the world’s economic engine truly works.
WORMHOLE W/USD - 1DAY - 1 WEEK TFOn the chart, we can see two channels : one reflects the reaction to previous movement and the other shows the potential current setup.
Inside of each channel, there is a zone of uncertainty (marked with dashed lines) — within this range the price may shake out weak hands and accumulate positions.
After a breakout and confident candle close above this zone, we can expect a strong upward move.
The key point is to wait for a candle body to close above the zone boundary to confirm the impulse.
Additionally, the price is still moving within a global descending channel.
To reach higher targets it’s crucial for the market to break out and hold above the upper boundary of this long-term downtrend channel.

Wormhole to da moonWormhole did not just accumulate for 180 days to pump and dump around this zone. Q1 is going to be awesome for W accumulations.
First two targets are very conservative, will be playing step by step.
Box zone determines bullishness
Wormhole is going to be one of the coins to talk during 2025.
Merry Christmas!

W Secondary. Reversed Head and Shoulders Key Area. 18 09 25Logarithm. 3 days.
Main trend 23 03 2025
A breakout of the previously mentioned key resistance (pair to USD) occurs on huge buying volume and an exit from the sideways trend (inverse head and shoulders).
Local targets, in case the inverse head and shoulders pattern is realized and a bowl forms at the next resistance level (previous consolidation).

Inverted Head & Shoulders · Wormhole TokenI added the little pattern to the picture. Keep in mind that this is a weekly chart. So the pattern looks small but it actually covers a long period of time because of each candle contains 7 days of price action. Weekly.
Head and shoulders. That's the pattern. In this case inverted because the standard pattern is a bearish reversal signal. It tends to show up at the top of a trend. You get the left shoulder (a high/peak) followed by the head (a higher high), then the right shoulder (lower high) and you have your reversal pattern. When the neckline of the pattern breaks comes the crash.
When the patterns shows up at the end of a downtrend it becomes the "inverted head and shoulders (iH&S)" as a bullish reversal signal.
In this chart each point has really high volume. How interesting. And this week is producing the highest volume ever and it is buying and it is green. This is all happening at the bottom.
The left shoulder produced high volume in March/April. Then the head has really high volume in June, and the right shoulder has the highest volume ever now, late August 2025.
The bottom is in now for more than two months. The bottom range has been active for more than five months.
Wormhole Token already hit bottom.
WUSDT is preparing for a massive bullish run. This trading pair can grow for years, the same for many others. Just like many projects did between 2023 and 2024. Remember, the market is big now. Just because one project peaks doesn't mean the entire market is in the same place. They will all peak, but it takes time.
Years of higher highs and higher lows. Your position is safe.
Trust the Master.
Namaste.

WUSDT Bullish Reversal Confirmed?BINANCE:WUSDT has been moving within a descending channel since the start of the year, forming lower highs and lower lows. Recently, the price broke out of the channel resistance, showing strength with increased buying volume. This breakout suggests that bearish momentum is weakening, and a potential bullish reversal could be underway.
Stop loss : $0.070
Target: 100%-250%
Cheers
Hexa

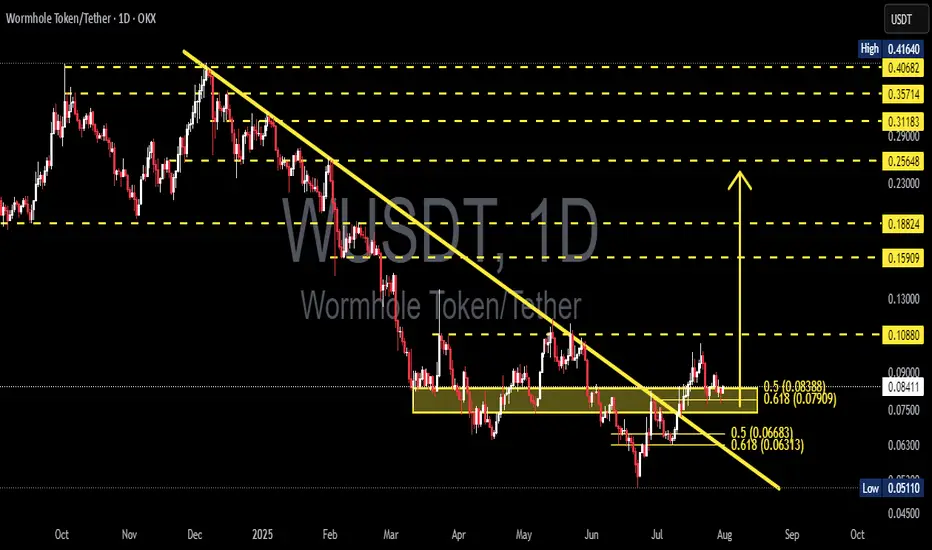
WUSDT Major Downtrend Break! Now Testing the Golden Pocket!🧩 Overview:
Wormhole Token (WUSDT) has finally broken out of a long-standing downtrend line that has been pressing the price down since February 2025. This breakout is a significant technical development and now the price is undergoing a critical retest phase — a moment that could mark the beginning of a major bullish reversal.
Price is currently consolidating around the Fibonacci 0.5–0.618 retracement zone (0.079–0.084), commonly known as the "Golden Pocket Zone" — a popular area for smart money accumulation.
---
🧠 Pattern & Structure:
📉 A long-term descending trendline was decisively broken, signaling a potential shift in market sentiment.
📦 A consolidation range is forming within a yellow support box — between 0.07909 and 0.08388, a prior resistance zone that is now being retested as support.
🔁 This is a classic breakout-retest structure, often seen before major price expansions.
---
🟢 Bullish Scenario (Reversal Potential):
If the price holds above the 0.079–0.084 support range, it sets the stage for a potential bullish continuation. Key upside targets include:
🔹 0.10880 – Previous distribution zone.
🔹 0.13000 – Psychological and structural resistance.
🔹 0.15909 – March resistance.
🔹 0.18824 – Measured move target from breakout.
🔹 0.23000–0.29000 – Expansion zone if momentum sustains.
A strong bullish candle closing above 0.09000 with increasing volume would strengthen this outlook.
---
🔴 Bearish Scenario (Failed Retest):
If the Golden Pocket fails to hold:
Price may retrace to lower supports:
🔻 0.07500 – Minor support zone.
🔻 0.06300 – Key support from June.
🔻 0.05110 – Yearly low and last line of defense. A breakdown below this level would revalidate the bearish trend.
Traders should be cautious if daily closes fall below the yellow zone with high selling volume.
---
💡 Conclusion & Strategy:
WUSDT is currently at a critical technical juncture. A confirmed breakout has occurred, but the retest phase is what will validate the strength of this move.
🎯 Swing traders may look for entries within the 0.079–0.084 range with invalidation below 0.075.
📉 Short-sellers might wait for a confirmed breakdown below this support with volume confirmation.
Momentum is building — the next move could define the mid-term trend.
---
📊 Chart Highlights:
✅ Downtrend Breakout: Confirmed
✅ Retesting Key Fibonacci Zone (0.5–0.618)
✅ Former Resistance → Becoming Support
🚨 Crucial Bullish-Bearish Decision Zone
#WUSDT #WUSDTAnalysis #WormholeToken #CryptoBreakout #GoldenPocket #PriceAction #FibonacciLevels #AltcoinReversal #TechnicalAnalysis
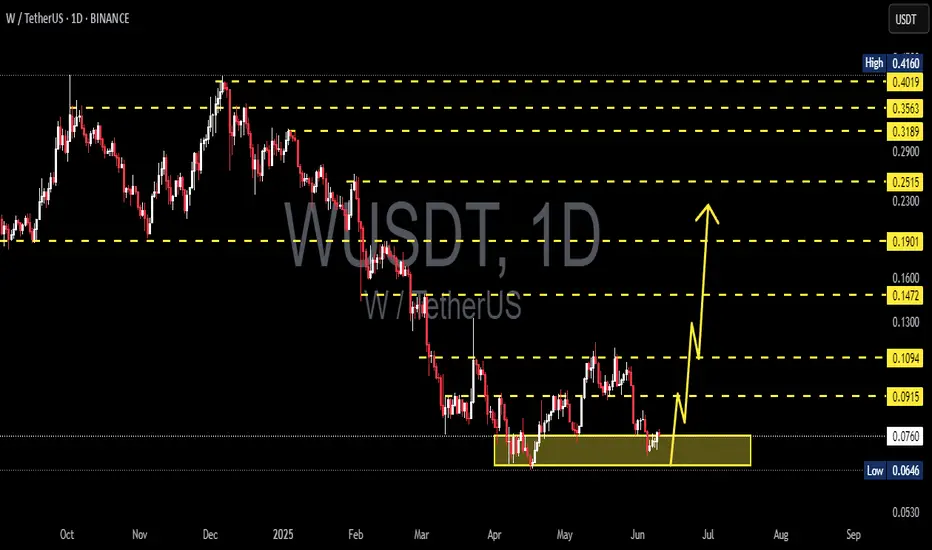
W/USDT Breaks Downtrend! Is This the Start of a Bullish Reversal🔍 Pattern and Chart Structure:
Timeframe: 1D (Daily)
Pattern: Breakout from a Descending Trendline that has been intact since late 2024.
Support and Resistance Levels:
Closest support: $0.0744
Key resistances: $0.0915 – $0.1087 – $0.1446 – $0.1852 – $0.2528 – $0.3197 – $0.4017
Volume & Momentum: The chart shows a price breakout above the descending trendline, likely accompanied by increased buying volume (volume confirmation is important).
🚀 Bullish Scenario:
If the price holds above the broken trendline:
A confirmed breakout occurs if the daily candle closes above $0.0744 and pushes toward $0.0915 and beyond.
Gradual target levels:
1. $0.0915 → $0.1087
2. $0.1087 → $0.1446
3. $0.1446 → $0.1852 (strong psychological resistance)
4. With strong bullish momentum, potential rally towards $0.25 – $0.40 range
📌 Note: If the price forms a higher low after the breakout, it further confirms a trend reversal.
🔻 Bearish Scenario:
If this breakout turns out to be a false breakout:
Price fails to hold above $0.0744
Drops back down to the support range around $0.0630 → $0.0500
If the price breaks below $0.0500, a further decline toward historical support at $0.0450 is possible
📌 A bearish confirmation would come from a daily candle closing back below the trendline with increased selling volume.
🧩 Conclusion:
Currently, W/USDT shows signs of a possible reversal after breaking the major long-term downtrend.
Breakout validation requires volume confirmation and strong follow-through.
The potential upside is attractive, but caution is advised in case of a false breakout.
#WUSDT #CryptoBreakout #AltcoinAnalysis #BullishReversal #TechnicalAnalysis #CryptoTrading #DescendingTrendline #BreakoutAlert #AltcoinSeason #SupportResistance

Wormhole Token Recovers From Bottom & Activates 2,400% PotentialTrue bottom and true recovery. We have a great situation here, this is a pair that has more than 2,400% potential for growth. The chart looks great right now, the signals are strong and confirmed.
Good afternoon my fellow Cryptocurrency trader, I hope you are having a nice Saturday. Let's consider this chart, a great opportunity for sure.
Wormhole Token (WUSDT) entered bottom zone 11-March, so already 111 days trading at bottom prices. The best time to buy.
After this initial low in March we have huge volume after a few days, and just two days ago another strong buyers day with a followup composed of two bullish signals. The DragonFly Doji yesterday and the full green candle today.
These are all strong bullish signals fully confirmed, which means higher prices next. I am showing only the daily chart but the potential for growth is extraordinary when focused on the long-term. This publication is time-based.
Right now we have great entry timing and prices...
The time is right, the time is ripe.
Another great altcoin for those looking to profit massively from the 2025 bull market.
Thank you for reading.
Namaste.

WUSDT 1D Analysis W ~ 1D Analysis
#W Buy back gradually from here if you still have confidence in this coin with a short term target of at least 15%+
W / USDT Main trend. 23 03 2025Logarithm. Time frame 3 days. Descending channel, price in local clamping in consolidation at dynamic support of the internal channel. From listing -94% at the moment.
Local percentages, medium-term and long-term to key zones of chart logic and liquidity, are shown on the chart as a guide for building your tactics and risk control.
🔴 There is potential for a decline to external support of a large descending channel (optional). I showed this option for building tactics and money management. Such assets in terms of liquidity, as a rule, decrease by 96-98%
🟢 If, from this price clamp, the price goes up , then the first resistance is the dynamic resistance of the internal channel (from which there may be a local reversal). Then the external (similarly). If the trend breaks and exits the descending channel, then strong resistance is the previous consolidation of 0.24-0.36
Locally, this clamping zone looks like this.

Trading opportunity for WUSDTBased on technical factors there is a Buy position in :
📊 WUSDT
🔵 Buy Now or Buy Stop by 0.89
🪫Stop loss 0.0740
🔋Target 0.1240
📏 R/R 4,2
💸RISK : 1%
We hope it is profitable for you ❤️
Please support our activity with your likes👍 and comments📝

Wormhole (W): Is the Correction Over? Targeting $0.1700 and $0.2Greetings, fellow traders!
Following a significant rally that reached the $0.1300 resistance zone, Wormhole (W) is currently undergoing a corrective phase. This retracement is finding support near the key 0.50 and 0.618 Fibonacci levels, a common area for price consolidation before a potential trend continuation.
Anticipated Price Action:
Based on the current technical structure, a resumption of the upward trend towards the $0.1700 and $0.2000 resistance levels is anticipated. The timeframe for this projected move is estimated to be within the next 24 hours. However, this is a projection, and market conditions can change rapidly.
Trading Considerations:
Cautious Entry: While a continuation of the uptrend is likely, traders should exercise caution when initiating long positions. Confirmation of bullish momentum, such as a strong bullish candlestick pattern or a break above a short-term resistance level, is recommended before entry. Entering during a retracement carries increased risk.
Fibonacci Support: Monitor price action closely around the 0.50 and 0.618 Fibonacci levels. These levels may act as potential support and provide opportunities for entry, if accompanied by bullish confirmation signals.
Timeframe: Keep the projected 24-hour timeframe in mind, but remain adaptable to changing market dynamics.
Disclaimer:
This analysis is for informational purposes only and should not be considered financial advice. All trading decisions should be made after conducting thorough independent research, including a comprehensive risk assessment. Market conditions can be volatile, and past performance is not indicative of future results.

W - Memecoin With 15-30x Potential!Hello, Skyrexians!
In the era of memecoins when everyone is talking about PEPE, DOGE and HMSTR we have the quite meme BINANCE:WUSDT which is now at the very low prices with the almost clear Elliott waves structure.
Let's take a look at the weekly chart. The listing pump as usual we can count as the wave 1, after that we can see the wave 2 represented as a zigzag ABC. There are not so many candles on the chart, so using other indicators can't be so efficient. You shall understand that this coin is high risk, I personally have only 2% of deposit in this coin, but it has the huge potential to 1-1.61 Fibonacci Extensions. Final target is $1.9-$3.
Best regards,
Skyrexio Team
___________________________________________________________
Please, boost this article and subscribe our page if you like analysis!

Wormhole $W expecting ride in upcoming months - Hi 👋🏻 it's me your " Raj_crypt0 " once again back with potential growth coin ..... ✍🏻
• BINANCE:WUSDT / #w ( wormhole ) ... Analysis ⏰
🗝️ $0.45 is an important resistance expecting would be turn future support 💪🏻
🎯 $5 ...... ( Expecting 10X / +1000% from $0.45 confirmation zone )
__________________________________________________
🛑 Pls " DYOR " _ NOT A FINANCIAL ADVISOR 🚏
------------------------------------------------------------------------------
The FDV was sitting SEED_TVCODER77_ETHBTCDATA:4B around compared to present market cap it was 3 times ,
Expecting huge dollar in this project , circulation supply was around 3B / max supply was 10B
Presently they don't have much unlock 🔓 supply to the market....... ‼️
Easily expecting SEED_TVCODER77_ETHBTCDATA:10B - FWB:15B market cap .... Which can complete my target $5 .... 🎯
Hitting new low failure of my analysis ⏰ gradually...... 🛑
👉🏻 Follow me and my analysis for future content and updates ☝🏻

Wormhole. Could it be a unicorn of 2025?One of the nice projects that caught my attention. Can be the main transfer road in rwa sector.
* What i share here is not an investment advice. Please do your own research before investing in any digital asset.
* Never take my personal opinions as investment advice, you may lose all your money.

Incredible growth for Wormhole!The W token shows excellent activity from a blockchain perspective. Abnormally high activity of Wintermute and Flow Traders has been detected recently. This is the main reason for the imminent takeoff. Also on the current tokenomics we can notice that the main holders are funds, a couple of CEX and a large number of Flow Traders controlled wallets. My buy point at 0.2953 was made on December 30 and I will continue to hold my position until I reach the $5 per coin mark.
Horban Brothers.

W/USDT Ascending Breakout Setup - Bullish OpportunityOverview:
Wormhole is showing signs of a bullish breakout from a descending triangle pattern. Higher lows (pink trendline) indicate increasing buying pressure, and a breakout above the horizontal resistance could lead to significant upside.
Key Levels:
Breakout Point: Watch for a break and close above the resistance level with volume confirmation.
Targets:
T1: +55% gain based on the triangle’s height.
T2: +156% for the extended move.
T3: ?
Strategy:
Entry: On a breakout above resistance with volume confirmation.
Stop-Loss: Below the ascending pink trendline or triangle base.
Profit-Taking: Scale out at T1 and T2 levels.
Risks:
False breakout or lack of volume confirmation.
Unfavorable market conditions for altcoins.
This setup offers a strong risk/reward ratio for a bullish continuation if confirmed.
Disclaimer: Not financial advice. Trade responsibly!

WWW - Wormhole’s Winning WaveHello TradingView Family / Fellow Traders. This is Richard, also known as theSignalyst.
📈 W has been bullish from a macro perspective, trading within the flat rising wedge in blue.
Currently, Wormhole is in a correction phase approaching the lower bound of the wedge.
Moreover, the $0.2 - $0.23 is a strong support zone.
📚 As per my trading style:
As #W is around the lower bound of the wedge, I will be looking for bullish reversal setups (like a double bottom pattern, trendline break , and so on...) and target the $0.5 round number for the next bullish phase.
📚 Always follow your trading plan regarding entry, risk management, and trade management.
Good luck!
All Strategies Are Good; If Managed Properly!
~Rich
