WTI OIL Wait for a 4H MA50 test before enteringPattern: Channel Up & Bullish Megaphone on 4H.
Signal: Buy once contact is made again with the 4H MA50 (blue trend-line).
Target: 60.00 (top of the Channel).
Most recent WTI idea:
** Please support this idea with your likes and comments, it is the best way to keep it relevant and support me. **
--------------------------------------------------------------------------------------------------------
!! Donations via TradingView coins also help me a great deal at posting more free trading content and signals here !!
🎉 👍 Shout-out to TradingShot's 💰 top TradingView Coin donor 💰 this week ==> TradingView
--------------------------------------------------------------------------------------------------------
Wtioilsignals

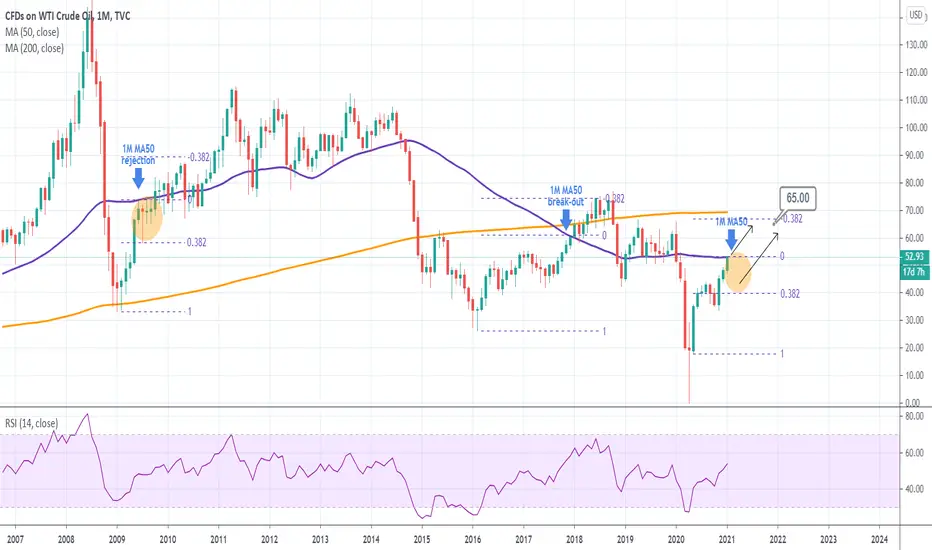
WTI OIL Testing the monthly MA50 for the first time since FebAttention is needed now for WTI Crude Oil traders as the asset has made contact with the 1M MA50. That is the first touch on that trend-line since February 2020, right before the massive March COVID melt-down.
Last time this level was tested as a Resistance, recovering from a similar melt-down, was in December 2017. The price easily broke above it on the next candle and made a top on the -0.382 Fibonacci extension.
Before that, the previous 1M MA50 test as a Resistance, was in June 2009. It failed to close the monthly candle above it and pulled back to the 0.382 Fibonnaci retracement level. Then a few months later, it closed its first candle above it (October 2009) and as in 2018, it peaked just below the -0.382 Fib extension.
What could this mean for oil traders? Well unless we close one 1M candle above the MA50 (53.00), then it is more likely to get a pull back to the 0.382 Fibonacci retracement level (40.00) before the price peaks on the -0.382 extension (65.00).
Do you agree? Feel free to share your work and let me know in the comments section!
Most recent WTI signal:
Please like, subscribe and share your ideas and charts with the community!
--------------------------------------------------------------------------------------------------------
!! Donations via TradingView coins also help me a great deal at posting more free trading content and signals here !!
🎉 👍 Shout-out to TradingShot's 💰 top TradingView Coin donor 💰 this week ==> ProjectSyndicate
--------------------------------------------------------------------------------------------------------
WTI OIL Buy SignalPattern: Channel Up on 4H.
Signal: Buy as the price is near the Higher Low trend-line of the pattern, the RSI near the Lower Low of its Channel Down and the MACD made the Bearish Cross
Target: 50.50 (the -0.236 Fibonacci extension).
Recent WTI signal:
** Please support this idea with your likes and comments, it is the best way to keep it relevant and support me. **
--------------------------------------------------------------------------------------------------------
!! Donations via TradingView coins also help me a great deal at posting more free trading content and signals here !!
🎉 👍 Shout-out to TradingShot's 💰 top TradingView Coin donor 💰 this week ==> Jpolitis
--------------------------------------------------------------------------------------------------------

WTI OIL just formed a Golden Cross on 1D!Oil is under pressure since Friday as it got rejected just short of the 41.70 Resistance. However as you see on the right chart (1D time-frame), that formed a Golden Cross, which is typically a bullish formation. Interestingly enough, the price action since the August high resemble that of early March - late May (when Oil formed a Bottom).
On the 4H chart, symmetry is having its way as we have 2 perfect contacts on the 41.70 Resistance and 36.60 Support already. If that pattern continues to be symmetrical, we may see a bounce on the 38.85 (or close) Interim Support (or Pivot however you may want to call it), as it happened on September 21.
Which pattern do you think will weigh more on Oil? The 4H Resistance/ Support or the 1D Golden Cross can make it finally break above and towards a new High? Feel free to share your work and let me know in the comments section!
Most recent Oil signal:
Please like, subscribe and share your ideas and charts with the community!
--------------------------------------------------------------------------------------------------------
!! Donations via TradingView coins also help me a great deal at posting more free trading content and signals here !!
🎉 👍 Shout-out to TradingShot's 💰 top TradingView Coin donor 💰 this week ==> AxelShadah
--------------------------------------------------------------------------------------------------------

OIL Trading PlanPattern: Channel Up on 4H.
Signal: (A) Buy as the price rebounded near the Higher Low trend-line of the Channel Up, (B) Sell if the 4H MA200 breaks.
Target: (A) 42.30 (Resistance) and 43.30 (Higher High of the pattern) in extension, (B) 38.00 (the Higher Low of the wider Channel Up).
Most recent signal:
** Please support this idea with your likes and comments, it is the best way to keep it relevant and support me. **

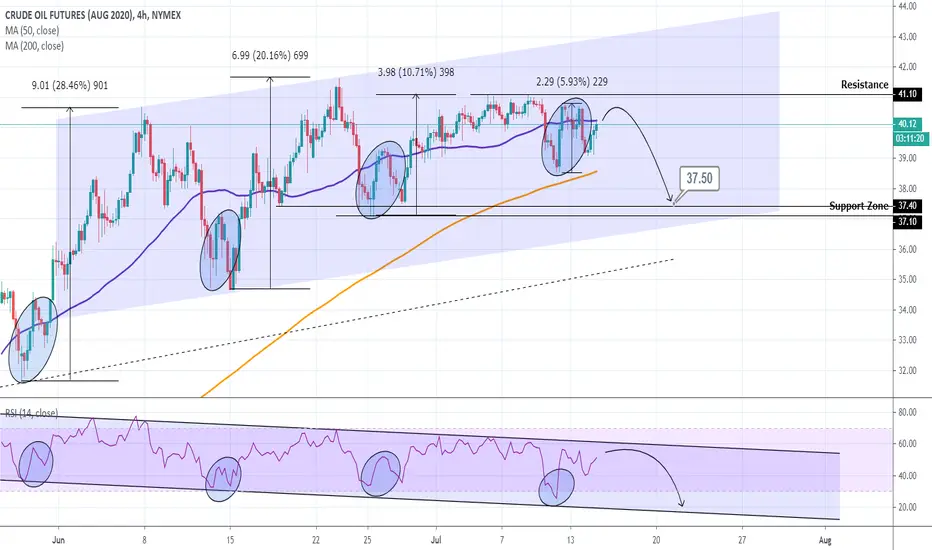
OIL Sell SignalPattern: Channel Up.
Signal: Bearish as the price failed to break the Resistance and th 4H RSI is at the top of its Channel and a similar bearish formation has been seen 4 times previously.
Target: 37.50 (just above the Support Zone).
** Please support this idea with your likes and comments, it is the best way to keep it relevant and support me. **
WTI OIL Trading planPattern: Triangle on 4H.
Signal: (A) Bullish if the Lower Highs trend-line breaks, (B) Bearish if it gets rejected.
Target: (A) 40.00 (just below the Resistance), (B) 36.00 (the first inner Higher Lows trend-line).
** Please support this idea with your likes and comments, it is the best way to keep it relevant and support me. **
Most recent Oil signal:

OIL Trading planPattern: Triangle within a Channel Up.
Signal: (A) Bullish as long as the inner Higher Low trend-line holds, (B) Bearish if the Channel Up breaks downwards (RSI on a bearish divergence).
Target: (A) 37.00 (just below the March 10 High), (B) 26.00 (just above the Symmetrical Support).
** Please support this idea with your likes and comments, it is the best way to keep it relevant and support me. **


USOIL Buy SignalPattern: Fibonacci retracement
Signal: Bullish as the price made a bullish cross on the MACD and the whole pattern is similar to the previous sequence that topped on the 0.618 Fibonacci.
Target: 22.80 (just below the 0.618 Fibonacci retracement).

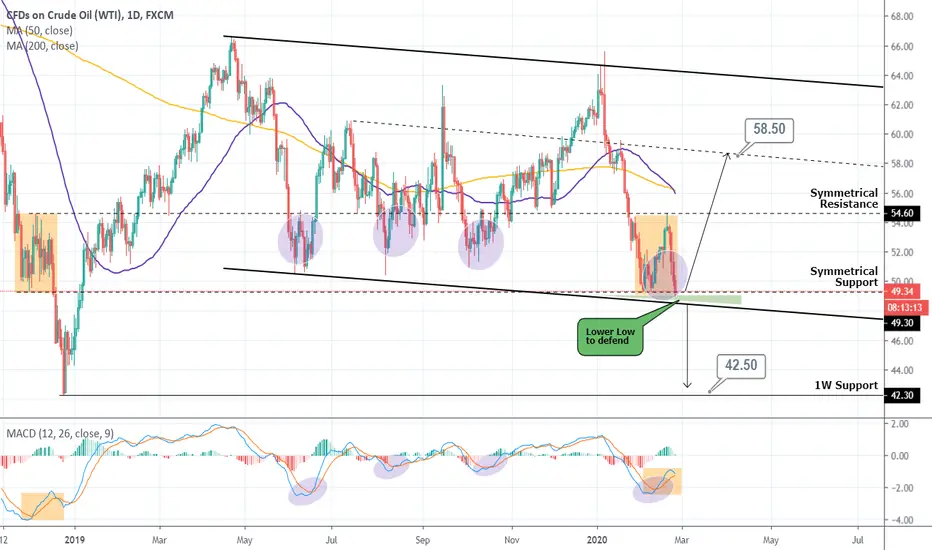
USOIL Why it MUST hold this Triangle. Danger for $42.5 otherwiseThe pattern is a Channel Down since the April 2019 66.60 top. However with the price rejected on the 54.60 Resistance and pulling back to the 49 region the very bearish fractal of 21 Nov - 14 Dec 2018 comes to my mind. See how both then and now the price traded within the 54.60 Resistance and 49.30 Support.
As a result buyers must defend the Lower Low zone of the long term Channel Down (which I have displayed it with the green Triangle) if they want to avoid an aggressive break down to the 42.30 1W Support (24 December bottom).
On the other hand, every time the Channel Down made a Lower Low, the price always made a pull back after the first rebound. I have illustrated that with the circles. It never jumped aggressively to a new High. So as long as the Lower Low zone holds, it is a long term technical buy.
USOIL Buy SignalPattern: Channel Up on 4H.
Signal: Bullish as the pattern made a Higher Low and the price was supported on the 4H MA50.
Target: 54.35 (Symmetrical Resistance).
Recent long term outlook:

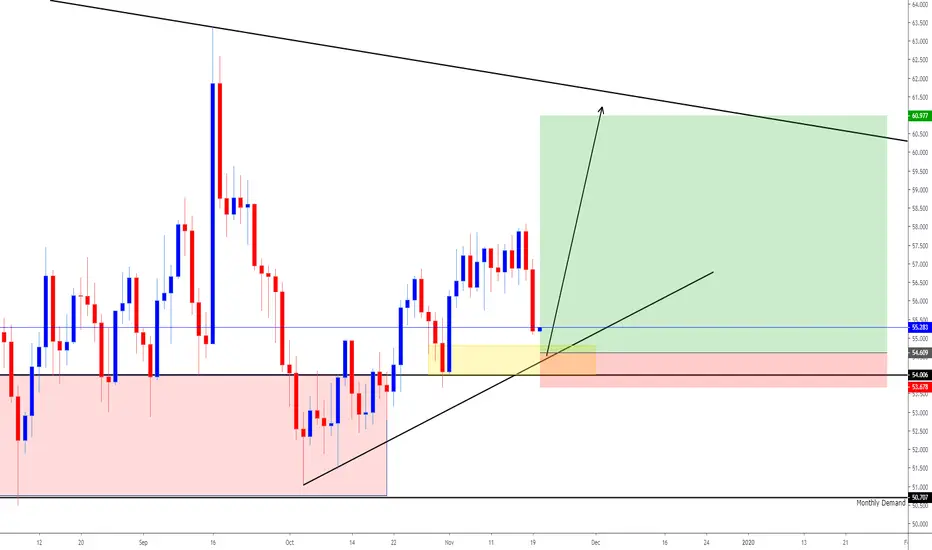
OIL - Daily - Buy setup for a swing trade Crude OIl - Daily - After recent distribution I can see price coming near a daily demand zone around 54.50.. I was long oil this week and got stopped out but mid term bias remains the same.. Oil is trading in a bullish structure so im anticipating a dip into the demand zone around 54.50 with stops below 53.70 and target 60-61...
WTI OIL Buy SignalPattern: Ascending Triangle on 4H.
Signal: Bullish as it approaches both the Support and the MA200.
Target: 61.90 (symmetry of Higher Highs).
