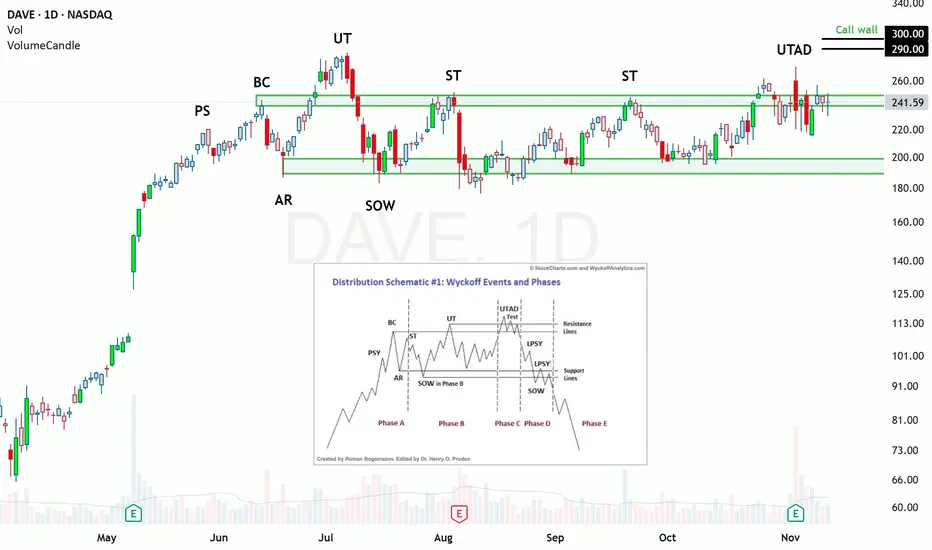
Is DAVE a Bull Trap? A Wyckoff Distribution take DAVE is flashing elements of a Wyckoff Distribution and could be setting up for a pullback soon. The market moves in cycles: buy low, uptrend, sell high, downtrend, repeat. The sell high part is what we are interested in for today's chart. Wyckoff theorized that you could identify when participants are finally starting to sell their shares by analyzing price and volume. The process is roughly outlined via his trading schematics.
*Note: The indicator on the chart highlights bullish and bearish candles that have above average volume for easy identification.
Phase A is all about stopping the uptrend. DAVE had a monster run from its previous earnings and we see our first evidence of profit taking at the PS. The buying climax (BC) is met with a large red sell candle with above average volume.
Phase B is about shedding shares. Note the wide candle spreads and large selling volume after the UT. Now that a range has been identified, institutions will use it to manipulate price and exit their positions. Note that the large volume days only appear at the top or bottom of the range.
Phase C is optional but I believe we are currently in it. Phase C is a test to see if there are any more buyers out there before they enter the downtrending phase. Institutions will break price above the trading range to make it seem as if the trend will continue to the upside when, in reality, they are loading up the short trade.
I have observed that this most recent earnings report has caused significant volatility. I am looking for institutions to try to send price higher. I think 180-190 would be ideal. That price is just around the initial UT high, and many traders are watching for new highs. The downside target would be about $110.
Please let me know your thoughts.
Wyckoffdistribution
Gold needs a correction after the ATH!Greetings!
If you see me at the charts, it means a fresh dose of solid analysis is coming.
Today my focus is on XAUUSD.
Yesterday we updated the ATH at 4642. Congrats to all holders and bullish traders. 🔥
This move happened amid global uncertainty. Greenland, Cuba, Iran, Trump is actively talking about all of this after what happened in Venezuela.
Because of that, investors are rushing into safe-haven assets to protect capital from a potential crisis.
And gold is the #1 safe-haven asset of all time.
Now to the chart:
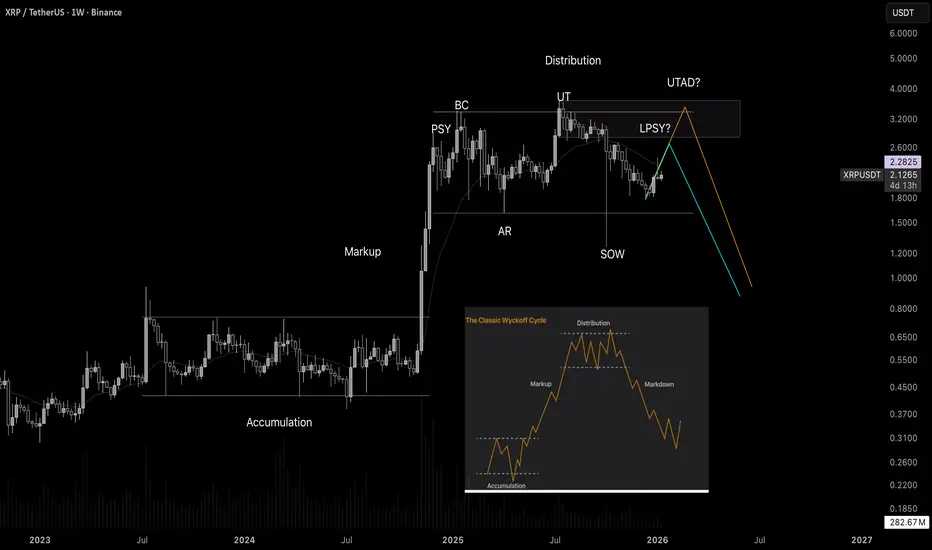
The local uptrend started with Wyckoff accumulation. After that, at the top of the channel, price went sideways and formed a Wyckoff distribution.
For those who don’t know:
Accumulation → potential reversal up
Distribution → potential reversal down
At the highs, smart money distributes, so I’m expecting the start of a correction (for now, local).
There are 2 key zones where we could potentially see a reversal.
Profits to everyone! 💰
Follow for more 🚀

The XRP chart is like from a textbook! Wyckoff tutorialWelcome! When finance professionals are watching, you can expect solid analytics and real education.
Today we’re going to break down Wyckoff market cycles using the XRP chart in real time.
Wyckoff cycles are not just theory - they are an established concept that works in all markets. This is a model of price behavior based on the actions of large players ("smart money"). It shows how professionals accumulate positions, drive the market, and distribute assets, creating repeating phases of growth and decline.
Any market moves cyclically. Wyckoff identified two major cycles:
Bull market cycle (Accumulation → Markup → Distribution → Markdown)
Bear market cycle (the mirror reflection of the first)
Each cycle consists of four phases:
-Accumulation
-Markup (Growth)
-Distributio
-Markdown (Decline)
Phase 1. Accumulation
This is the phase when "smart money" buys the asset in large volumes while trying not to push the price too high. Conditions are created where regular market participants do not want to buy the asset, and may even sell it near market lows. Usually during this period there is bad news, lack of confidence, etc. Large players quietly buy up all this negativity.
Phase 2. Markup (Growth)
An impulsive upward movement begins - a trend that everyone notices when it is already too late. The crowd starts to wake up and enters the market at high prices.
Phase 3. Distribution
The price again enters a trading range, but now major participants sell their positions to retail traders who come in euphoric after the rise. Usually, the news is excellent here, everyone expects further growth, there is general euphoria, people load into the asset to the maximum while large players quietly unload their positions.
Phase 4. Markdown (Decline)
Professionals have sold everything they wanted, and now the market goes down almost without resistance. Retail - back to the factory.
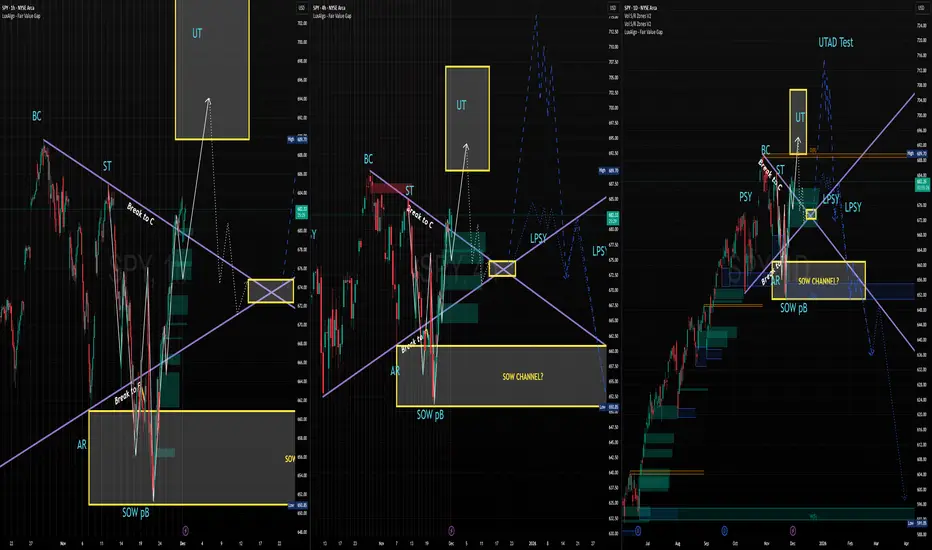
4H Long Term $SPY Wyckoff Distribution StructureThis idea is an updated and more simplified chart to show current structure that has build out on the 4H chart from the multi-timeframed chart I had in a previous idea -
As the title states, we have a Wyckoff distribution method/pattern in play here on the chart.
So far the set up and pattern has been pretty on-point if you take a look and analyze Wyckoff Methods from www.wyckoffanalytics.com
.
I don't have a ton of additional analysis to add here. I am only analyzing the chart and indicators I have. However, I'd love to hear some additional feedback for contrasting opinions or agreeing opinions for some confluence.
I'll add that two weeks later from the original idea, the structure, important support / resistance zones, and volume at those areas in the structure strengthens my opinions on validity of what is forming here.
This is still too early in the pattern / structure to play any moves based solely on this idea. In my opinion we are likely in the latter half of Phase B and this will take some patience to play out if you find conviction in it.
I am being patient and playing what the market gives me on an intra-day and intra-week basis while keeping this chart in the back of my mind.
I'm still early in my trading and TA journey (began January of this year) and I'm still learning but I thought I'd share an idea with the TV community that I have been keeping my eye on and trying to learn more about.
Thanks for your time and as stated in my other idea, it is always great to hear feedback for contrasting opinions or agreeing opinions for some confluence.

Long Term Wyckoff Distribution In-PlayAs the title states, we have a Wyckoff distribution method/pattern in play here on the chart.
So far the set up and pattern has been pretty on-point if you take a look and analyze Wyckoff Methods from www.wyckoffanalytics.com .
I don't have a ton of additional analysis to add here. I am only analyzing the chart and indicators I have. However, I'd love to hear some additional feedback for contrasting opinions or agreeing opinions for some confluence.
Have a great day TV gang and I hope you have a great December.
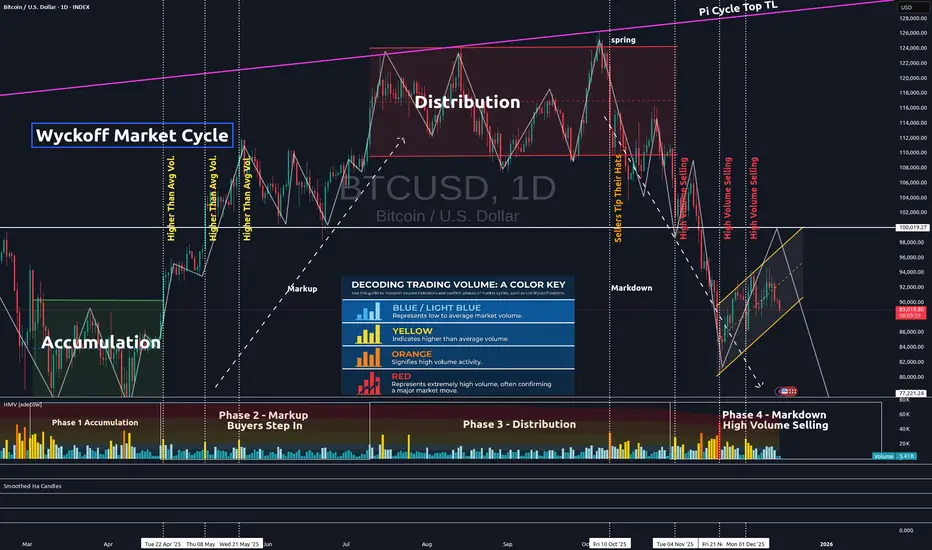
Confirming Chart Patterns With VolumeIn the chart above, one can clearly recognize the Wyckoff Market Cycle pattern. The pattern's legitimacy can be confirmed by volume. The volume is represented in the lower portion of the chart.
Low to average volume candles are blue. Average volume is indicated by light blue candles. Yellow candles represent higher than average volume. Orange is high volume. And red represents extremely high volume.
You will see each phase of the Wyckoff Market Cycle pattern confirmed by this volume on our current Bitcoin chart.
First, the market enters the accumulation phase. Market volume is fairly high, as seen in the accumulation quadrant in the lower left on the chart. However, it is important to note that there is an equal distribution of high-volume selling days as there are high-volume buying days. Thus, price tends to trend sideways within the channel until the true buying power comes into action.
Next, the buyers step in and take the price higher. This is generally indicated by a high-volume day when the price breaks above the accumulation channel. When buyers step in, most of the yellow and orange volume candles are, in fact, buyers in the markup phase. You can verify this is true by lining these higher-than-average volume candles up with the green price candles on the Bitcoin chart. This indicates the markup phase has begun and is underway.
Then, we come to the distribution phase on our chart. Notice the volume in that 3rd quadrant, the distribution quadrant. It is mostly average volume. Institutional sellers are attempting to carefully exit quietly. But you can also see that near the end of the distribution phase, sellers are starting to step in, tipping their hats and indicating that the distribution phase is about to end.
Finally, sellers take back full control, dropping us from the distribution channel altogether. High volume selling confirms this move and the pattern. The final quadrant in the bottom right proves that mostly sellers have control, as the majority of higher volume candles (yellow, orange, and red) are credited to the sellers.
Our Wyckoff Market Cycle pattern is now confirmed, and further selling can be expected until volume is once again taken back by the buyers. One will need to see clearly that high-volume candles are in line with green price candles. In this chart, that is not yet the case. Thus, more selling should be expected until it is clearly evident that buyer command control once again.
Hope you found this brief educational write-up informative and helpful, as volume can often be utilized in many uncertain pattern formations to find pattern legitimacy and confirmation.
✌️Stew
15M/30M Possible Wyckoff Distribution on $SPYFor tomorrow for me it's pretty simple, looking at the 15M and 30M charts.
Break above $685 with some force and I re-analyze what I thought was a Wyckoff Distro on the 15M/30M charts.
Chop between $683 & $685, then look for a break below $685 and it aligns with Phase C > Phase D LPSY.
Not financial advice, I am a regard.

BTCUSDT -- Is 98K a key level??BTCUSDT -- Is 98K a key level and we see another ATH or we already hit the top of this cycle?
I would like some insights from expert and experienced traders here.

BITCOIN SHORT (EXPERIMENTAL)In a bear market scenario, Bitcoin might see extended periods of stagnation or decline, which could challenge its perception as a store of value or its role in a diversified investment portfolio. However, bear markets can also present buying opportunities for long-term investors, as they may view the price declines as temporary setbacks in Bitcoin's overall growth trajectory.


BTC — Is This the End of Bitcoin’s Bull Market?First of all, I’ve been quite busy the past few weeks working on some exciting projects and developing new indicators that’s why I haven’t posted much here lately. But now I’m back with a fresh Bitcoin analysis, and there’s a lot to unpack.
Macro Context
BTC’s recent structure has played out exactly like a classic Wyckoff Distribution schematic.
Back in mid-July (14th July 2025), we printed a Buying Climax (BC), followed by an Upthrust (UT) → SFP / liquidity grab. Later, price formed a UTAD (Upthrust After Distribution) → the final failed breakout, confirming buyer exhaustion and triggering the sharp sell-off event that followed.
After that sell-off, BTC retested the monthly resistance level at $115,764 twice:
The first attempt resulted in a clean rejection.
The second led to SFP of the high, confirming a bull trap and setting the tone for further downside.
The monthly resistance turned out to be the most ideal short entry, offering a near-perfect risk-to-reward setup after the clear rejection. The charts really tell the whole story, BTC has followed the technical structure perfectly.
Current Structure & Key Levels
Today, we tapped the $100K psychological level, aligning with the $2 trillion market cap, that produced an initial bounce.
The question now: is this the start of a meaningful bounce, or just a relief rally before further downside?
Looking at the wave structure, we are most likely in a Wave 3 (iii) → meaning more downside pressure remains probable.
BTCUSD (INDEX):
Key Low: $98,200 — Sell-Side Liquidity
0.618 Fib retracement: ~$94,254 — ideal long entry zone
Trend-based Fib Extension (1.0): ~$93,728
Yearly Open: $93,576
The Volume Profile shows a high-volume node between $98K–$94K, with the POC at $96.4K, perfectly aligning with the support trendline and key low.
This gives us a high-probability long zone between $98.2K and $93.5K, an area where multiple technical factors align:
Key low liquidity
Fib confluence (0.618 FR & 1.0 TBFE)
Yearly open
Volume cluster (POC)
Rising trendline support
Pattern Confluence
After the rejection at the monthly resistance ($115,764), a clear Head & Shoulders pattern also formed → another strong bearish confluence.
The neckline was broken cleanly, confirming the expectation for further downside, which is now playing out.
Psychological & Technical Zones
At the moment, $100K remains a psychological key support and the market is reacting accordingly.
Now it’s time to pay close attention as we approach critical levels, especially the long opportunity zone (98.2K–93.5K).
🟢 Ideal trade plan:
Long Entry Zone: $98.2K → $93.5K
Take Profit 1: $100K
Take Profit 2: $104K
Stop Loss: below the Yearly Open ($93.5K)
Summary
Structure: Wyckoff Distribution → Markdown Phase
Pattern: Head & Shoulders confirmed
Bias: Bearish, but approaching high-value long zone
Watch for: SFP of $98.2K → potential reversal trigger
Main invalidation: Below Yearly Open ($93.5K)
BTC continues to respect the technicals beautifully.
Stay patient! The next high-probability long setup is forming right in front of us.
🔍 Indicators used
DriftLine — Pivot Open Zones → For identifying key yearly/monthly/weekly/daily opens that act as major S/R reference points
LuxAlgo — Liquidity Sentiment Profile (Auto-Anchored)
➡️ Available for free. You can find it on my profile under “Scripts” and apply it directly to your charts for extra confluence when planning your trades.
_________________________________
💬 If you found this helpful, drop a like and comment!

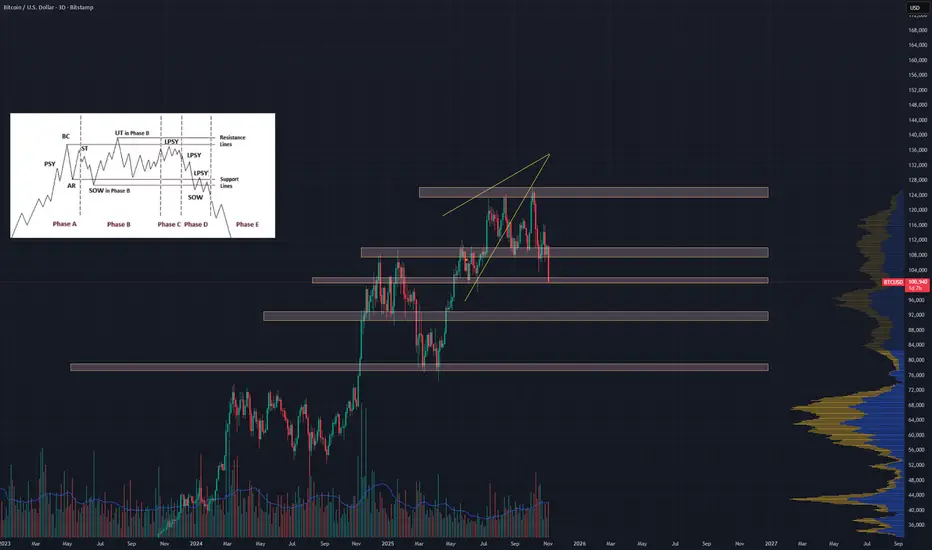
Another BTC Chart but created with PnF chartingThese drawings were made with a One Hour PnF chart for Bitcoin. Wyckoff distribution picture included for posterity.
Chart speaks for itself along with my last chart. Those Supply/Demand Zones will tell you a lot.
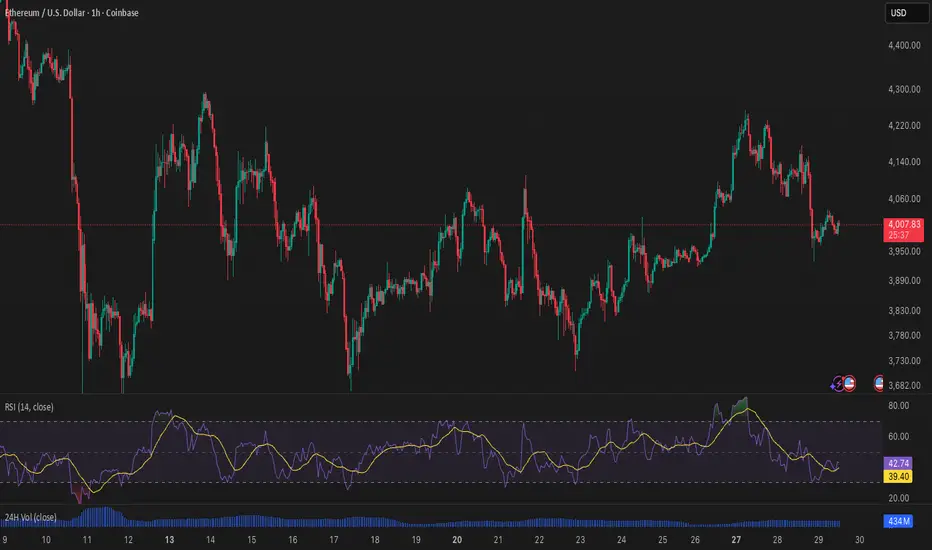
Wyckoff Distribution - Cycle Top Is In?This idea is sharing the potential for the top being in for ETH and lower timeframe starting the final phase of Wyckoff Distribution.
🔍 Pattern Identification
Phase A–E of a Wyckoff distribution.
Buying Climax (BC) → Automatic Reaction (AR) → Upthrust (UT/UTAD) → Sign of Weakness (SOW).
The “5a / 5b” double top corresponds to the Upthrust After Distribution (UTAD).
The price currently sits near the midpoint of the channel, testing resistance around the 50-day SMA (yellow) and prior support-turned-resistance zones.
📉 Statistical Likelihood of Breakdown
Historically, when this distribution schematic appears in crypto or equities, it resolves to the downside roughly 65–75% of the time — provided:
Volume confirms weakness (volume declining on rallies and expanding on downswings).
Lower highs and lower lows continue forming after the UTAD.
Momentum (RSI) fails to confirm new highs (bearish divergence).
RSI is below 50 and rolling over → neutral-to-bearish momentum.
The price rejected near the 50-day SMA and upper channel resistance.
Structure shows multiple failed breakout attempts above $4,200–$4,400, aligning with a classic distribution top.
📊 Based on backtests of Wyckoff distribution-type structures (in both traditional and crypto markets):
Downside resolution probability: 70% ±10%.
Neutral consolidation (sideways): 20%.
Bullish continuation / spring scenario: 10%.
🧠 Validity of the Pattern on the Weekly
✅ Higher timeframe = stronger implication.
On the weekly chart:
The structure has clear symmetry to Wyckoff’s Distribution Schematic.
There is a confirmed lower high (5b) near prior ATH.
Volume contraction aligns with a mature distribution.
RSI failing to reclaim 70 and diverging from price adds to bearish confluence.
In Wyckoff methodology, patterns across multiple timeframes that confirm each other (daily + weekly) dramatically increase probability of follow-through.
🧩 Multi-Timeframe Synthesis
Daily: short-term distribution (local microstructure)
Weekly: intermediate distribution (macro confirmation)
Monthly: major cycle-top distribution (potential cycle exhaustion)
These three are nested fractals — the monthly chart is the “parent” structure of the same Wyckoff behavior visible on lower frames.
That multi-timeframe confluence adds tremendous weight:
In Wyckoff terms, a valid distribution on monthly + weekly + daily timeframes is statistically one of the highest-probability setups for a major markdown (≈ 80–85% historical probability once confirmed).
🧩 Fractal Nature of Wyckoff Structures
Markets are fractal: smaller patterns nest inside larger ones.
The daily distribution identified is the micro-mechanics — the short-term redistribution of supply near resistance.
The weekly structure is the intermediate framework confirming that supply dominance isn’t just a blip but a developing trend.
The monthly is the macro cycle top — the large-scale distribution that governs the whole market phase (multi-year).
📉 Typical Retrace Targets in Multi-Timeframe Distributions
When a smaller-scale breakdown completes the macro distribution:
Retrace depth: often 50–65 % of the total distribution height.
For ETH, measured from the $4,800 top to the $1,400 macro base → retracement targets of $2,500–$3,000 are classic.
In extreme cases (full Phase E markdown), price can revisit or slightly undercut the long-term demand line (~$1,800–$2,000) before new accumulation begins.
BTC — Targets for the Current CycleIt looks like BTC is completing its growth phase. The current structure points to a distribution stage and a gradual rotation of liquidity into ETH and altcoins.
Still, our key levels for this move remain:
🎯 Target 1: $102,000 — key support and possible first reaction zone.
🎯 Target 2: $87,000 — deeper retracement
🎯 Target 3: $64,000

Wyckoff Distribution schematicsThis count is based on my assumptions so anything can happen not a trading or financial advice just for educational purposes only kindly do your own ta thanks trade with care good luck.

Wyckoff Distribution schematicsThis count is based on my assumptions so anything can happen not a trading or financial advice just for educational purposes only kindly do your own ta thanks trade with care good luck.

$BTC Wyckoff DistributionPreliminary supply, or PSY:
Occurs when significant interests start to sell lots of shares following a sharp upward trend. Volume increases and the price spread widens, indicating the possibility of a trend change.
BC:
buying climax, characterized by frequently significant rises in volume and price spread. The intensity of purchasing peaks, with professional interests filling heavy or urgent public demand at prices close to their peak. Since large operators require enormous public demand to sell their shares without reducing the stock price, a BC frequently occurs in conjunction with excellent earnings reports or other positive news.
AR:
Automatic reaction. After the BC, the strong buying significantly decreased, but the heavy supply persisted, and an AR occurred. The lower border of the distribution TR is defined in part by the selloff's low.
ST:
Stands for the secondary test, in which the price returns to the BC region to evaluate the demand/supply situation at the current price levels. Supply must exceed demand for a top to be confirmed, so volume and spread should decline as the price moves closer to BC's resistance zone. An ST could appear as an upthrust (UT), in which case the price goes above the resistance indicated by the BC and perhaps other STs before abruptly reversing to close below resistance. Price frequently tests the TR's lower boundary after a UT.
SOW—sign of weakness:
A downtrend to (or just barely past) the TR's lower border, typically accompanied by an increase in spread and volume, is an indication of weakness (SOW). The AR and the initial SOW(s) point to a shift in the stock's price movement, with supply now in control.
Last point of supply, or LPSY:
A weak rally on a tight spread following a test of support on a SOW indicates that the market is having significant difficulties advancing. Strong supply, low demand, or both may be to blame for this market's inability to recover. Before markdowns start in earnest, LPSYs signify the end of the demand cycle and the final distribution waves from large operators.

Wyckoff Distribution in Usdjpy short?This count is based on my assumptions so anything can happen not a trading or financial advice just for educational purposes only kindly do your own ta thanks trade with care good luck.

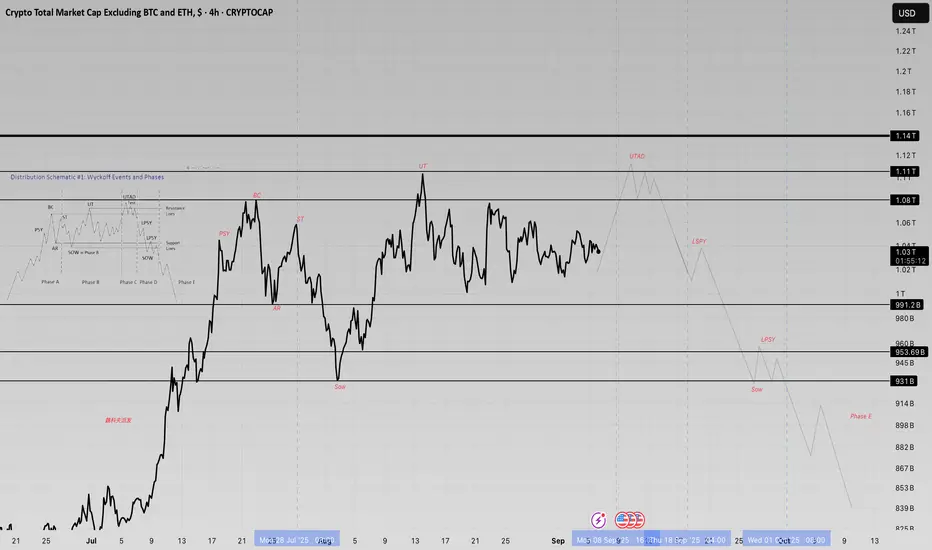
The Anatomy of a Trap: Total 3Chart, Wyckoff DistributionPrice action is beginning to show characteristics often associated with distribution. Multiple retests of resistance with waning momentum could be a sign of absorption rather than genuine strength. If this pattern develops further, the next move may involve a deceptive breakout attempt before revealing the market’s true direction.”
Wyckoff Accumilation Live ExampleRichard Wyckoff has a theory regardign the markets phases, and this video exlaborates the accumilation with a live example from the main Swiss index SUI20
Best of Luch
MarketsTitan

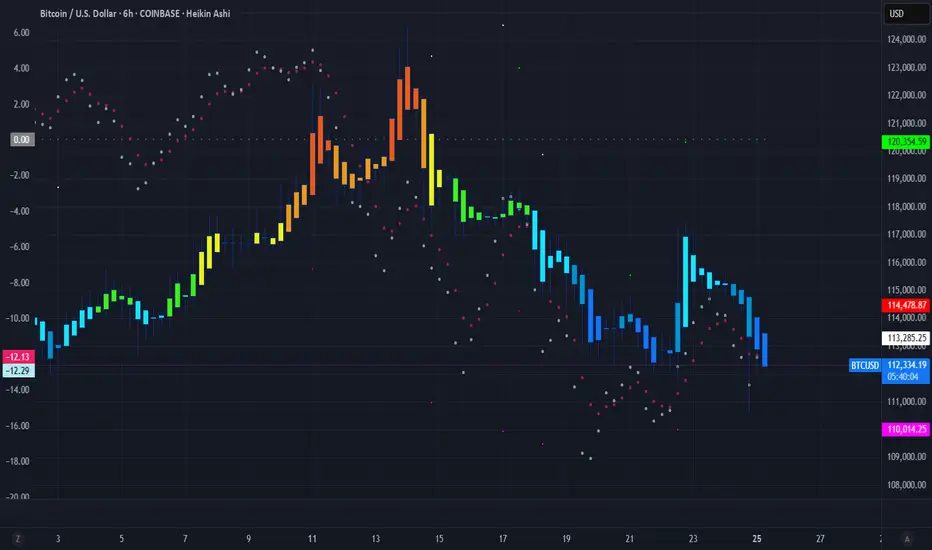
▒₿▒ Distribution Top - Anatomy of a Bitcoin Cycle Top ▒₿▒COINBASE:BTCUSD
I've identified key price action indications that we have "topped" with an ATH for this Bull Market Cycle. There is a much deeper analysis that needs to be done here.
While this price action is the first major clue, to confirm a true distribution top, we'll also need to analyze volume profiles for institutional selling, spot bearish divergences in key momentum oscillators, and watch on-chain metrics for any signs of whale or miner selling pressure.
Every Bitcoin cycle has a story, and the final chapter is always the most dramatic. I've been analyzing the price action at every major cycle peak, and there's a recurring pattern that acts like a final warning before the curtain falls. It’s not the explosive top itself, but the messy, indecisive period that follows: the Distribution Top .
This isn't just a pattern; it's the visual footprint of a massive transfer of wealth. It’s the moment when the cycle's early investors (smart money) begin to distribute their holdings to the late, euphoric buyers.
Look at the price action from the November 2021 ATH top. After the euphoric peak, the clean, powerful uptrend dies. It's replaced by a volatile, sideways "wiggle." The Heikin Ashi candles lose their bodies, showing long wicks on both sides. This is the signature of market conflict and exhaustion.
Cycle Tops vs. Local Highs: A Crucial Distinction
It's important to understand that this "wiggle" is unique to major, euphoric ATH cycle tops. Other tops, like the one from August 2021 shown below, have a much different character. Notice how the rejection is sharper, faster, and lacks the prolonged, grinding "wiggle." This is often a rejection from a known resistance level, not the slow, painful end of cycle-wide euphoria.
The "Distribution Top" is a process. It’s designed to churn, create confusion, and trap breakout traders before the real move down begins. It’s the market grinding at the highs, absorbing the last wave of FOMO. We saw this exact anatomy play out in the April 2021 top as well.
The Key Takeaway for Bitcoin Investors:
Recognizing this specific pattern is crucial for capital preservation. When you see this shift from clean momentum to choppy, indecisive grinding near an all-time high , it's a signal that the market character has changed. The risk is no longer to the upside; it's to the downside.
While this price action is the first major clue, to confirm a true distribution top, we'll also need to analyze key trend lines, candlestick patterns, seasonality, volume profiles for institutional selling, and watch on-chain metrics for any signs of whale or miner selling pressure.
Now, take a look at the most recent price action. We are seeing the early stages of this very same pattern developing after a new high.
The question every Bitcoin holder should be asking is: Is this history rhyming once again?
As I mentioned at the start of this post, there are much more metrics to analyze here, so I'll be updating this post with further findings.
DISCLAIMER
I AM NOT A FINACIAL ADVISOR, NOR AM I YOURS. THIS IS NOT FINANCIAL ADVICE. MEARLY DOODLINGS ON A MATHMATICALLY DRIVEN GRAPHICAL INTERFACE, TRACKING AN INVISIBLE 256BIT MILITARY-GRADE ENCRYPTED ASSET. . . FOR ENTERTAINMENT/AMUSEMENT PUROSES ONLY. ENJOY!
Looking to hear your thoughts on this @TradingView @Profit_Through_Patience @David_Perk @ProjectSyndicate @Xanrox_ @HAMED_AZ @melikatrader94
Dead Cat or Last Breath? RHC’s Pivot Trap LoomsRHC is sitting at a pivotal moment. For the bullish case to stay alive, we need to see price swiftly reclaim and close above ~$43 — that’s the line in the sand.
However, I’m leaning toward Scenario 1, which suggests a short-term push up to the yearly pivot and macro 50% retracement level, followed by a rejection and sharp move lower.
Bearish Pathway
Initial Bounce: Push toward ~$43 could trap late longs.
Rejection Zone: Yearly pivot and macro 50% level act as resistance.
Downside Targets:
First stop: $26 — previous structural support.
Then potentially: $18 — deeper liquidity zone and psychological level.

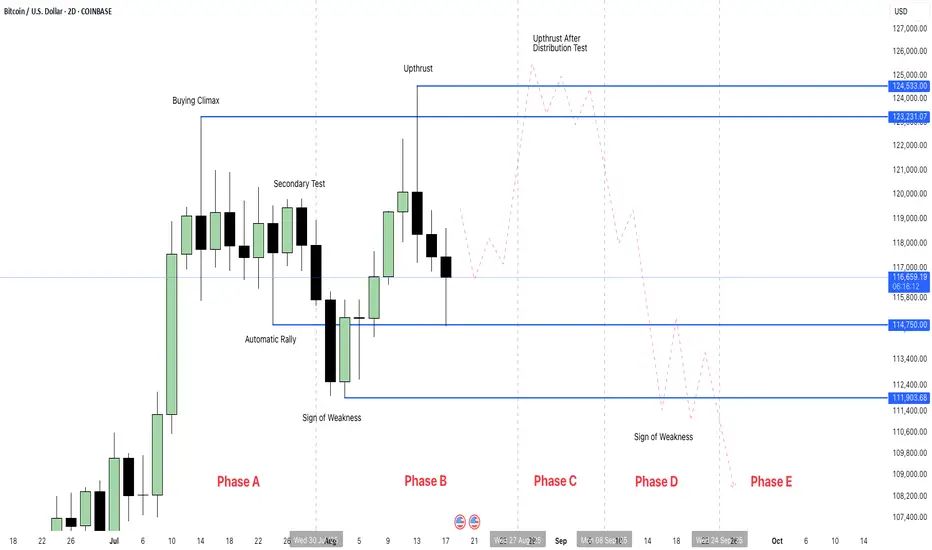
BTC Bitcoin in Distribution Phase BLOW-OFF TOPI believe Bitcoin BTC is in Wyckoff Distribution Phase B heading for Upthrust After Distribution (New ATH) Sweeping $124,500 price.
For me, that would be the BLOW-OFF TOP and the end of this cycles.
For this scenario to play out, after taking liquidity above the current ATH, it needs to start reversing and dropping.
If it closes above the current ATH, then this idea would be invalidated.
There are other factors which would confirm this idea but I am not gonna share it publicly.
Good luck and Happy Trading...