time to build more power in the chart (possible play out) we need to claim levels back. after reclaim going back to grabe some more liq. should be perfect for printing some divergent on the chart.
Wyckoffmethod

elliot wave wyckoff playing out possible making bodem ?possible playing out this pattern building some strength in the market before we can make a spring.

BTC to Test Support of a Wyckoff Re-Distribution Trading RangeThe BTC price continues to be observed in Phase B of a Wyckoff re-distribution trading range. We should consider this a re-distribution trading range (to be confirmed or to fail based on market events) rather than a re-accumulation trading range as the BTC price has been in a down trending environment for the past 6 or so months. This Wyckoff re-distribution trading range (upper bound = $31,520; lower bound = $25,340) is interesting in that the price has spent the majority of the time in the upper portion of the trading range (green shading, lower boundary of the upper portion is given by the low of the preliminary support (PS) event). In most cases, the price would test the trading range support level ($25,340) several times as it moves through the range so, in this regard, the trading range is a bit atypical.
That said, it appears that BTC will be testing the trading range support level ($25,340) soon as it already has broken support at the PS event and the BTC price is observed in the lower portion of the trading range (red shading, lower boundary of the lower potion is given by the selling climax low) in what might be a shakeout/sign of weakness (SO/SOW) event. This idea is consistent with the Phoenix Ascending (PA) indicator, given in the lower panel. I expect both the red and blue lines and likely the BTC price to continue on their downward trajectory.
Note the low volume over the last week compared to the climatic volume observed at the PS and selling climax (SC) events. This tells me two things: (1) The BTC price is able to move downward through the trading range with relative ease. If the trading range support is to hold then demand needs to be observed. (2) As the beginning and the end of Wyckoff trading ranges are typically marked by climatic level volume, BTC will likely continue within this trading range.
Significant bars, which help define important areas of support and resistance, are given by the blue shading. Wyckoff abbreviations: automatic rally (ARa), selling climax (SC), secondary test (ST), upthrust (UT), preliminary support (PS), failed upthrust (FUT), last point of supply (LPSY), shakeout (SO), sign of weakness (SOW), Phase A (Ph A), Phase B (Ph B), Phase C (Ph C), Phase D (Ph D), Phase E (Ph E).
This is not financial advice. I am not your financial advisor. This is my opinion.


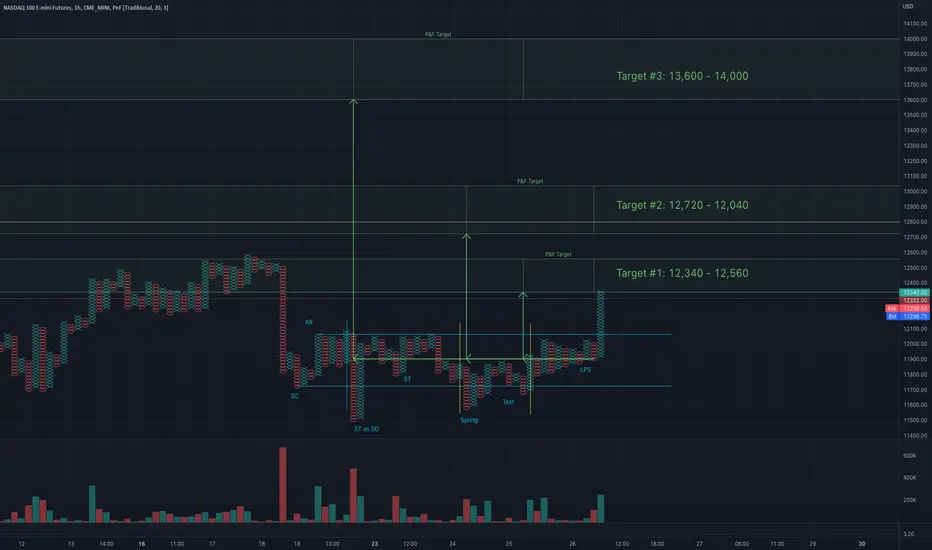
NASDAQ Targets and Timing using WyckoffWhat if I told you that there is a method to project not only the targets for the next move in the NASDAQ100, but also the timing? In this post I will present my case for a likely move up, suggest where it will go, and provide a technique for identifying when the move is about to start.
First a request. If you find this useful, please hit the like button and follow me (hover your mouse over my profile picture). To get live updates (such as when I see that move starting to happen), please also follow the idea.
I recently posted an idea that provided targets for the NASDAQ100 based on the accumulation structure over the second half of May (see Related Ideas below). My Target #1 and Target #2 were hit, and as expected, the index is consolidating there. The higher targets from that post are shown as Target A3 (13,600-14,000) and Target A4 (14,080-14,480) on the above chart, relating to Structure A.
The current trading range, Structure B, could resolve as an accumulation. It is also possible (although, I believe, less likely) that the structure is distribution. In which case, my preliminary target is shown in red as Target BD1 (11,080-11,320), which would be a new low. It is possible that the count could grow with more consolidation, projecting lower targets. It is not possible to be sure of accumulation vs. distribution until the structure is more complete. However, the strength of the move yesterday was suggestive of accumulation. Today, we should find out and I will provide regular updates.
Using the Wyckoff P&F counting method, it is possible to get clues of when price will break out of a trading range. A breakout could happen when the count for the re-accumulation (Structure B) confirms a prior count for the original accumulation (Structure A). Because P&F counts are based on a combination of volatility and time, we can't project an actual time, but instead project the number of columns that must be completed. See the yellow lines on the chart. The first dotted yellow line relates to the lowest price in Target A3. The second dotted yellow line relates to the lowest price in Target A4. I will be looking for signs that a breakout is close, such as the ability to stay high in the trading range and with reducing volatility and spread. If the P&F columns are at one of these dotted lines when this happens, it is a clue that price may breakout soon. This is potentially a good point of entry.
If you have any questions, please feel free to ask. I will make updates later today.

btc - redistribution once againelliott wave analysis of bitcon on daily timeframe
looking at the chart there could be a possible zigzag formation (5-3-5 structure), labeled with red ABC on the chart
currently, in lower degree abc correction is in play and wave B on higher timeframe.
depending on abc formation, here is what to be expected
- if abc is forming zigzag formation then we may expect some more bullish price action before any probable reversal
- on the other hand, abc could form an expanded flat with a complex b wave and the formation will perfectly fit to wyckoff redistribution sychmatic. in this case we may experience a bearish price action - probably below the local bottom - folowed with a bullish price around the half of wave A in higher degree which will complete abc formation on lower degree. please check details presented on the chart
abc completion also means end of wave B in higher degree. based on zigzag rules wave C implies a bearish impulsive (5 waves) price action
please note that :
- these patterns do not provide any kind of certainty about future price movement, but rather, serve in helping to order the probabilities for future market action
- trade setups must be confirmed in conjunction with other forms of technical and fundamental analysis
- and please remeber that this analysis is not a financial advice and presented for educational purpose only
Peace at Home, Peace in the World

WYCKOFF METHOD on BTC short ok boys i dont think market get bullish but i am the bear right now . i will update this publish . lets see what will happen :)

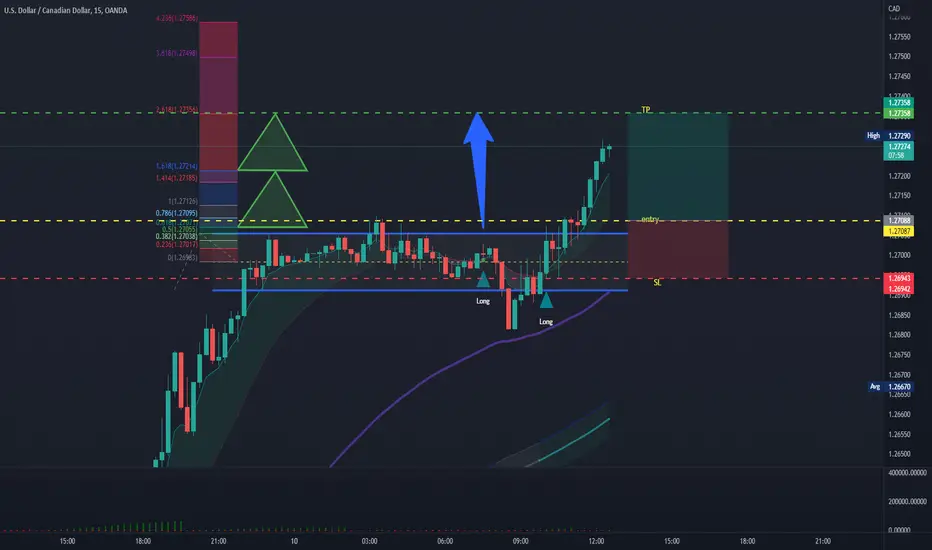
Wyckoff Logic Supply and DemandUSDCAD
Technical analysis
Cause, re-accumulation, equilibrium sequence between demand and supply between quotas, supply zone 1. 27056 & 1.26908 demand zone .
Demand is greater than Supply !
Implications, long!
Pattern Rally base Rally !
The effect generated by approx
30 pips.
SL 1.2945
Entry, sell! 1.27087
TP 1.27358
⭕ = circle
⏹ = square
🔺️ = triangle
Unit = ⭕ market
Polarity = 🔺️demand & 🔻supply
Equilibrium = ⏹ range ("the ratio between supply and demand is =")
PRINCIPLE OF DEMAND AND SUPPLY
The law of supply and demand
- here the analysts study the relationship between supply and demand , having as a reference point the price and
volume over a period of time as shown on the chart.
KEY DEFINITION
The law of supply and demand is of the utmost importance. If the application to
buy an instrument (currency pairs, stocks, commodities , metals, bonds, cryptocurrencies)
is higher than the available supply, the only way the demand can be met is
for the price to rise to a level that attracts enough supply to match demand.
When this point is reached, the price does not advance. If the offer to sell is
higher than the demand to buy, the only way the supply will be absorbed is as
the price drops to a point that attracts enough demand to absorb all
the amount. When that happens, the price doesn't go down.
Dow Review (English subtitles)Click the "subscribe" necessarily if you come review! Then I will post more ideas.
My training and analysis chat Wyckoff Analitics look in the chats and subscribe
Friends I conduct training in individual format and a limited number of students, as a large number will interfere with my trading!
The course includes :
Wyckoff Method
Demark method
VSA
Trading method tailored to your psycho-type
Trading Psychology
For more details please contact me in a private message
I can also introduce you with my unique indicators, of my own design
Wykoff Zone (Defines activity and smart money zones and also gives buy and sell signals)
Indicator Demark, which has no analogues on the platform - as most of the indicators are far from the essence of the methodology of Demark and too simplified, which violates the basics of the principle of
For investors, I can transfer the 2 weeks course Lazy Investor on which you can learn how to invest and in what shares to invest + method of cross zeros
Completed with my own developments taking into account the imbalance of supply and demand
Indicator Wyckoff Line created by the activity of professionals and identification of liquidity zones, to which the price is attracted.
Remember that the market is only driven by supply and demand. No technical indicators will tell you in advance whether a supply or demand imbalance has occurred.
Listening to the news can put you in a state of wrong decision, so make decisions only by the activity zones of professionals. By understanding where the imbalance of supply and demand is occurring, you can correctly build your strategy of work.
The indicator has a clever algorithm that takes into account the activity zones on several timeframes above the working chart.
It also includes a system of VSA, which determines the entry point for buying or selling a certain instrument. The entry point is determined by the imbalance of volume and price on the principle of lack of demand, or lack of supply in liquid areas.
Take a look at "Figure 1", which clearly shows the supply test after which the price reached the next liquidity level in WMT stock
The following example clearly shows a buy after a downtrend, which after the passage of the liquidity zone defined a clear signal to buy the stock AAPL
The essence of the indicator is that high volume is always a liquidity zone, into which the price will constantly strive. The indicator determines the liquidity zones of the professionals, which you set on the higher timeframes with the help of certain settings of the high volume bar. And along with the indicator package I provide a tutorial video where I tell you how to use this indicator. I also give some author's settings and recommendations for entering or exiting a position.
Now let's analyze the sell signal. Here is an example of one of the sell signals in which the indicator clearly worked:
The price reached the liquidity zone and it signaled three times that it was time to enter the position. Next, using completely different entry techniques, you could sell the KO stock or, if you were trending upwards and your techniques did not involve selling, you could simply exit your position in time.
The uniqueness of the indicator is that it works on a chart like crosses zero. By setting liquidity zones, you can use the signal of this indicator to enter a position without any market noise. Take a look at the example below where an entry was made into an MSFT stock:
snapshot
To start using the indicator you need to write me a private message.
I will send you instructions for using the indicator and my recommendations (how to enter and exit a position) and indicator settings.
You can receive free support and advice from me during the whole time of using the indicator by writing me in personal messages.
Ability to use the indicator in different languages: I will provide you with a video guide for setting and instructions for use in your own language.
Available languages for using the indicator: Russian, English, Chinese, Spanish, German.
Translation of indicator settings into different languages is in progress.
Indicator subscription price is $20.
Indicator purchase for unlimited use is $300.


XAUUSD analysis today, where's Gold price pullback to ?Are you trading gold ?
Here's a quick XAUUSD analysis today.
We estimates gold's price using Wyckoff's P&F chart and measure movements.
Based on Gann, Wyckoff, Price Action and more concepts.
See previous posts for details.
---------------------------------------------------------------
* This is Pre-plan and an education post
That means my view can change, depending on how the price will arrive at the level and what will be happening on the M5 in my level of interest for entry. Then I will decide if I will enter or not. So please don't just blindly follow this. The FX market is a quickly changing environment and it requires full focus on the levels for the precise entry with low risk.
* DISCLAIMER
We are the only one person who is responsible for our health, relationships, success, and money in our lives. So taking a risk on the markets based on this idea is only and only your decision. You deserve the profit and you are responsible for your potential loss. Any opinions, news, research, analyses, prices, or other information discussed in this presentation or linked to from this presentation are provided as general market commentary and do not constitute investment advice. The author of the analysis does not accept liability for any loss or damage.
* Legal Risk Disclosure
Trading foreign exchange or CFD on margin carries a high level of risk, and may not be suitable for all investors. The high degree of leverage can work against you as well as for you. Before deciding to trade foreign exchange you should carefully consider your investment objectives, level of experience, and risk appetite. The possibility that you could sustain a loss of some or all of your initial investment and therefore you should not invest money that you cannot afford to lose. You should be aware of all the risks associated with foreign exchange trading, and seek advice from an independent financial advisor.

Gold trading idea, XAUUSD analysis with Sell zone updateSee previous posts for details.
---------------------------------------------------------------
* This is Pre-plan and an education post
That means my view can change, depending on how the price will arrive at the level and what will be happening on the M5 in my level of interest for entry. Then I will decide if I will enter or not. So please don't just blindly follow this. The FX market is a quickly changing environment and it requires full focus on the levels for the precise entry with low risk.
* DISCLAIMER
We are the only one person who is responsible for our health, relationships, success, and money in our lives. So taking a risk on the markets based on this idea is only and only your decision. You deserve the profit and you are responsible for your potential loss. Any opinions, news, research, analyses, prices, or other information discussed in this presentation or linked to from this presentation are provided as general market commentary and do not constitute investment advice. The author of the analysis does not accept liability for any loss or damage.
* Legal Risk Disclosure
Trading foreign exchange or CFD on margin carries a high level of risk, and may not be suitable for all investors. The high degree of leverage can work against you as well as for you. Before deciding to trade foreign exchange you should carefully consider your investment objectives, level of experience, and risk appetite. The possibility that you could sustain a loss of some or all of your initial investment and therefore you should not invest money that you cannot afford to lose. You should be aware of all the risks associated with foreign exchange trading, and seek advice from an independent financial advisor.

XAUUSD analysis, 1h chart updateDid you analysis Gold price today?
Here's a Wyckoff scenario for XAUUSD .
We have a distribution schematic in 1h time frame.
What is the potential gold price target?
We're using P&F chart & measure movements to projection.
Our analysis are also based on Wyckoff method, Gann trading, OrderFlow and price action.
So we have potential target at 1815.6 (for yesterday's entries).
Let's see price action there.
Today, we'd like to see price pullbacks around 1841 for entering new short entries.
Be aware:
The price can drop to the target always without pulling back.
Hope this post could help your gold analysis.
---------------------------------------------------------------
* This is Pre-plan and an education post
That means my view can change, depending on how the price will arrive at the level and what will be happening on the M5 in my level of interest for entry. Then I will decide if I will enter or not. So please don't just blindly follow this. The FX market is a quickly changing environment and it requires full focus on the levels for the precise entry with low risk.
* DISCLAIMER
We are the only one person who is responsible for our health, relationships, success, and money in our lives. So taking a risk on the markets based on this idea is only and only your decision. You deserve the profit and you are responsible for your potential loss. Any opinions, news, research, analyses, prices, or other information discussed in this presentation or linked to from this presentation are provided as general market commentary and do not constitute investment advice. The author of the analysis does not accept liability for any loss or damage.
* Legal Risk Disclosure
Trading foreign exchange or CFD on margin carries a high level of risk, and may not be suitable for all investors. The high degree of leverage can work against you as well as for you. Before deciding to trade foreign exchange you should carefully consider your investment objectives, level of experience, and risk appetite. The possibility that you could sustain a loss of some or all of your initial investment and therefore you should not invest money that you cannot afford to lose. You should be aware of all the risks associated with foreign exchange trading, and seek advice from an independent financial advisor.

Will Gold go downward to 1815 ? Wyckoff Point and Figure targetDid you analysis Gold price today?
Here's a Wyckoff scenario for XAUUSD.
We have a distribution schematic in 1h time frame.
What is the potential gold price target?
We're using P&F chart & measure movements to projection.
Our analysis are also based on Wyckoff method, Gann trading, OrderFlow and price action.
So we have potential target at 1815.6 (for yesterday's entries).
Let's see price action there.
Today, we'd like to see price pullbacks to LPSY for entering new short entries.
Be aware:
The price can drop to the target always without pulling back.
Hope this post could help your gold analysis.
---------------------------------------------------------------
* This is Pre-plan and an education post
That means my view can change, depending on how the price will arrive at the level and what will be happening on the M5 in my level of interest for entry. Then I will decide if I will enter or not. So please don't just blindly follow this. The FX market is a quickly changing environment and it requires full focus on the levels for the precise entry with low risk.
* DISCLAIMER
We are the only one person who is responsible for our health, relationships, success, and money in our lives. So taking a risk on the markets based on this idea is only and only your decision. You deserve the profit and you are responsible for your potential loss. Any opinions, news, research, analyses, prices, or other information discussed in this presentation or linked to from this presentation are provided as general market commentary and do not constitute investment advice. The author of the analysis does not accept liability for any loss or damage.
* Legal Risk Disclosure
Trading foreign exchange or CFD on margin carries a high level of risk, and may not be suitable for all investors. The high degree of leverage can work against you as well as for you. Before deciding to trade foreign exchange you should carefully consider your investment objectives, level of experience, and risk appetite. The possibility that you could sustain a loss of some or all of your initial investment and therefore you should not invest money that you cannot afford to lose. You should be aware of all the risks associated with foreign exchange trading, and seek advice from an independent financial advisor.

Nasdaq reversal targets the January lowWith the breakout today, the Nasdaq has confirmed a Wyckoff accumulation structure that started 19th May. The above chart provides my Wyckoff P&F targets, starting with the most conservative and getting successfully more aggressive. Note that the final higher target has not yet been taken. I will add this after the Wyckoff Backup event has occurred, which is a test of the breakout of the structure (bounded by the blue lines).
Not all targets need be met. At each, we need to be on the lookout for the price advance to pause and create a steppingstone structure. That could create a cause for a continued move up, or it may create a cause for a move down. We need to read the chart at each stage.
The most conservative target has been met, and price has already paused at it. I am not expecting much of a Backup, given current market conditions and the potential for more of a short squeeze. A small retracement on Friday and then rapid advance is more likely. A good entry would be on the reversal of this retracement.
I will update this post with my thoughts on the price advance. If you have found this useful please give a thumbs up and a follow to keep updated. Thanks!
DOW ANALISE
The state of affairs on the dow ts kamipanii were distributed relative to the indices on the principle of relative strength in this order
despite the fact that many sectors still do not show confident bullish growth, we already have some strong leaders, this company UNH is on the 2nd place, GS is on the 3rd place, HD is on the 4th place with you and me MSFT in 5th place we have the company AMGN
look at the relative strength indices that absolutely clearly show our leaders and outsiders
But who is the outsider at the moment , now the outsider of the company is the WBA and the relative strength index absolutely clearly shows the position of the shares to the market .
I always use this technical parameter together with the foundation parameters when analyzing the market
See you for new reviews !
Click like subscribe necessarily if the review came in! Then I will post more ideas .
My chat for learning and analysis Wyckoff Analytics search in chats and subscribe
Friends, I conduct training in an individual format and in a limited number of students, since a large number will interfere with my trading!
The training course includes :
The Wyckoff Method
Demark method
VSA
A trading method tailored to your psychotype
Psychology of trading
For details, write in a personal message
I can also introduce you to my own unique indicators , of my own design
Wykoff Zone ( You determine the activity and zones of smart money and also gives buy and sell signals )
The Demark indicator , which has no analogues on the platform - since most of the indicator are far from the essence of the Dymerka technique and are too simplified , which violates the basics of the principle
For investors, I can shift a 2-week lazy investor course where you can learn how to invest correctly and in which stocks + the tic-tac-toe method
supplemented
with your own developments taking into account the imbalance of supply and demand
The Wyckoff Line indicator was created based on the activity of professionals and the identification of liquidity zones to which the price is attracted.
Remember that the market is driven only by supply and demand. No technical indicators will tell you in advance that there has been an imbalance of supply or demand.
Listening to the news, you can lead yourself into a state of incorrect decision, so make decisions only on the activity zones of professionals. By understanding where the imbalance of supply and demand occurs, you can correctly build your work strategy.
The indicator has a smart algorithm that takes into account the activity zones on several timeframes that are above the working schedule.
The indicator also has a VSA system that determines the entry point in order to buy or sell a certain instrument. The entry point is determined by an imbalance of volume and price based on the principle of lack of demand, or lack of supply in liquid zones.
Take a look at "Figure 1", which clearly shows the test of the offer after which the price reached the next level of liquidity in WMT shares
The following example clearly shows a purchase after a downtrend, which, after passing through the liquidity zone, determined a clear signal to buy AAPL shares.
The essence of the indicator is that a high volume is always a liquidity zone to which the price will constantly strive. The indicator determines the liquidity zones of professionals that you set on higher timeframes using certain settings of the high volume bar. And together with the package of indicators, I provide a training video where I tell you how to use this indicator. And I also give some author's settings and recommendations for entering or exiting a position.
Now let's analyze the sell signal. Here is an example of one of the sell signals in which the indicator has clearly worked
The price reached the liquidity zone and he signaled three times that it was time to enter the position. Then, using completely different entry techniques, you could sell the KO stock or, if you were trending upwards and your techniques did not involve selling, you could simply exit your position in time.
The uniqueness of the indicator lies in the fact that it works on such a chart as tic-tac-toe. Having established liquidity zones, you can use the signal of this indicator to enter a position without any market noise. See the example below , where the entry into the MSFT promotion was carried out:
snapshot
To start using the indicator, you need to write to me in a personal message.
I will send you instructions for using the indicator and my recommendations (how to enter and exit the position) and the settings of the indicator.
During the entire use of the indicator, you can receive free support and advice from me by writing to me in private messages.
The ability to use the indicator in different languages: I will provide you with a video instruction for setting up and instructions for use in your native language.
Available languages for using the indicator: Russian, English, Chinese, Spanish, German.
The translation of the indicator settings into various languages is currently in progress.
The subscription price for the indicator is $20.
Buying an indicator for unlimited use is $300.

XAUUSD analysis today, will Gold reverse around 1851 ?Are you trading gold?
Here're estimate target of small Wyckoff distribution scheme (1m time frame)
So we have safe target at 1852.5. We're using P&F chart.
Let's see price action there demand and pressure zone below.
We measure movements to take profit and find new timing zones for next orders.
Hope this post could help you make better XAUUSD analysis.
Do you want to see more posts about Gold trading?
----------------------------------------------------------------------------------------------------------------------------------------------------------------------------------------------------------------------------------------
* This is Pre-plan and an education post
That means my view can change, depending on how the price will arrive at the level and what will be happening on the M5 in my level of interest for entry. Then I will decide if I will enter or not. So please don't just blindly follow this. The FX market is a quickly changing environment and it requires full focus on the levels for the precise entry with low risk.
* DISCLAIMER
We are the only one person who is responsible for our health, relationships, success, and money in our lives. So taking a risk on the markets based on this idea is only and only your decision. You deserve the profit and you are responsible for your potential loss. Any opinions, news, research, analyses, prices, or other information discussed in this presentation or linked to from this presentation are provided as general market commentary and do not constitute investment advice. The author of the analysis does not accept liability for any loss or damage.
* Legal Risk Disclosure
Trading foreign exchange or CFD on margin carries a high level of risk, and may not be suitable for all investors. The high degree of leverage can work against you as well as for you. Before deciding to trade foreign exchange you should carefully consider your investment objectives, level of experience, and risk appetite. The possibility that you could sustain a loss of some or all of your initial investment and therefore you should not invest money that you cannot afford to lose. You should be aware of all the risks associated with foreign exchange trading, and seek advice from an independent financial advisor.

Wyckoff Accumulation Schematic on BTCHi guys,
You can spot a clear schematic of accumulation behaviour on BTC market. you can find references about the very similar schematic on famous websites. BUT
BUT
there are signs of weakness in this pattern formed in BTC. first of all (but not least important), on ST points (Secondary test points), we have two exceptions:
1. We have more than 2 ST points, which is not a very bad sign by itself, but the problem is that we prefer to see low selling pressure or volume (or at least low price tails below recent supports (which neither are met in this pattern)
2. third ST point is totally unrelated to a swing. its a drop. with high momentum but with most of the volume at the very bottom. so we can't relate to that either.
there is an exception in SC too. we'd prefer to see a more clear SC. but Selling climax has built a zone instead of a valid clear support. that's why in higher timeframes we can't really spot a major low (to consider in our drawings)
Feel free to ask questions in Comment section below!

PG Hello friends! now let 's analyze the PG company my Wyckoff Line indicator, which you can access and which clearly defines the liquidity zone of professionals , as well as with which you can determine the liquidity zones and, accordingly, understand where the accumulation is .
Where is the distribution absolutely clearly and determined the repulsion from the liquidity zone at the very bottom
You can also see that I recently made a deal on the chart , this mark is marked with the mark b 1 ,
which also absolutely clearly indicated the purchase before the decline
On the right we see the relative strength index , which shows that at the moment the company is still in a negative moment relative to the market and it is not yet ripe for purchase at the moment and we must definitely wait until the price reaches the liquidity zone , after which we will already look at the relative strength index and certainly by sector
Thank you all
Click like subscribe necessarily if the review came in! Then I will post more ideas .
My chat of learning and analysis Wyckoff Analytics search in chats and subscribe
Friends, I conduct training in an individual format and in a limited number of students, since a large number will interfere with my trading!
The training course includes :
The Wyckoff Method
Demark method
VSA
A trading method tailored to your psychotype
Psychology of trading
For details, write in a personal message
I can also introduce you to my own unique indicators , of my own design
Wykoff Zone (You determine the activity and zones of smart money and also gives buy and sell signals )
is a Demark indicator that has no analogues on the platform - since most of the indicator are far from the essence of the Dymerka technique and are too simplified , which violates the basics of the principle
For investors, I can shift a 2-week lazy investor course where you can learn how to invest correctly and in which stocks + the tic-tac-toe method
supplemented
with your own developments taking into account the imbalance of supply and demand

BTC-USDT(Accumulation zone-Wyckoff Method)
Accumulation schematics by Wyckoff represents a primary model for accumulation(coin collection).it works to represent and examine the accumulation process.Besides,accumulation schematics also provide important phases to guide us through the trading position.
Phase A:
Indicates the pause of the downtrend(trading range).Till this point,supply remains dominat,which is witnessed in a decrease in coin prices for a short time accompanied by a heavy trading volume .You can see these events on price charts where heavy volumes are visible due to large tranfers of coins by the traders.here selling pressure also results in a slow downtend and an increased trading volume indicates the beginning of this phase.
Phase B:
this phase is based on Wyccoffs law cause and effect,as it is normally seen as a cause that results in an effect.The composite man gathers the highest volume of coins during phase B.During this stage,the market tests both support and resistance levels of trading range(TR).In simple terms,the price changes are wild and affected by higher volumes.Eventually,when the supply of coins is exhausted,the coin is ready to switch to phase C.
Phase C:
During face C, spring (shakeout)the price below the support level og the trading range quickly reverses and moves back into the trading range.You can consider spring as a period of the coin below the support zone to attract traders and investors.Its a final attempt to purchase the coin at the lowest rates before the rates rise again.its also notable that the bear trap attracts inexperienced investors to sell coins at low rates and wait the dump which evantually does not occur and price instead rise from that point without actually reaching that dumping point.In simple terms, spring (shakeout)is not always useful as trading volume remains unpredictable.
Phase D:
This phase is a transition between cause and effect,as its stands between phase C accumulation zone and the breakout of the trading range phase E.During phase D,an investor should keep the dominating demand over supply under consideration.During this phase ,the price rises to the top of trading range,you should strictly follow the potential dominance of demand over supply,the price normally moves to the top of the trading range and last point support provides excellant platforms for making a hefty profit.However,it is also notable that there can be more than one point where a downtrend is excpected to be paused due to an increased buying demand(last point support)phase D.
Phase E:
Is the final stage in which the coin leaves the trading range and demand comes in action.You can observe some typical reactions during these phases,such as most investors temporarily quitting their coins.

Short-Term NASDAQ P&F Targets 4-11% DownThe above chart is a summary of my short-term P&F targets for $NQ. These targets are actually clusters of targets taken from recent distributional patterns that are visible on the 5 minute P&F chart, shown below (click to expand):
The Point & Figure chart spans just over a week, from May 15th. Being volatility adjusted, a P&F chart captures trading range structures better than regular bar charts. We can also use them to forecast possible price targets. A P&F target is where price could go before pausing in another trading range, based on the Wyckoff principle of effort and result.
You can see that on the P&F chart, I have drawn four trading ranges bounded by blue lines. From left to right, we see two re-distributional structures, one small accumulation, and the most recent prospective distribution. I'm calling this prospective because there's still a chance that the current decline could become a spring within an accumulation. We need to bear this in mind and keep our options open, but given the bearish background and what I'm seeing so far, I'd put it 70/30 in favor of distribution.
Using the Wyckoff P&F counting technique, I have projected several price targets from each structure. There are conservative targets and more aggressive targets for each (follow the arrows down from the count lines to the shaded target areas). As shown by the blue balloons, the most conservative targets for the first two distributions each projected the price level for the subsequent trading range pretty well.
It is good to keep a note of the more aggressive targets as these can be hit later on. The chart sows that multiple targets have clustered around two price areas, 10,950-11,310, and 10,455-10,770. These confirmatory counts give increased credibility to the target clusters.
Assuming the most recent trading range is distribution, then the most conservative count targets 11,670. Commonly, in a distribution, this is where we can get a Major Sign of Weakness (MSOW) - an intermediate reaction before price collapses faster (Wyckoff Phase E). We could get a MSOW at 11,670. Or, a new trading range could form and may even be an accumulation. We will just need to read the chart as price unfolds. However, given the bearish background and lower P&F target zones that are yet to be reached, I'm betting on more weakness ahead and am short the NASDAQ via puts on QQQ.
I'll add more analysis as the story unfolds - please remember to like and subscribe!
Good luck out there!

Potential Accumulation FormingGold - Potential accumulation forming, i want to see another SOS/candle close above before a pullback into the TR then i'll look to take this long!
Let me know your thoughts!
* Disclaimer **
These ideas I never trade until the end target with my initial lots, I focused on high probable entries with higher lots and use a specific partial taking strategy giving me a very high win rate and take most of my profits very early, I only leave a small % of my capital to run the entire trade. On the flip side im constantly monitoring LTF momentum and will close early if things change, these analysis's are for research purposes only.

VIEW Looking good to short in the ... Short ViewWhether this is a level 2 Wyckoff Method with a further rise to Level 3 ($1.30 range) or an M top formation, a retrace is do after it's insane 40% rise these past few days.
VShort
