ICP USDT LONG SIGNAL---
📢 Official Trade Signal – ICP/USDT
📈 Position Type: LONG
💰 Entry Price: 3.419
---
🎯 Take-Profit Targets (Partial Exits):
• TP1: 3.472
• TP2: 3.541
• TP3: 3.596
• TP4: 3.660
• TP5: 3.743
• TP6: —3.828
---
🛑 Stop-Loss: 3.300
📊 Timeframe: 15m
⚖️ Risk/Reward Ratio: ≈ 2.03 (based on TP4)
💥 Suggested Leverage: 5× – 10×
---
🧠 Technical Analysis Summary
ICP is showing signs of bullish momentum after finding support near the 3.419 level. The market structure on the 15-minute chart indicates a potential upward shift, with price action forming higher lows and testing key resistance zones. The identified take-profit levels align with previous swing highs and liquidity concentrations.
The critical upside targets are:
3.472 → 3.541 → 3.596 → 3.660
A confirmed break above TP1 (3.472) is expected to accelerate momentum toward the subsequent targets, particularly if accompanied by increasing buying volume.
---
⚙️ Trade Management Rules
✔ Take partial profit at each TP level
✔ Move stop-loss to entry point once TP1 is reached
✔ Trail stop-loss upward as price advances
✔ No re-entry if stop-loss (3.300) is triggered
✔ Confirm bullish structure and momentum before entering
---
📌 TradingView Hashtags
#ICPUSDT #ICP #CryptoSignal #LongSetup
#TradingView #FuturesTrading #TechnicalAnalysis
---
Disclaimer: Always practice proper risk management and verify market conditions before entering any trade.
X-indicator

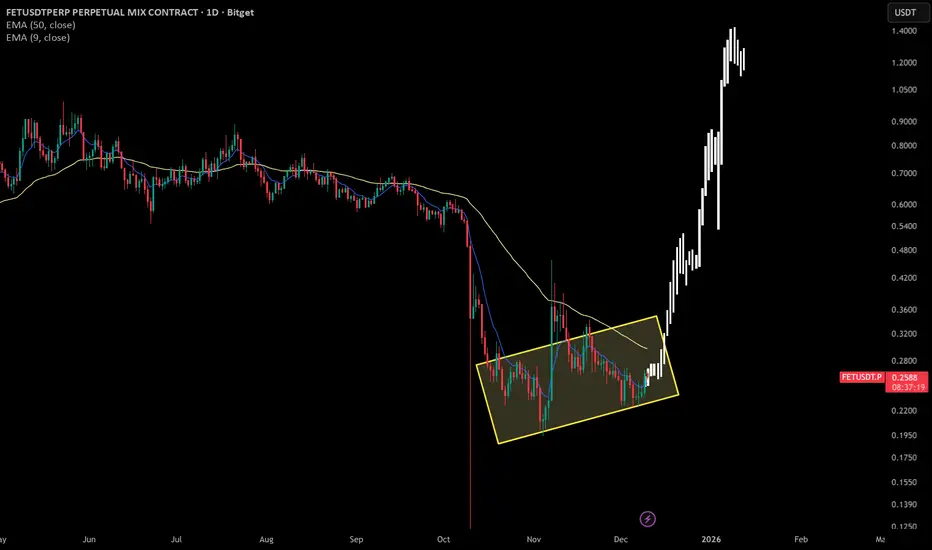
$FET bullish setupey traders,
I’m feeling pumped today and bringing you the second analysis of the day. The last time I talked about NYSE:FET I was wrong and the price dropped sharply. This time, backed by my previous analysis on Ethereum dominance, I believe Fetch could perform quite well over the coming months.
Leaving behind the legal issues with Ocean Protocol, it seems the project is about to regain momentum. It has been forming higher lows over the past few weeks, and I’ve noticed some very interesting on-chain accumulation.
Because of that, I think it may enter a small rally in the next few months:
1st target → $0.50
2nd target → $0.80
3rd target → $1.00
As I always say — stay smart and stay calm!
ZEC USDT SHORT SIGNAL---
📢 Official Trade Signal – ZEC/USDT
📉 Position Type: SHORT
💰 Entry Price: 442.33
---
🎯 Take-Profit Targets (Partial Exits):
• TP1: 428.46
• TP2: 415.37
• TP3: 407.28
• TP4: 398.00
---
🛑 Stop-Loss: 454.46
📊 Timeframe: 15m
⚖️ Risk/Reward Ratio: ≈ 3.65 (based on TP4)
💥 Suggested Leverage: 5× – 10×
---
🧠 Technical Analysis Summary
ZEC is exhibiting bearish momentum following a rejection from a key resistance area. The market structure on the 15-minute chart suggests a shift downward, with lower highs indicating increasing selling pressure. The identified take-profit levels align with projected liquidity zones and previous support areas.
The critical downside targets are:
428.46 → 415.37 → 407.28 → 398.00
A sustained break below TP1 (428.46) is expected to accelerate the move toward the subsequent targets.
---
⚙️ Trade Management Rules
✔ Take partial profits at each TP level
✔ Move stop-loss to entry point once TP1 is hit
✔ Trail stop-loss downward as price moves in your favor
✔ Do not re-enter if stop-loss (454.46) is triggered
✔ Confirm bearish structure on the chart before entering
---
📌 TradingView Hashtags
#ZECUSDT #ZEC #CryptoSignal #ShortTrade
#TradingView #FuturesTrading #TechnicalAnalysis
---
Let me know if you need any adjustments or a Persian version.

Aptos (APT): Entering The Local Lows | Looking For BounceAPT kept breaking lows step by step and finally tapped the main local low. This is the first place where buyers can try to build something, but we don’t have any real shift yet — just a reaction from the zone.
What we need now is a clean break of structure to confirm the reversal attempt. Until that BOS comes, this is only a bounce from support, but the area itself is strong enough to watch for the early signs of buyers stepping back in.
Swallow Academy

ULTIMA keep moving forward while the market is struggling Over the past month, markets have been in far from the best condition, to put it mildly. But even in such periods, there are tokens that continue to perform. I’ve been following ULTIMA for a long time, and this token always shows its strength during tough market phases.
📈 This recurring pattern many times over leads to the idea that large players are likely reallocating capital into ULTIMA during such periods. This theory is supported by the fact that ULTIMA’s price moves are always large and fast. In just the last two weeks, the token has gained more than 100% in price!
And this is not a one-time pump and dump — it’s a consistent pattern that has been working for many years.
✅ At the moment, the price has consolidated above the key level at $5,746. Holding this level opens the path to a quick move to $7,539, where the next major support level is located.
✅ The price has also broken the descending resistance, marking the end of the bearish trend and a transition into a growth phase.
✅ The Supply and Demand indicator shows that at these levels, large demand zones are forming in the price, which now significantly exceed supply. This means there are almost no sellers left at current prices.
✅ Also, a halving is planned soon in ULTIMA, which will only increase the value of each coin.
✅ And let me remind you that after its peak, the price dropped significantly, likely due to selling by large players. As a result, there are no major resistance zones or order blocks above — instead, there are large gaps, which, if the price reaches them, will be very easy to close.

BTC Is Retesting the Breakout📊 (1) MARKET STRUCTURE
-BTC formed a strong bullish impulse from the Strong Support Zone, breaking above the descending trendline with a powerful breakout candle.
-This shifted the market structure from bearish → bullish on H1.
📉 (2) PRICE REACTION
After breaking out:
-Price tapped the Weak Support Zone (highlighted purple area)
-Buyers stepped in immediately — confirming support
-Price is now pulling back again into the same demand area
This shows bullish willingness to defend the zone.
📐 (3) HTF CONTEXT
This breakout aligns with broader bullish sentiment:
-BTC continues to create higher swing lows on H1.
-As long as price holds above the Weak Support Zone, the trend remains bullish.
🎯 (4) EXPECTATION
The most likely scenario:
📌 BTC dips into the Weak Support Zone → forms a higher low → rallies toward 94,000 – 95,200.
💥 (5) TRADING SIGNAL
BUY SETUP
Entry Zone:
92,200 – 92,600 (Weak Support Retest Zone)
Stop Loss:
Below 91,700
Take Profit Levels:
TP1: 93,171
TP2: 93,596
TP3: 94,091
Final Target: 95,200
Why this setup works
Strong breakout with volume
Clean retest into fresh demand
Higher-timeframe bullish structure
Buyers showing presence at every dip
This is a low-risk pullback entry inside a bullish continuation setup.

GOLD IDEA TIME RATE 4H🔹 MARKET BRIEFING – XAU/USD (4H)
Market State:
– Price is compressing inside a symmetrical triangle, respecting both the rising support line and the descending upper boundary, showing balanced but tightening momentum.
Key Levels:
– Triangle Support: ~4185–4195
– Triangle Resistance: ~4250–4260
– Liquidity Zone Below: 4128 – 4135
Next Move:
– A breakout above the triangle resistance could trigger a bullish continuation leg toward higher highs.
– If price rejects at the upper boundary and breaks below the rising trendline, liquidity at 4128–4135 becomes the next downside magnet.

USDCAD corrective pullback, support retest?The USDCAD remains in a bullish trend, with recent price action showing signs of a corrective pullback within the broader uptrend.
Support Zone: 1.3797 – a key level from previous consolidation. Price is currently testing or approaching this level.
A bullish rebound from 1.3797 would confirm ongoing upside momentum, with potential targets at:
1.3923 – initial resistance
1.3950 – psychological and structural level
1.3980 – extended resistance on the longer-term chart
Bearish Scenario:
A confirmed break and daily close below 1.3797 would weaken the bullish outlook and suggest deeper downside risk toward:
1.3774 – minor support
1.3750 – stronger support and potential demand zone
Outlook:
Bullish bias remains intact while the USDCAD holds above 1.3797. A sustained break below this level could shift momentum to the downside in the short term.
This communication is for informational purposes only and should not be viewed as any form of recommendation as to a particular course of action or as investment advice. It is not intended as an offer or solicitation for the purchase or sale of any financial instrument or as an official confirmation of any transaction. Opinions, estimates and assumptions expressed herein are made as of the date of this communication and are subject to change without notice. This communication has been prepared based upon information, including market prices, data and other information, believed to be reliable; however, Trade Nation does not warrant its completeness or accuracy. All market prices and market data contained in or attached to this communication are indicative and subject to change without notice.

The Breakout Is Closer Than You Think…NZD/USD – 1H MARKET STRUCTURE ANALYSIS
1) Current Price Structure
- Market is in a clean uptrend (higher highs & higher lows on the left side of chart).
- After the impulsive bullish leg, price has shifted into a sideways range, forming a clear consolidation between Support and Resistance.
- Micro-structure inside the range shows repeated equal highs & equal lows → compression before expansion.
2) Liquidity & Key Zones
- Resistance Zone (Top of Range): 0.5785 – 0.5805
- Multiple rejections → liquidity resting above (buy stops & breakout traps).
- Support Zone (Bottom of Range): 0.5750 – 0.5765
Consistently defended by buyers → liquidity sitting below (sell stops).
Liquidity Note:
Expect a sweep of support (fake break) before a bullish continuation — classic smart money behavior in a bullish market.
3) Today’s Market Scenario
Main Scenario (Bullish Bias – Preferred):
- Price retests the support zone
- Likely performs a liquidity sweep below the zone
- Sharp bullish rejection
- Price rotates back to resistance
- Breaks out → continuation with uptrend alignment
This matches your projected red zig-zag + final bullish impulse.
Alternative Scenario (Low Probability):
- Clear candle close below 0.5740 with no recovery → shift to bearish intraday bias.
4) Market Psychology
- The market is "resting" after a strong push → accumulation psychology.
- Smart money wants liquidity → they will likely sweep below the support to fill buy orders.
- Retail traders try to sell the range highs and buy the lows, but SM often collects their stops before moving to the real direction.
Key idea:
Range = where weak hands lose money.
Breakout = where strong hands take profits
5) Intraday Strategy (Entry – SL – TP)
BUY Setup (Aligned With Your Chart):
Entry: 0.5755 – 0.5765
Stop Loss: 0.5740 (below liquidity pocket)
TP1: 0.5795
TP2: 0.5820
TP3 (Extended): 0.5840+
Trade Management:
If price sweeps support and closes back above → BUY confirmation.
If price closes below → invalidate bullish setup and reassess.

sol usdt long signal---
📢 Official Trade Signal – SOL/USDT
📈 Position Type: LONG
💰 Entry Price: 137.92
---
🎯 Take-Profit Targets (Partial Exits):
• TP1: 139.80
• TP2: 141.72
• TP3: 144.00
• TP4: 145.98
• TP5: —
• TP6: —
---
🛑 Stop-Loss: 131.15
📊 Timeframe: 15m
⚖️ Risk/Reward Ratio: ≈ 1.19 (based on TP4)
💥 Suggested Leverage: 5× – 10×
---
🧠 Technical Analysis Summary
SOL shows potential bullish momentum after testing a key support zone around 137–138.
Market structure on the 15m chart indicates a possible shift upward if resistance near 140 is broken.
Buying pressure may increase upon confirmation of higher lows and a clear break above local resistance.
The critical upside targets:
139.80 → 141.72 → 144.00 → 145.98
A sustained move above 139.80 (TP1) could accelerate momentum toward higher liquidity zones near 144 and 146.
---
⚙️ Trade Management Rules
✔ Partial profit at each TP level
✔ Move SL to entry (break-even) once TP1 is hit
✔ Trail SL as price advances toward higher targets
✔ No re-entry if SL (131.15) is triggered
✔ Confirm bullish structure before entering
---
📌 TradingView Hashtags
#SOLUSDT #SOL #CryptoSignal #LongSetup
#TradingView #FuturesTrading #TechnicalAnalysis
---
Let me know if you'd like this translated to Persian or adjusted for a different platform.

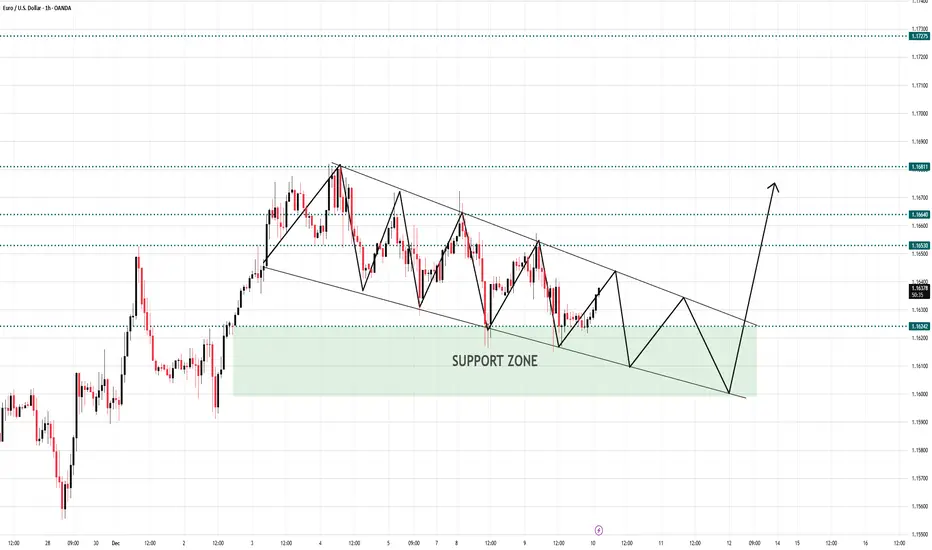
EURUSD Is Compressing in a Falling Channel 📊 MARKET STRUCTURE BREAKDOWN (H1)
1️⃣ Bullish Impulse → Start of Correction
Price created a strong upward leg, setting the tone for a bullish environment.
Right after that, EU shifted into a controlled descending channel a normal corrective phase.
2️⃣ Falling Channel Structure
Inside the channel:
-Clear LH → LL sequences
-Repeated taps on both channel boundaries
-Each push into the Support Zone shows strong buying reaction (long wicks, V-bounces)
This shows buyers defending the zone, not sellers taking control.
3️⃣ Current Position
-Price is moving in the mid-to-lower part of the channel, heading back toward the Support Zone
-This aligns with how price has been behaving for the past several days — liquidity sweep → bounce → move toward upper channel.
The projection you drew is absolutely logical:
A final sweep deep into the Support Zone before a bullish breakout.
🎯 TRADING SIGNAL
Entry Zone:
1.1595 – 1.1620 (deep in Support Zone + channel bottom)
Stop Loss:
Below structure: 1.1560
Take Profit Levels:
TP1: 1.1653
TP2: 1.1664
TP3 (major breakout): 1.1688
Why this setup works
The falling channel is corrective, not bearish.
Strong reaction every time price tests Support Zone.
Liquidity tends to build below the channel → ideal environment for a sweep + expansion.
The highest probability scenario:
Final sweep down → bullish reversal → breakout toward 1.1688.
📈 SHORT SUMMARY
EU is correcting inside a falling channel, but buyers remain in control at the Support Zone.
Expect one more liquidity sweep before a strong upward breakout.
Road to 0.83After a period of sideways consolidation, PIPPINUSDT has broken out from its short‑term accumulation range and is now attempting to establish a new higher low above the mid‑support zone around 0.1930.
From a classical technical perspective, this move shows the early phase of a potential impulsive recovery pattern. As long as price holds above the red support area, the breakout remains valid.
Key technical notes:
Support: 0.1930 – Previous resistance turned support
Interim Resistance: 0.3480 – Fib projection / top of the latest swing
Final Target: 0.8300 – Long‑term structural target based on full swing‑extension
Invalidation: A daily close back below 0.1850
The overall structure hints at the formation of a new wave‑sequence (A–B–C type), with buyers attempting to build strength for the next expansion leg.
Trading Plan (Conceptual Only):
If the structure continues respecting higher lows, the setup favors further accumulation toward 0.35–0.40, followed by an extension into the 0.83 major target zone.

Gold Just Flipped Structure.....The market just transitioned from a bearish sequence into early bullish structure. Most traders will miss this shift but if you understand BOS, ChoCH, and liquidity behaviour, this is where smart money prepares for the next leg up.
1. Market Structure Overview
Your chart shows a full bearish sequence (LH–LL) that has recently transitioned:
-Multiple Lower Highs (LH) and Lower Lows (LL) → clear bearish structure.
-A Change of Character (ChoCH) occurs at the key zone → first signal of reversal.
-A clean Break of Structure (BOS) to the upside confirms buyers stepping in.
-Price then creates a Higher Low (HL) followed by Higher Highs (HH) → early bullish trend established.
This is a textbook reversal from bearish → bullish.
2. Key Zones Identified
Support Zone (Demand)
Located around 4195 – 4174
→ This is where the ChoCH and HL formed, confirming buyer strength.
Resistance Zone (Supply)
Located around 4219 – 4229
→ Price is currently approaching this zone. If it breaks, bullish continuation is expected.
3. Price Behaviour & Expectation
Your yellow projection is correct:
- Price may pull back into the minor support (near current level).
- After that, a bullish leg toward 4219 zone is expected.
- If BOS occurs above 4229, price has room to expand toward new highs around 4238–4244.
This aligns perfectly with the HH → HL structure forming now.
4. Trading Logic
Why bullish?
- Clear BOS on bullish side
- Higher Low forming above support
- Liquidity taken from previous LL
- Price respecting the new bullish structure
Invalidation
If price breaks below 4174, bullish structure is invalidated.
5. Trade Signal
This follows your trading style — structure-based, clean, and logical.
📌 BUY ENTRY: 4203 – 4207
(Retesting minor support + inside new bullish structure)
📌 STOP LOSS: 4178
(Below HL and below ChoCH zone — strong invalidation)
📌 TAKE PROFIT 1: 4219
(Retest of resistance zone)
📌 TAKE PROFIT 2 (Main Target): 4229 – 4233
📌 TAKE PROFIT 3 (Extended Target): 4242 – 4244
Risk–Reward:
1 : 2.5 up to 1 : 4 depending on TP

Bitcoin Is Quietly Re-Accumulating...........📊 (1) MARKET STRUCTURE
Bitcoin on H4 is forming a clean ascending channel, characterized by:
-Higher Lows
-Higher Highs
-Consistent reactions from both channel boundaries
-Smooth oscillation inside a rising structure
This confirms a sustained bullish cycle of accumulation → expansion → retracement → continuation.
The latest swing low touches the lower boundary of the channel and reacts sharply upward a typical sign of demand reactivation.
📉 (2) PRICE REACTION
Recent candles present:
-Strong rejection wicks at the channel’s demand zone
-Reduced bearish momentum after each corrective leg
-Higher swing bottoms forming in rhythm
These behaviors indicate that sellers are being absorbed while buyers patiently step in.
The projected yellow legs show the market’s tendency to respect the channel perfectly —
a bullish pattern repeating multiple times.
🌐 (3) MACRO & FUNDAMENTALS SUPPORTING THE UPTREND
The macro environment is aligning strongly in favor of Bitcoin:
✔ Fed Rate-Cut Expectations 2024–2025
Recent FOMC signals show a shift toward a softer monetary policy cycle.
Lower interest rates historically weaken the USD and strengthen risk-on assets like BTC.
✔ ETF Inflows Remain Positive
Institutional capital continues flowing into Bitcoin ETFs, showing long-term confidence.
Accumulation from large funds typically stabilizes price and reduces downside risk.
✔ Global Liquidity Expansion
Central banks across APAC and Europe lean toward easing.
Liquidity expansion fuels upward momentum in major crypto assets.
✔ Halving Cycle Psychology
Post-halving periods statistically favor medium-term uptrends as supply tightens.
All macro signals point toward a favorable environment for a continuation move upward.
⏳ (4) HTF CONTEXT
On the higher timeframe, the structure reflects:
-Bitcoin has already printed a major bottom
-Uptrend is intact even with local corrections
-Market is transitioning from Accumulation → Markup phase
Compression inside the rising channel usually leads to a strong breakout above 97,000–100,000.
📐 (5) EXPECTATION
High-probability scenario:
-BTC continues oscillating inside the ascending channel
-Creates 2–3 more Higher Lows as drawn
-Approaches the upper boundary at 96,500–97,000
-Breakout triggers momentum toward 100,000+
This behavior aligns with both structural patterns and macro tailwinds.
🎯 (6) TRADING INSIGHT
The market is in the strongest type of bullish structure:
a rising channel supported by macro liquidity, ETF demand, and post-halving momentum.
The path of least resistance remains upward.

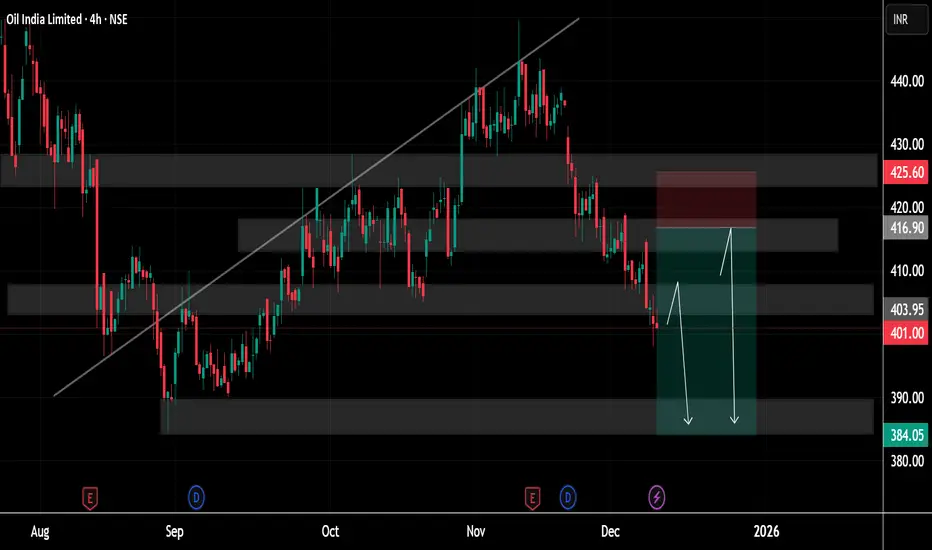
Crude Oil Price Update – Clean & Clear ExplanationCrude Oil highlighting how the market has shifted from a previously rising trend into a phase of weakness. Earlier, the price followed an upward sloping trendline, reflecting steady buying strength, but eventually the price broke below that trendline, signalling the start of a broader correction. Since then, the chart has formed a series of lower highs and lower lows, showing the transition from bullish momentum to a more bearish structure.
Several supply and demand zones are clearly marked on the chart with shaded regions. These zones help identify where buying or selling pressure is strongest. The upper zone near 425–430 represents a major supply area where sellers have previously stepped in and pushed the price down multiple times. Just below it, the 416–420 region shows another resistance area that reinforces the overhead selling pressure.
On the downside, the price is currently trading around the 401 level, where it is testing a mid-level demand zone. The chart shows projected arrows indicating the possibility of the price dipping deeper into the broader demand area around 384–390. This zone has historically acted as a strong support, where buyers could attempt to defend the price again.
The highlighted risk-to-reward box suggests a potential short setup, where traders might expect further downside movement until the price reaches the lower support zone. However, there is also a secondary upward arrow indicating that if the price finds strong support, it may bounce back toward the mid-range resistance near 416, before facing sellers again.
Overall, the chart represents a long-term picture of price correction inside a well-defined supply and demand structure, where the market is currently showing bearish momentum but may find stability and buyers closer to the lower demand zones. The structure reflects how the market is balancing between downward pressure and potential reversal zones, giving a clear roadmap of key levels for future movement.
If you find it helpful please like and comments for this post and share thanks.
NSDQ100 wait-and-see mode ahead of tonight’s FOMCMarkets remained in wait-and-see mode ahead of tonight’s FOMC decision, keeping equity moves muted. The S&P 500 slipped -0.09%, with futures flat this morning, signalling no strong pre-Fed risk appetite for US equities, including tech.
Key Macro Drivers for NDX
US 10yr yields rose +2.4bps to a 3-month high, continuing the global bond selloff.
Higher yields remain a headwind for long-duration tech stocks, keeping upside in the NASDAQ capped.
Australia’s 10yr yield hit a late-2023 high, confirming that the global tightening in bond markets is still broad-based.
Elsewhere, Franco-German spreads tightened, offering limited relief for global risk sentiment.
Fed in Focus
Markets are pricing a ~90% probability of a 25bp Fed rate cut tonight, which would be the third consecutive cut since September.
Since the last meeting, unemployment has risen to 4.4%, reinforcing the case for near-term easing.
However, inflation concerns are creating deep policy divisions, meaning forward guidance for 2025 is likely to remain intentionally vague.
Powell is unlikely to clearly signal additional cuts, especially with succession uncertainty growing as Kevin Hassett is seen as a leading candidate to replace him.
Implications for NASDAQ 100
Near-term direction hinges on Powell’s tone, not the cut itself.
Dovish guidance → NDX upside via yields pullback.
Cautious / inflation-focused tone → further yield pressure and likely NDX consolidation or downside.
Until the press conference, NDX is likely to remain range-bound with headline-driven volatility tonight.
This communication is for informational purposes only and should not be viewed as any form of recommendation as to a particular course of action or as investment advice. It is not intended as an offer or solicitation for the purchase or sale of any financial instrument or as an official confirmation of any transaction. Opinions, estimates and assumptions expressed herein are made as of the date of this communication and are subject to change without notice. This communication has been prepared based upon information, including market prices, data and other information, believed to be reliable; however, Trade Nation does not warrant its completeness or accuracy. All market prices and market data contained in or attached to this communication are indicative and subject to change without notice.

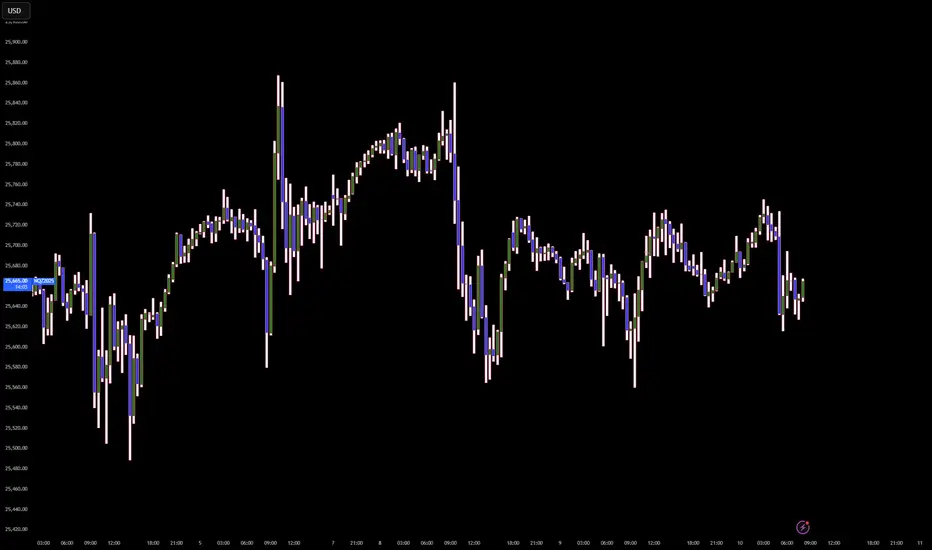
Algo's Logic: Why price moves ''crazy'' with red folder news?WHY PRICE MOVES LIKE THIS
The market is not a chaotic auction of buyers and sellers seeking fair value; it is a highly engineered delivery system designed to seek and destroy liquidity. The current consolidation you see is not indecision; it is a 'Liquidity Coil'. The algorithm is purposefully compressing price action ahead of the 'Red Folder' events to engineer a 'Straddle Inducement'.
By keeping the range tight, the Interbank Price Delivery Algorithm (IPDA) encourages retail traders to place tight buy-stops above the range and tight sell-stops below it. This creates two massive pools of liquidity—fuel for the machine. The news event is not the cause of the move; it is the 'Key' that unlocks this volatility. The initial move is almost always a 'Judas Swing'—a fraudulent manipulation designed to trigger one side of these stops (usually the sell-stops below) to harvest the necessary liquidity to fuel the *real* move in the opposite direction. We do not trade the news; we trade the algorithmic reaction to the liquidity harvest.
THE THESIS
The algorithm is currently in a 'Suspended State' of pre-event accumulation utilizing the impending volatility of the Macro Data Injection to engineer a classic 'Judas Swing' manipulation. The narrative is strictly governed by the 'Seek and Destroy' protocol: The market will utilize the news release to aggressively harvest the internal Sell-Side Liquidity (SSL) resting below the 25,550.00 shelf to fuel the terminal expansion towards the external Buy-Side Liquidity (BSL) at 25,900.00.
THE EXECUTION VECTOR
Entry: 25,525.00 (Buy Limit / Post-News Reclaim)
Stop loss: 25,380.00 (145.00 points)
Take profit: 25,950.00 (425.00 points)
Risk to reward ratio: 2.93R
THE CAUSAL RATIONALE
The Pre-News Narrative (The Trap)
Current price action (25,650.00) is a 'Volatility Compression' zone. The algorithm is holding price in a narrow range. Do not trade the drift. The drift is the bait. The algorithm is waiting for the 08:30 AM / 10:00 AM timestamp to unlock the high-velocity engine. The 'Red Folders' are simply the authorized time windows for the Market Makers to reprice the asset.
The News Event (The Judas Swing)
Upon the data release, expect an immediate, violent displacement. The highest probability vector is a 'False Bearish Breakout' (The Judas Goat). The algorithm will likely spike price DOWN into the 25,550.00 - 25,500.00 region. This serves two purposes:
1. Trigger the sell-stops of the overnight longs.
2. Induce breakout sellers to provide the necessary Buy-Side liquidity for the Smart Money to fill their long orders at a discount.
The Post-News Expansion (The Real Move)
Once the SSL is harvested and the 25,500.00 region (Bullish Order Block / FVG) is mitigated, look for an impulsive reclaim of the 25,600.00 level. This 'Sponsorship' signal confirms that the low is in, and the algorithm will switch to a 'Low Resistance Liquidity Run' targeting the clean highs at 25,900.00.
THE INVALIDATION (THE OMEGA POINT)
The bullish news model is ontologically corrupted if the news candle displaces below 25,380.00 and *sustains* acceptance there (15-minute close). A simple wick is not invalidation; it is a feature. But a closure below this level implies the macro data has triggered a 'Risk-Off' regime shift, targeting deeper discount arrays at 25,000.00.
KEY TRAJECTORY WAYPOINTS
Target 1: 25,750.00 | Type: Equilibrium / Initial Rebound | Probability: 90%
Target 2: 25,900.00 | Type: External Buy-Side Liquidity | Probability: 75%
Target 3: 26,100.00 | Type: Blue Sky Expansion | Probability: 40%
THE SHADOW REALITY
A 30% probability exists for the 'Bull Trap' scenario. In this reality, the news spikes price UP first into 25,850.00. If the first move is UP, fade it. The algorithm rarely gives the true move first during high-impact news.
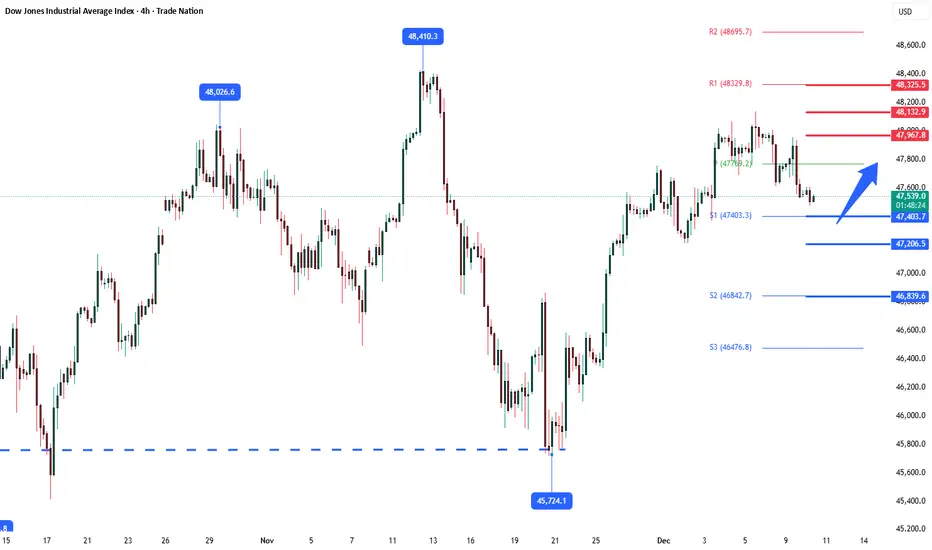
DowJones key trading levels ahead of FOMC rate decision Key Support and Resistance Levels
Resistance Level 1: 47967
Resistance Level 2: 48132
Resistance Level 3: 48325
Support Level 1: 47400
Support Level 2: 47200
Support Level 3: 46840
This communication is for informational purposes only and should not be viewed as any form of recommendation as to a particular course of action or as investment advice. It is not intended as an offer or solicitation for the purchase or sale of any financial instrument or as an official confirmation of any transaction. Opinions, estimates and assumptions expressed herein are made as of the date of this communication and are subject to change without notice. This communication has been prepared based upon information, including market prices, data and other information, believed to be reliable; however, Trade Nation does not warrant its completeness or accuracy. All market prices and market data contained in or attached to this communication are indicative and subject to change without notice.
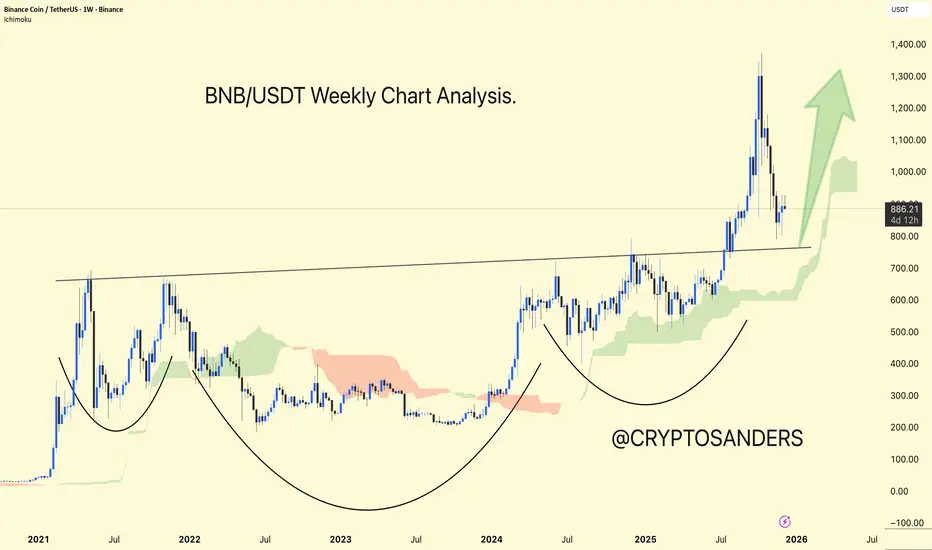
BNB/USDT Weekly Chart Analysis.BNB/USDT is trading in the range of 800 to 900 and remains within a larger bullish structure, but on higher timeframes, the price is still below a significant resistance band in the 1,160–1,180 zone.
Recent technical analysis indicates that BNB is trading above its key moving averages, with most indicators in "buy" territory, confirming the ongoing uptrend. However, some readings are approaching overbought levels.
On the chart, significant resistance is shown near 1,160–1,180 (the upper wedge boundary), while support is initially found around 1,095–1,100 and then at 1,050–1,020 if the wedge base is broken.
DYOR | NFA,
Breaking: Uranium Energy Corp. (UEC) Reports Earnings Today Uranium Energy Corp. (UEC) Reports Earnings today before market open . Uranium Energy Corp Reports Results for First Quarter of Fiscal 2026 and here is the highlight;
Maintained Low-Cost Production Profile: Achieved Total Cost per Pound(1) of $34.35, including Cash Cost per Pound(1) of $29.90 and Non-Cash Cost per Pound(1) of $4.45, based on production of 68,612 pounds of precipitated uranium and dried and drummed U3O8 (uranium concentrate) for the quarter.
Irigaray Plant Upgrades Completed: A full refurbishment of the yellowcake thickener and calciner to support 24/7 operations was finalized at the Irigaray Central Processing Plant ("CPP"). Drying and drumming operations have resumed, and approximately 49,000 pounds U3O8 were packaged between November 13-30, 2025.
Adding a Second Powder River Basin Satellite at Ludeman: Development decision made to advance the fully permitted Ludeman in-situ recovery ("ISR") Project's first planned wellfield. Engineering of the satellite ion-exchange ("IX") plant is progressing, and procurement of IX vessels is underway.
Technically, the stock is in a bullish flag pattern, increased momentum could lead to a move to the $20 resistant amidst bullish sentiment.
Analyst Summary
According to 5 analysts, the average rating for UEC stock is "Strong Buy." The 12-month stock price target is $15.8, which is an increase of 13.18% from the latest price.
About UEC
Uranium Energy Corp., together with its subsidiaries, engages in exploration, pre-extraction, extraction, and processing of uranium and titanium concentrates properties in the United States, Canada, and the Republic of Paraguay. The company was formerly known as Carlin Gold Inc. and changed its name to Uranium Energy Corp. in January 2005.

Brent Crude downtrend continuation The Brent Crude continues to display a bearish outlook, in line with the prevailing downward trend. Recent price action suggests a corrective pullback, potentially setting up for another move lower if resistance holds.
Key Level: 6417
This zone, previously a consolidation area, now acts as a significant resistance level.
Bearish Scenario (rejection at 6417):
A failed test and rejection at 6417 would likely resume the bearish momentum.
Downside targets include:
6235 – Initial support
6177 – Intermediate support
6120 – Longer-term support level
Bullish Scenario (breakout above 6417):
A confirmed breakout and daily close above 6417 would invalidate the bearish setup.
In that case, potential upside resistance levels are:
6464 – First resistance
6530 – Further upside target
Conclusion
Brent Crude remains under bearish pressure, with the 6417 level acting as a key inflection point. As long as price remains below this level, the bias favours further downside. Traders should watch for price confirmation around that level to assess the next move.
This communication is for informational purposes only and should not be viewed as any form of recommendation as to a particular course of action or as investment advice. It is not intended as an offer or solicitation for the purchase or sale of any financial instrument or as an official confirmation of any transaction. Opinions, estimates and assumptions expressed herein are made as of the date of this communication and are subject to change without notice. This communication has been prepared based upon information, including market prices, data and other information, believed to be reliable; however, Trade Nation does not warrant its completeness or accuracy. All market prices and market data contained in or attached to this communication are indicative and subject to change without notice.

WTI Crude bearish below 5980The WTI Crude continues to display a bearish outlook, in line with the prevailing downward trend. Recent price action suggests a corrective pullback, potentially setting up for another move lower if resistance holds.
Key Level: 5980
This zone, previously a consolidation area, now acts as a significant resistance level.
Bearish Scenario (rejection at 5980):
A failed test and rejection at 5980 would likely resume the bearish momentum.
Downside targets include:
5796 – Initial support
5728 – Intermediate support
5667 – Longer-term support level
Bullish Scenario (breakout above 5980):
A confirmed breakout and daily close above 5980 would invalidate the bearish setup.
In that case, potential upside resistance levels are:
6025 – First resistance
6100 – Further upside target
Conclusion
WTI Crude remains under bearish pressure, with the 5980 level acting as a key inflection point. As long as price remains below this level, the bias favours further downside. Traders should watch for price confirmation around that level to assess the next move.
This communication is for informational purposes only and should not be viewed as any form of recommendation as to a particular course of action or as investment advice. It is not intended as an offer or solicitation for the purchase or sale of any financial instrument or as an official confirmation of any transaction. Opinions, estimates and assumptions expressed herein are made as of the date of this communication and are subject to change without notice. This communication has been prepared based upon information, including market prices, data and other information, believed to be reliable; however, Trade Nation does not warrant its completeness or accuracy. All market prices and market data contained in or attached to this communication are indicative and subject to change without notice.

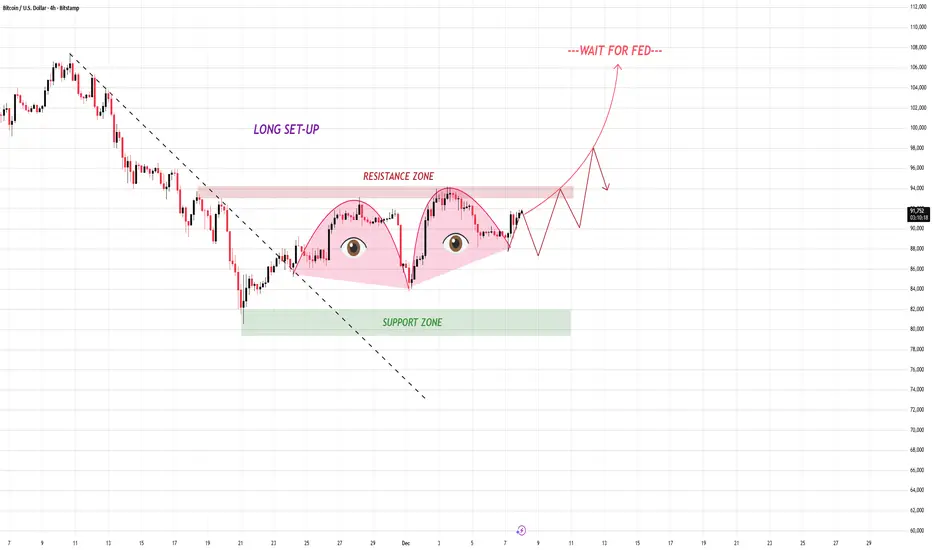
The Market Is Preparing a Bigger Move — Most Traders Won’t See 📌 TECHNICAL BREAKDOWN
1. Support Zone
Buyers consistently defend this area.
Each dip into this zone creates higher momentum on the rebound.
Strong liquidity pool — ideal for building long positions.
2. Resistance Zone (Neckline Zone)
Acts as the confirmation level for the double-bottom pattern.
Break and retest will be the key signal for a continuation run.
This zone contains trapped sellers → breakout may cause a squeeze.
3. Double-Bottom Formation
A textbook reversal pattern indicating exhaustion of the previous downtrend.
Both bottoms show clear absorption and equal reaction.
4. FED Event Catalyst
The “WAIT FOR FED” note on the chart marks a possible volatility spike.
Price may show fakeouts around resistance before choosing a direction.
A manipulation wick above the resistance is possible → be patient and let the market confirm.
📌 TRADE SETUP (LONG BIAS)
🔔 ENTRY ZONE:
Break & Retest of Resistance Zone
→ Enter after price closes above resistance and retests it successfully.
🛑 STOP LOSS:
Below the retest low
→ This protects you from FED-driven fakeouts.
🎯 TAKE PROFIT TARGETS:
TP1: First liquidity sweep after breakout
TP2: New short-term high
TP3: Extended target toward the projected upward curve
📌 BULLISH SCENARIO
- Break resistance
- Retest
- Build higher-lows
- Push into expansion phase
- FED catalyst accelerates breakout
This is the cleanest path and aligns with the chart’s projection.
📌 BEARISH SCENARIO (ALTERNATIVE)
If price fails to break resistance and rejects strongly:
- It may revisit the support zone again
- But as long as support holds, bias remains long
- Only a breakdown below support invalidates the setup
You don’t need to catch every move — you only need to catch the right one with discipline.