AUDUSD BUYAUDUSD - ACCUMULATION
Price has accumulated, liquidity has been swept, and we have entered the last phases, so for me the next move is a pullback to go higher
X-indicator

BearsHaving been on Bulls side since Oct 17 and broke through the support line last week. This week we looking to form a double Top(157.569) and look to sell targetting 151.084 as our TP can be held for months etc

Unlocking Global Market Potentiality1. Understanding Global Market Potentiality
Global market potentiality refers to the capacity of a business, sector, or economy to expand internationally by tapping into new customer segments, geographic regions, or emerging market trends. It includes evaluating:
Market size and future growth trajectory
Consumer behaviour, demographics, and purchasing power
Technological readiness and adoption
Competitive intensity and entry barriers
Regulatory environments and trade policies
Economic cycles and geopolitical stability
The core idea is to identify where the next wave of demand will arise and position your business to serve it early.
2. Why Global Expansion Matters More Than Ever
Several structural shifts make global expansion a necessity rather than an option:
a) Saturation in Domestic Markets
Many industries face slow growth at home due to mature consumption patterns. Global markets offer fresh demand and diversification.
b) Rising Middle Class in Emerging Economies
Asia, Africa, the Middle East, and Latin America are witnessing unprecedented income growth. This expands consumer demand for retail, financial services, healthcare, and technology.
c) Digital Connectivity
E-commerce, online services, fintech, and automation allow a business to reach global customers without heavy physical infrastructure.
d) Supply-Chain Diversification
Businesses can optimize costs, reduce risk, and improve efficiency by sourcing and manufacturing across multiple regions.
e) Competitive Advantage
Companies operating globally gain exposure to innovation, talent, and ideas—accelerating long-term competitiveness.
3. Key Pillars to Unlock Global Market Potentiality
a) Deep Market Research & Intelligence
The first step is thorough market analysis:
TAM, SAM, SOM evaluation
Demand forecasting
Cultural insights and consumer behaviour
Competitor benchmarking
Pricing and localization requirements
Tools such as data analytics, AI-driven forecasting, and global market databases help businesses identify high-potential regions with precision.
b) Understanding Local Regulations
Every market has unique legal requirements:
Import/export rules
Trade agreements and tariffs
Licensing and certifications
Data privacy and digital compliance
Taxation and repatriation of profits
Compliance reduces risk and prevents costly delays. Successful companies take a proactive approach through local legal teams or partnerships.
c) Building a Localized Strategy
A global strategy succeeds only when it feels local. Localization can include:
Tailored product designs
Customized marketing messages
Local languages and cultural alignment
Region-specific pricing
Local payment systems and logistics
For example, payment adoption differs widely—UPI in India, Alipay in China, and card-heavy systems in Europe.
d) Strong Global Brand Positioning
A credible global brand signals trust. Brand positioning should combine universal values (quality, reliability, innovation) with tailored regional messaging.
e) Digital-First Global Entry
Technology accelerates international growth:
E-commerce platforms
Social media for global brand visibility
Cloud-based operations
AI-driven customer segmentation
Cross-border digital payments
SaaS distribution models
Digital entry reduces costs and creates scalable access to multiple markets.
f) Strategic Partnerships & Alliances
Local partners accelerate learning and reduce risk:
Distributors and channel partners
Local manufacturers
Franchise operators
Government or regulatory coordination
Joint ventures for shared expertise
These partnerships help companies navigate cultural, legal, and logistical challenges.
g) Flexible Global Supply Chain & Operations
Operational excellence is key to serving global demand:
Multi-country manufacturing
Nearshoring or friend-shoring
Smart warehousing
Real-time logistics tracking
Vendor diversification
Resilient supply chains protect a business against disruptions like political instability, pandemics, and climate events.
4. Emerging High-Potential Global Markets
Several regions now present outsized opportunities:
1. Asia-Pacific
India, China, Indonesia, Vietnam, Philippines → Rapid urbanization and digital-first consumers.
2. Middle East & GCC
Saudi Arabia & UAE → Economic diversification, luxury demand, infrastructure investment.
3. Africa
Kenya, Nigeria, South Africa → Rising digital adoption, youthful population, fintech growth.
4. Latin America
Brazil, Mexico, Chile → Expanding middle class and commodity-driven growth.
Each region offers distinct opportunities in sectors like fintech, renewable energy, EVs, healthcare, edtech, logistics, and consumer goods.
5. Industry Sectors with the Highest Global Potential
a) Technology & Digital Services
AI, cloud computing, cybersecurity, automation, SaaS, digital payments.
b) Healthcare & Pharmaceuticals
Demand increasing due to aging populations, chronic diseases, and biotechnology.
c) Renewable Energy
Solar, wind, hydrogen, green technology, EV ecosystem.
d) Consumer Goods & Retail
Apparel, FMCG, lifestyle products, luxury retail.
e) Infrastructure & Real Estate
Smart cities, construction, urban development.
f) Agriculture & Food Processing
Global food security and supply chain modernization.
g) Financial Services
Fintech, insurance, wealth management, cross-border investing.
6. Risks in Global Expansion & How to Mitigate Them
Unlocking global potential also involves addressing risks:
a) Geopolitical Instability
Use diversified markets and supply chains to minimize exposure.
b) Currency Volatility
Hedge using forex instruments or multi-currency accounts.
c) Cultural Misalignment
Invest in localization and local leadership teams.
d) Regulatory Complexity
Maintain compliance through legal counsel and continuous monitoring.
e) Competitive Pressure
Innovate faster, build brand loyalty, and offer differentiated value.
f) Operational Challenges
Adopt scalable digital infrastructure and supply-chain automation.
7. The Role of Innovation in Global Success
Innovation is the engine that unlocks global potential:
AI-driven product development
Manufacturing automation
Sustainability and green innovation
Data-led decision-making
Digital-first customer interfaces
Companies that innovate grow faster, capture new segments, and outperform global competitors.
8. Building a Future-Ready Global Strategy
A strong global strategy includes:
Vision: Clear long-term goals
Market Prioritization: Choosing high-ROI markets
Execution Framework: Market entry → expansion → consolidation
Resource Allocation: Capital, talent, technology
Continuous Learning: Monitoring trends and adapting
This ensures that the business remains resilient, competitive, and scalable across markets.
Conclusion
Unlocking global market potentiality is not a one-time decision—it is a continuous strategic journey. Companies that successfully globalize benefit from expanded customer bases, diversified revenue streams, innovation exposure, and long-term resilience. With the right combination of market research, localization, regulatory alignment, digital strategy, partnerships, and supply chain strength, businesses can turn global opportunities into sustainable success. The future belongs to companies that think internationally, act strategically, and adapt quickly to global change.

Ribbon Flip SignalsRibbon Flip Signals highlight the exact moment when market momentum shifts and the trend direction changes. When the ribbon transitions from bearish to bullish, a Buy Flip appears, signaling rising strength and a potential upward move. When the ribbon shifts from bullish to bearish, a Sell Flip appears, marking weakening momentum and a likely reversal or exit point.
Ribbon Flip Signals help traders spot trend changes early, filter out noise, and enter only when momentum aligns with direction. This makes every shift in the ribbon a clear, actionable signal rather than just a visual change.

XAUUSD – Sell Trade Setup (Based on Triangle Breakout)XAUUSD chart shows price moving inside a tightening structure where lower highs and higher lows squeezed the market into a symmetrical triangle. Since the overall trend before the pattern was strongly bearish, the triangle acted as a continuation formation. Price eventually broke through the lower trendline with a clean bearish candle, confirming downside momentum. After the breakout, price pulled back upward to retest the broken trendline, and the rejection at that point (marked by the orange circle in your chart) shows sellers stepping back in and protecting the structure. That rejection is the key confirmation that the breakout is real and not a fake move.
TRADE SUMMARY (Simple & Ready)
SELL XAUUSD
Entry: After triangle retest rejection
SL: Above the retest / above triangle
TP: Triangle measured move (your target point)
Bias: Bearish continuation
Reason: Triangle breakdown + retest + rejection + trend alignment

USDCHF what a great trade.Trade Entry – USD/CHF
Date: 10/12/25
Time (UK): 08:00
Market Context:
High → Low retracement: Price respected the 78.6% Fibonacci level with a clean wick rejection.
H4 Structure: Presence of a H4 Order Block (OB) aligned with a pin bar rejection, adding confluence for a reversal.
Fundamentals: FOMC scheduled later (high-impact news), so risk management tightened.
Plan / Execution:
Entry Bias: Short (based on 78.6% rejection + H4 OB + pin bar).
Target: 30 pips (quick in-and-out trade due to news risk).
Risk Management: Avoid holding through FOMC; take profit early.
Notes:
Maintain disciplined exit—don’t extend TP because of upcoming volatility.

BRK.B- Double Top Pullback – Healthy Correction or Trend Shift?BRK.B Elliott Wave Breakdown: Double Top Pullback – Healthy Correction or Trend Shift?
BRK.B just hit a double top at 516, pulling back to 491 amid Fed jitters. Is this the end of Wave 5's rally, or just a healthy breather?
Let's dive into the chart for Dec 2025 insights:
Primary Count Overview: We're in Wave 5 (iii) of a bullish impulse – from 473 low, it rallied to 516, now retracing channel lower rail ~485. No overlap rule violation here: Wave 4's contracting triangle (ending at 455) allows minor intrusion into Wave 1 territory (491 high), keeping the 5-wave advance intact.
- Double Top Impact: This M-pattern signals short-term bearish reversal, targeting 480-496 support on neckline break. Volume's spiking on downside, RSI at 39 screams oversold – expect a 5-7% dip, but it's not derailing the bull trend in Elliott structure.
- Key Levels to Watch:
-- Support: 480-490 (green zone, SMA120 hold);
-- Resistance: 528 (year-end target, +7% upside).
Alternative Count : Break 455 + 5M volume (larger Wave 4 zigzag to 430-440, 25% odds from Fed 12/18).
Outlook & Strategy: 65% chance of bounce to 510-528 by EOY, fueled by $190B cash hoard and P/B 1.52 value. Long-term: Break 542 unlocks 580-600 Q1 2026. Tip: Buy dips at 478, stop below 455; scale out at 528 for profits.
Call to Action: What’s your BRK.B play? Drop comments below – like, subscribe for weekly updates! #StockAnalysis
Disclaimer: This analysis is for educational purposes only and is not investment advice. Please do your own research (DYOR) before making any trading decisions.

Bitcoin vs Silver RatioBitcoin vs Silver Ratio
A similar structure has been formed in the BTCUSD/XAGUSD ratio on the weekly chart (as in our previous analysis of Nasdaq vs Silver monthly chart)
A clear breakout could be seen, and BTC seems to have already entered a bear market priced in silver
Interpretation
1. Ratio Declines: Silver benefits
2. Ratio Appreciates: Bitcoin benefits
Similar 3 possibilities - if the ratio keeps on declining:
1. Either Silver will rise further, with higher strength than Bitcoin
2. Bitcoin will continue to fall
3. Both the above situations simultaneously

EUR-JPYIt reacted negatively to resistance. There’s no hurry for approval; for selling, the specified support level needs to be broken first, then it can be sold.

Gold AnalysisWe have BSL in recent swing high & 4hr internal is bullish + market is respecting bullish poi.
So most probably we have expect next bullish move after trendline or ssl sweep. We can trade with scoob or ichoch confirmation.


Gold (XAU/USD) – Range Consolidation with Bullish Upside Target1. Market Structure
Range → Attempted Breakout:
Price has been moving in a broad consolidation / rising channel, with multiple rejections near the upper boundary.
Higher Lows, Weak Highs:
Buyers are defending higher lows, but sellers are still strong near resistance → this is compression, not a confirmed trend.
Bias: Neutral-to-bullish only if support holds.
---
2. Key Levels (Very Important)
🔴 Support Zone (Red Area)
4,170 – 4,163
This is a major demand zone.
Multiple candle wicks show aggressive buying here.
If this zone fails → structure breaks bearish.
✅ As long as price stays above 4,163, longs are still valid.
---
⚪ Current Price Area
Around 4,190–4,200
Price is sitting mid-range → not ideal for new entries unless confirmation appears.
---
🔵 Resistance / Target Zone
4,250 – 4,260
Clear range high + prior rejection zone
Marked as your TARGET POINT, which technically makes sense.
🚨 Expect selling pressure here on first touch.
---
3. Trade Idea Implied by the Chart
Bullish Scenario (Preferred)
Entry:
Rejection + bullish candle close above 4,170–4,180
Stop Loss:
Below 4,160
Target:
4,250–4,260
✅ Risk–reward is solid only if entry is near support.
---
Bearish Scenario (Invalidation)
A strong 3H close below 4,160
That would:
Break the demand zone
Flip structure bearish
Open downside toward 4,120–4,100
---
4. What I’d Watch Next (Discipline Check)
✅ Bullish engulfing / strong rejection at support → okay to long
❌ Chasing price in the middle of the range → poor trade
🚨 Fake break above 4,250 without volume → likely reversal
---
Bottom Line
This is a range-based long setup, not a breakout yet.
Best trades are patience trades here.

LONG on XAUUSD (Gold) at 4198.80Entered LONG on XAUUSD (Gold) at 4198.80
Targets: 4220 | 4238 |
Stop Loss: 4185
Leverage: 20x Clean higher-timeframe structure + bullish order block holding perfectly. Expecting continuation to the upside NOT financial advice
DYOR | Trade at your own risk | Protect your capital!#XAUUSD #Gold #GoldTrading #Forex #TradingSignals #PriceAction #DayTrading #SwingTrading #Commodities #Metals #TradingWho’s riding gold with me?

XAUUSD is in sell zone!Daily support is broken with London breakdown on XAUUSD. FOMC could trigger a massive liquidity towards downside to retest the weekly low. There is potential for rate cut, which in turn can cretate increased volume in GOLD. As current lower timeframe market structure shows bearish price action, we may eventually see a bounce off the weekly support level for long term bullish bias.

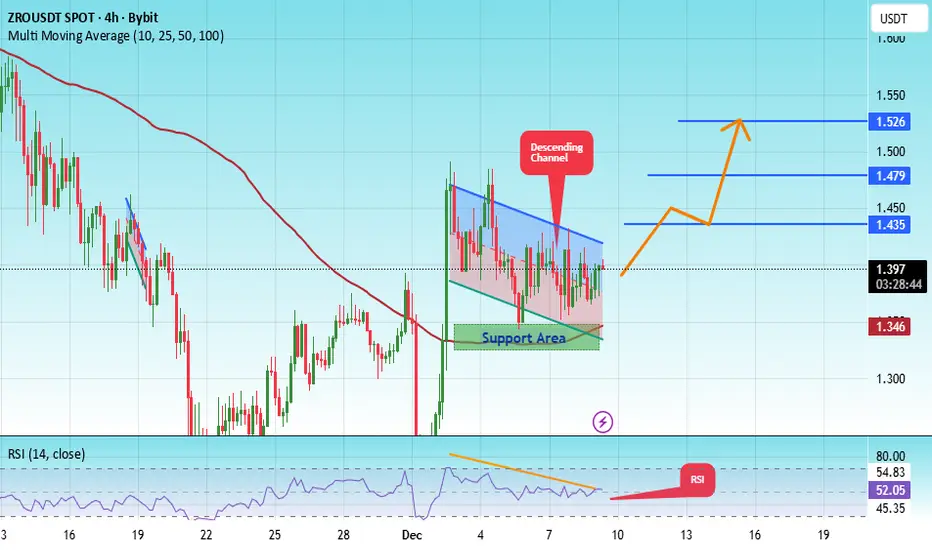
#ZRO/USDT could be another strong contender#ZRO
The price is moving in a descending channel on the 1-hour timeframe. It has reached the lower boundary and is heading towards breaking above it, with a retest of the upper boundary expected.
We have a downtrend on the RSI indicator, which has reached near the lower boundary, and an upward rebound is expected.
There is a key support zone in green at 1.33. The price has bounced from this zone multiple times and is expected to bounce again.
We have a trend towards stability above the 100-period moving average, as we are moving close to it, which supports the upward movement.
Entry price: 1.40
First target: 1.43
Second target: 1.48
Third target: 1.53
Don't forget a simple principle: money management.
Place your stop-loss below the green support zone.
For any questions, please leave a comment.
Thank you.
The Day Ahead - Federal Reserve Rate decisionWednesday, December 10 – Key Events Preview
Data Releases
United States: Q3 Employment Cost Index; November Federal Budget Balance
China: November CPI, PPI
Italy: October Industrial Production
Sweden: October GDP Indicator
Denmark: November CPI
Norway: November CPI
Central Banks
Federal Reserve: Rate decision
Bank of Canada: Rate decision
European Central Bank: President Lagarde speaks
Earnings
Oracle
Adobe
Synopsys
Other
UK: Chancellor Rachel Reeves appears before the Treasury Select Committee
This communication is for informational purposes only and should not be viewed as any form of recommendation as to a particular course of action or as investment advice. It is not intended as an offer or solicitation for the purchase or sale of any financial instrument or as an official confirmation of any transaction. Opinions, estimates and assumptions expressed herein are made as of the date of this communication and are subject to change without notice. This communication has been prepared based upon information, including market prices, data and other information, believed to be reliable; however, Trade Nation does not warrant its completeness or accuracy. All market prices and market data contained in or attached to this communication are indicative and subject to change without notice.

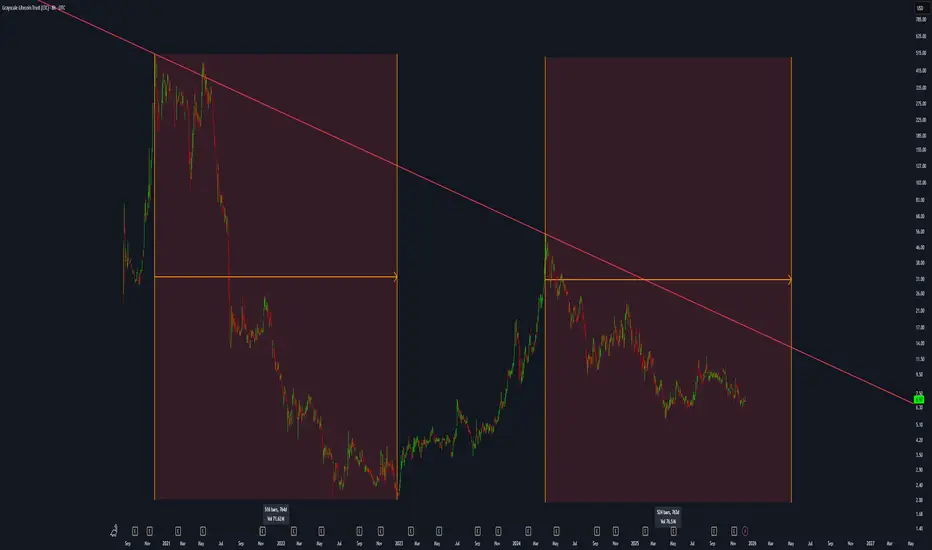
The Truth behind Litecoin PriceGoing off the pattern by May 2026 it should bottom out, IMO 5-6 dollar is the floor. Probably another touch of it. If you are still holding, you are just going to have to hold until the halving. That said everyone should be aware of what they did to Litecoin.
They screwed retail over for 2 halvings. SOV and marketcap is a function of supply math with cryptocurrency. They broke the math. End of the day it comes down to two things, buying out old investors coins, and controlling selling pressure. They broke the math by controlling the selling pressure. They cut retail out of the past 2 halvings of run ups with the premiums. It was a very scummy thing to do and Charlie is in on it, as are the miners, and greyscale, and more. For the record once people hit the ultrahigh net worth individual range, they join fiat world, and become part of the problem.
What they did has to come to light, they did the opposite of what Satoshi would. The fact that 99% of the market is unaware of it speaks volumes on how deep it runs. Entire cryptotwitter/cryptoyoutube is controlled by the same idiots. There is nothing organic about crypto at this point. Is it functionally better than gold/silver, yes, but it is also more rigged. Just like how they harvested trillions of dollars from gold/silver suppression over the past 50 years, they did the same to Litecoin harvesting 10s of billions. It's disgusting.
They knew if too many honest people got rich off crypto they'd lose influence. There are only about 160k or so ultrahigh net worth individuals, and Litecoin mooning would have made several thousand more. It's the same with BTC they know if average people enter the ultrahigh net worth range they'd lose control. The whole thing is about control, but more importantly getting rich off peoples hopes and dreams. They are truly pieces of garbage.
There is so much insider trading and foul play with Litecoin. Defeats the whole purpose of cryptocurrency. The cost of supporting Litecoin is just not worth it. If the whole thing wasn't rotten to the core the true valuation of Litecoin would be closer to 15000 dollars instead of 80.
They have some nerve gaslighting the very people that believed in digital silver, the very people they scammed out through premiums and collusion, when they sat around for 7+ years doing nothing while everyone else developed apps. The market grew Litecoin didn't. They should be in jail.
Literally scam market. Fake market. Algos hunting liquidity. The light is gone.
New Energy Market Trends1. Rapid Growth of Renewable Energy Capacity
One of the most dominant trends in the new energy sector is the unprecedented expansion of renewable power capacity—mainly solar, wind, and hydropower. Solar energy is leading the transition due to plummeting module costs, scalable technology, and supportive government policies. Large-scale solar parks, rooftop installations, and floating solar plants are becoming mainstream. Wind power, especially offshore wind, is growing rapidly thanks to improved turbine technology, higher capacity factors, and falling installation costs.
Developing countries, particularly India, China, and parts of Southeast Asia, are experiencing the fastest renewable capacity growth due to rising electricity demand and favorable national policies. Many countries are committing to Net Zero targets and increasing their proportion of renewable energy in the grid-mix. This shift is also being supported by private players, as corporate Power Purchase Agreements (PPAs) gain popularity for decarbonizing operations.
2. Energy Storage Becomes Essential for Grid Stability
With renewable energy’s intermittent nature, energy storage systems—especially lithium-ion batteries—have become critical. Storage allows solar and wind energy to be stored during peak production and used during high demand or low generation hours. This enhances grid reliability and reduces blackout risks.
Battery storage prices have been falling consistently, supported by innovation in lithium-ion chemistry, solid-state battery development, and economies of scale in production. Grid-scale battery farms, home energy storage, and industrial storage systems are growing globally. Additionally, alternative storage technologies like pumped hydro storage, flow batteries, and thermal energy storage are emerging as powerful solutions for long-duration needs.
Countries with high renewable penetration, such as Australia, Germany, and the United States, are heavily investing in hybrid renewable-plus-storage projects, which combine solar/wind with batteries to stabilize supply. This trend will continue as more renewable energy is integrated into power grids worldwide.
3. Green Hydrogen Gains Global Attention
Green hydrogen—produced using renewable energy through electrolysis—is becoming a key pillar of the clean energy transition. It provides a decarbonization pathway for hard-to-abate sectors like steel, cement, fertilizers, shipping, and heavy industries.
Major economies such as the European Union, Japan, South Korea, India, and China are investing heavily in national hydrogen strategies. Electrolyzer prices are expected to fall significantly as production scales up, similar to the trend seen in solar panels. Industrial clusters across the world are piloting hydrogen-based steel production, hydrogen fuel cells for vehicles, and hydrogen-powered power plants.
Hydrogen also acts as an energy storage medium, helping balance renewable power supply. The future will likely see widespread hydrogen hubs, export-import corridors, and integration with heavy industries.
4. Growth of Electric Vehicles (EVs) Reshapes Energy Demand
Electric mobility is one of the biggest disruptors in the energy market. EV adoption is accelerating due to falling battery costs, government incentives, improving charging infrastructure, and increasing environmental awareness. With automotive giants transitioning to all-electric fleets, EVs are reshaping the demand for electricity, metals, energy storage, and charging technology.
Charging infrastructure is becoming more widespread—public stations, fast chargers, home charging units, and battery swapping stations (popular in Asia) are expanding rapidly. Vehicle-to-grid (V2G) technology, which allows EVs to feed energy back into the grid, is another emerging innovation that may stabilize electricity networks.
The shift from internal combustion engines to EVs also affects the oil and gas industry, reducing long-term demand for petrol and diesel while increasing dependence on electricity and battery raw materials.
5. Digitalization and Smart Grid Technologies Transform Energy Systems
Smart grids and digital energy solutions are essential for managing the growing complexity of modern power systems. Real-time data, automation, smart meters, IoT-connected devices, and AI-driven energy management platforms are dramatically improving energy efficiency.
Smart grids help utilities balance demand and supply more effectively, reduce transmission losses, and manage decentralized renewable resources. Consumers also benefit through smarter home energy devices, solar-plus-storage systems, and real-time consumption insights.
AI and machine learning are being used for:
Predicting energy demand patterns
Optimizing renewable generation
Monitoring grid assets
Reducing energy waste
Enhancing power trading
Blockchain-based energy trading is also emerging, allowing peer-to-peer power purchase in local microgrids, making energy more democratized.
6. Carbon Markets and ESG Investing Accelerate Clean Energy Adoption
Global carbon markets—both compliance and voluntary—are growing as companies and nations commit to decarbonization. By putting a price on carbon emissions, governments incentivize cleaner technologies and penalize polluting industries. This pushes industries toward renewable energy, energy efficiency, and sustainable operations.
ESG (Environmental, Social, Governance) investing has gained tremendous momentum, with institutional investors increasingly allocating funds to companies with strong sustainability practices. Renewable energy companies, green bonds, and climate-focused funds are benefiting from this capital inflow.
Carbon credit trading, carbon offset projects, and nature-based solutions are becoming new investment categories. Companies are adopting internal carbon pricing to make environmentally conscious decisions and prepare for stricter regulations in the future.
7. Energy Transition Metals See Rising Demand
Clean energy technologies rely heavily on specific metals—lithium, cobalt, nickel, graphite, copper, and rare earth elements. As EVs, batteries, solar panels, and wind turbines scale up, demand for these minerals is surging.
This has triggered investments in sustainable mining, recycling technologies, and alternative materials to avoid supply chain bottlenecks. Countries are also exploring domestic mineral reserves to reduce dependence on dominant exporters. Circular economy initiatives—battery recycling, solar panel reuse, rare metal recovery—are gaining traction globally.
8. Distributed Energy and Microgrids Expand
Distributed energy resources (DERs) such as rooftop solar, small wind systems, home batteries, and local microgrids are becoming popular for both residential and commercial users. These systems reduce dependence on central grids and improve energy resilience.
Microgrids are particularly valuable for remote regions, military bases, industrial facilities, and disaster-prone areas. They can operate independently during grid failures, providing reliable and clean power.
DERs and microgrids help reduce transmission losses, lower consumer bills, and decentralize energy production—making energy more democratic and community-driven.
Conclusion
The new energy market is evolving faster than any previous phase in global energy history. Renewable power growth, battery storage, green hydrogen, EVs, smart technologies, and carbon markets are fundamentally reshaping how the world generates, distributes, and consumes energy. Innovations in digitalization, materials science, and policy frameworks further accelerate this transformation.
As nations pursue sustainability and energy security, the new energy sector will continue attracting massive investments and technological advancements, unlocking long-term economic, environmental, and social benefits. The coming decade marks a decisive shift towards decentralized, digital, and decarbonized energy systems—defining the future of global markets.

Domestic Market vs Global Market1. Meaning of Domestic Market
The domestic market, also known as the internal market or home market, refers to the economic environment within a specific country. All transactions—production, distribution, marketing, buying, and selling—take place inside national borders. Participants operate under the country’s laws, currency, taxation, and business culture.
Key Characteristics of Domestic Markets
** Single Currency:** All trade happens in the nation’s currency (e.g., INR for India).
** Local Regulation:** Businesses follow national laws, taxation, and safety standards.
** Known Consumer Preferences:** Companies understand local culture, tastes, and purchasing power.
** Lower Risk:** No foreign exchange fluctuation, geopolitical uncertainty, or cross-border compliance.
** Easier Market Entry:** Setting up operations, distribution, and marketing is simpler compared to international expansion.
Advantages of Domestic Markets
Lower cost of operations.
Predictable demand patterns.
Better regulatory familiarity.
Local brand loyalty.
Smaller logistical and transportation challenges.
Limitations
Limited customer base.
Growth potential capped by domestic economic conditions.
High competition if the market is saturated.
Vulnerable to local inflation, interest rate changes, and policy shifts.
2. Meaning of Global Market
The global market (or international market) refers to buying and selling across multiple countries worldwide. Companies sell products, raise capital, and source raw materials internationally. Global markets connect nations, businesses, and consumers across borders through trade, investment, and technology.
Key Characteristics of Global Markets
Multiple Currencies: Trade involves forex markets (USD, EUR, JPY, etc.).
Global Consumer Base: Millions of potential customers worldwide.
Complex Regulations: Different countries have different laws on product standards, taxes, and business operations.
Increased Competition: Competing with international brands and multinational corporations.
High Growth Opportunity: Access to huge markets, new segments, and diverse demand.
Advantages of Global Markets
Unlimited expansion potential.
Higher profit margins due to scale.
Ability to diversify business risk across countries.
Access to cheaper raw materials and skilled labour.
Enhanced brand value and global recognition.
Limitations
Complex logistics and supply chain challenges.
Exposure to currency fluctuations.
Geopolitical risks (wars, sanctions, trade barriers).
Cultural and language barriers.
High cost of marketing, compliance, and international operations.
3. Key Differences: Domestic vs Global Market
1. Scale of Operation
Domestic: Operates within one country.
Global: Operates across several countries or continents.
2. Consumer Base
Domestic: Limited to local population.
Global: Millions of global customers with different needs and purchasing behaviours.
3. Currency
Domestic: One currency.
Global: Multiple currencies and exposure to forex volatility.
4. Competition
Domestic: Compete with local businesses.
Global: Compete with global giants such as Apple, Tesla, Samsung, etc.
5. Regulation
Domestic: One set of national laws.
Global: Must comply with customs, trade agreements, tariffs, and legal systems of many countries.
6. Risks
Domestic: Political instability, inflation, taxation.
Global: Geopolitics, supply chain disruptions, currency risk, global recessions.
7. Logistics
Domestic: Simple networks within the country.
Global: Shipping, customs clearance, warehousing, and international transport.
8. Marketing Strategy
Domestic: Fixed strategy based on local culture.
Global: Localization required—adapt product names, pricing, packaging, promotions, and language.
4. Why Companies Expand from Domestic to Global Markets
Businesses often start in domestic markets to build a stable foundation. Once they achieve brand recognition and financial strength, they expand into global markets for:
1. Growth and Scalability
The domestic market may become saturated. Going global allows businesses to tap into new customer segments.
2. Diversification
Expanding globally helps protect companies from domestic economic downturns.
3. Cost Efficiency
Countries like India, Vietnam, and Bangladesh offer affordable labour and production costs, reducing overall expenses.
4. Competitive Advantage
Companies that operate globally often achieve technological, financial, and operational superiority.
5. Resource Access
Global markets provide access to:
Rare minerals
High-end technology
Skilled talent
Advanced manufacturing hubs
5. Impact on Investors: Domestic vs Global Markets
Investors also benefit differently from domestic and global markets.
Domestic Investing
Less complex.
Lower risk.
Better understanding of companies and regulations.
Global Investing
Exposure to fast-growing economies.
Diversification across countries.
Opportunities to invest in global companies like Apple, Google, or Amazon.
However, global investing involves:
Currency risk
Higher brokerage costs
Taxation complexity
6. Impact on the Economy
Domestic Market’s Role
Creates employment.
Strengthens local industries.
Helps the government generate tax revenue.
Global Market’s Role
Boosts exports.
Improves foreign exchange reserves.
Promotes technological advancement through global competition.
Encourages multinational companies (MNCs) to invest locally.
A strong global presence can elevate a country’s economic status.
7. Examples for Better Understanding
Domestic Market Examples
Patanjali selling products primarily within India.
Local Kirana stores and regional brands.
India-focused stock exchanges like NSE and BSE (though they attract global money indirectly).
Global Market Examples
Apple selling products worldwide.
Tata Motors operating in 100+ countries.
Amazon’s global e-commerce network.
Reliance exporting petrochemicals to several continents.
These comparisons show how companies leverage both markets depending on their goals.
8. Conclusion
The domestic market forms the foundation of any business, offering stability, low risk, and predictable demand. It is ideal for startups and companies building brand loyalty. On the other hand, the global market presents massive opportunities for scale, profit, innovation, and diversification—but requires deep resources, compliance capability, and adaptability.
In today’s interconnected world, businesses and investors increasingly balance both domestic and global markets. Companies begin locally, refine operations, and gradually expand internationally. Investors diversify across borders to reduce risk and capture global growth.
Understanding the distinctions between these two markets helps businesses design better strategies, investors make smarter decisions, and policymakers create more balanced, growth-focused economic policies.

Interest Rates and Inflation in the Global Market What Is Inflation?
Inflation is the rate at which the general level of prices for goods and services rises over time. When inflation increases, each unit of currency buys fewer goods and services, reducing purchasing power.
Types of inflation
Demand-pull inflation – When demand exceeds supply (e.g., strong economy, rising consumption).
Cost-push inflation – When production costs rise (e.g., higher crude oil, raw materials, wages).
Built-in inflation – Workers demand higher wages because they expect prices to rise, leading to a wage-price spiral.
Moderate inflation is considered normal and even healthy for economic growth. Extremely high inflation erodes savings and investment confidence, while very low or negative inflation (deflation) can damage economic momentum.
What Are Interest Rates?
Interest rates represent the cost of borrowing money. Central banks such as the Federal Reserve (US), RBI (India), ECB (Europe), and others set benchmark policy rates that influence lending rates, deposit rates, loans, mortgages, and corporate borrowing.
Types of interest rates
Policy rate (Repo/interest rate by central bank)
Interbank rates (e.g., LIBOR, SOFR)
Commercial lending rates (bank loans, mortgages)
Bond yields (returns on government securities)
When interest rates rise, borrowing becomes costlier. When they fall, liquidity increases and borrowing becomes more attractive.
The Relationship Between Interest Rates and Inflation
Interest rates and inflation are closely linked by the monetary policy of central banks.
When inflation is high, central banks typically increase interest rates to slow the economy.
When inflation is low, central banks reduce interest rates to stimulate spending and investment.
This relationship is known as the interest rate–inflation trade-off.
Why central banks raise rates during high inflation
Higher interest rates reduce borrowing.
Consumers spend less; businesses delay expansion.
Demand slows → price pressure cools → inflation moderates.
Why central banks cut rates in low inflation
Cheaper loans boost economic activity.
Consumers buy more; businesses invest more.
Demand rises → inflation increases gradually to healthy levels.
How Inflation Impacts Financial Markets
1. Stock Markets
Inflation affects corporate profits, valuation multiples, and investor sentiment.
High inflation: negative or volatile for markets
Higher costs → lower margins.
Reduced consumer spending.
Higher interest rates lower PE ratios.
Uncertainty leads to volatility.
Sectors that perform better during high inflation:
Energy
Commodities
Metals
FMCG (Pricing power stocks)
Banks (during rate hikes)
Low inflation: supportive for equity markets
Stable costs create predictable earnings.
Low interest rates boost valuations (higher PE).
Liquidity flows into equities.
Sectors that perform strongly:
Tech
Real estate
Automobiles
Growth stocks
2. Bond Markets
Bond prices and interest rates have an inverse relationship.
When rates rise
Existing bonds lose value.
New bonds offer higher yields.
Long-duration bonds fall the most.
When rates fall
Bond prices rise.
Investors earn capital gains.
Borrowing increases, boosting credit growth.
Inflation reduces the real return of bonds, making inflation-indexed bonds (like India’s inflation-linked government securities) attractive.
3. Currency Markets
Inflation and interest rates heavily influence currency strength.
High interest rates → stronger currency
Because:
Higher yields attract foreign investment.
Carry trades favor high-interest-rate currencies.
High inflation → weaker currency
Because:
Purchasing power declines.
Foreign investors lose confidence.
For example:
US dollar strengthens when Fed hikes rates.
Emerging market currencies weaken when global inflation rises.
4. Commodity Markets
Inflation and interest rates influence commodities like gold, crude oil, and metals.
Inflation impact
Inflation pushes commodity prices up (raw materials cost more).
Gold rises as a hedge against inflation.
Interest rate impact
High rates strengthen USD → commodities fall.
Low rates weaken USD → commodities rise.
How Interest Rates Influence Markets
1. Equity Markets
Interest rates directly impact corporate earnings and valuations.
Rate hikes
Increase borrowing costs → lower profits.
Reduce liquidity → markets correct.
PE multiples shrink → growth stocks fall.
Sectors that benefit:
Banking
Insurance
Sectors that suffer:
IT/Tech
Real estate
Consumer durables
Rate cuts
Cheaper loans → higher demand.
Economic activity increases.
Stock markets rally.
Growth stocks and sectors like tech, auto, and real estate benefit the most.
2. Real Estate Markets
High interest rates make home loans expensive → real estate slows.
Low rates boost property demand.
Real estate cycles closely follow monetary cycles.
3. Banking and Financial Sector
Banks gain when rates rise gradually, because:
Net interest margins (NIMs) increase.
Deposit rates lag lending rates.
But rapid rate hikes can hurt banks if loan defaults increase.
4. Consumer Behavior
Interest rates influence how households spend money.
High interest rates
People save more, spend less.
Home, auto, and consumer loans drop.
Discretionary consumption declines.
Low interest rates
Consumers borrow more.
Spending rises.
Economic growth increases.
Central Bank Policies and Their Role
Central banks use monetary tools to balance inflation and economic growth:
Key tools
Policy rates (Repo, Federal Funds Rate)
Open market operations (buying/selling bonds)
Cash reserve ratio (CRR)
Quantitative easing/tightening
Central banks must maintain:
Price stability
Economic growth
Currency stability
Mistimed rate decisions can trigger recessions or hyperinflation.
Global Impact of Inflation and Interest Rate Cycles
1. Emerging Markets
Countries like India, Brazil, or Indonesia are sensitive to:
US interest rate cycles
Dollar strength
Commodity prices
When the Fed hikes rates:
Foreign money exits emerging markets.
Stock markets correct.
Currencies weaken.
2. Developed Markets
Low inflation and low rates often lead to:
High equity valuations
Growth in tech and innovation investments
High inflation and high rates often trigger:
Bond market stress
Housing market corrections
Why Tracking These Indicators Matters
For investors and traders, monitoring inflation and interest rates helps in:
Identifying market cycles
Building sector-focused strategies
Adjusting risk in portfolios
Understanding currency and commodity trends
Making informed decisions in equity, debt, and forex
Conclusion
Interest rates and inflation form the backbone of global market dynamics. Their relationship influences everything from stock prices and bond yields to consumer spending and currency strategies. When inflation rises, central banks tighten rates, slowing economic activity but stabilizing prices. When inflation falls, rate cuts stimulate growth and liquidity. For investors, understanding these movements is crucial for timing market cycles, selecting the right sectors, and reducing risk. Ultimately, mastering the interplay between inflation and interest rates leads to smarter investment decisions and long-term wealth creation.

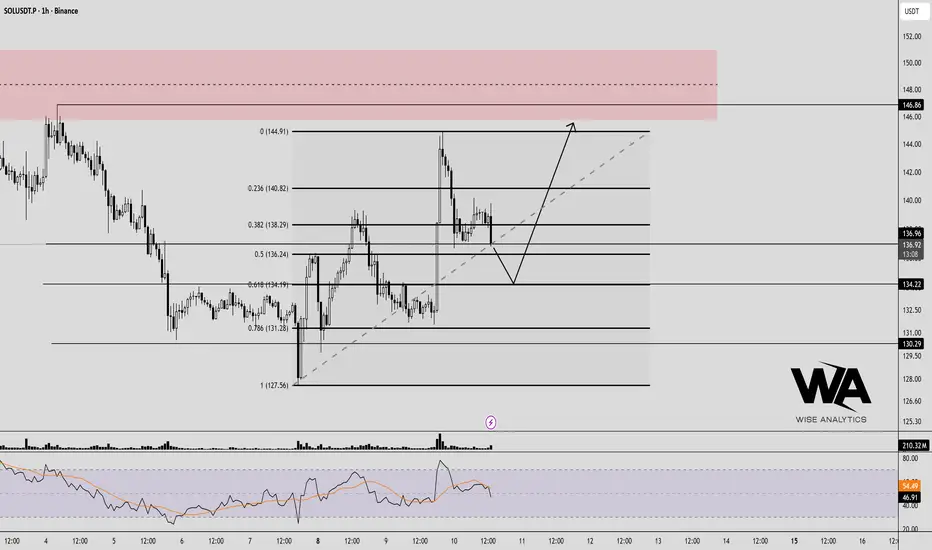
My trading plan is SOL.I will be buying Solana in this price range, aiming to reach $146.
Remember that today is FOMC day, so expect high volatility! Follow your risk management strategy and make your own decisions.
ROOT pretends to stay quiet, but the chart exposes its ambitionsROOT continues to develop a stable accumulation base inside a broadening channel while holding above the key demand zone near 80.65. This area aligns with the 0.786 Fibonacci retracement and the weekly ma100 which strengthens the support. Buyers remain active and the structure continues to signal accumulation.
The primary scenario suggests upward movement from the current price with the first target at 134.60 once the local consolidation is reclaimed. The next target sits at 181.50. The extended target remains at 241.53 where the upper channel boundary and volume projections converge.
Fundamentally ROOT maintains strong momentum. Revenue for the last twelve months reached 420 million dollars. Premium growth remains double digit versus the prior year. Loss ratios continue to improve. Customer retention is rising, and the cash position remains solid with more than 500 million dollars on hand. As of December 10th 2025 the company holds a market capitalization of roughly 2.1 billion dollars which leaves meaningful room for revaluation as margins improve.
As long as the price holds above 80.65 the bullish scenario remains active. Losing this zone will open deeper correction potential, yet the current buyer reaction and volume structure support continuation of the upward phase.
ROOT acts humble but the chart makes it clear. Its ambitions reach far beyond current levels.

Can bitcoin prices (BTCUSD) extend their gains?Bitcoin prices consolidated as traders balanced expectations of a 0.25% Dec Fed rate cut against concerns that Chair Powell may signal a pause in January 2026, tempering hopes for a strong year-end crypto rally. Momentum remains soft amid subdued ETF inflows, as several major houses have trimmed their year-end and 2026 price targets.
Despite continued accumulation from LTHs, recent buyers within the past six months hold a higher cost basis of around 103,000, which increases the likelihood of profit-taking and may limit gains.
BTCUSD is approaching the 94,000 resistance. The price remains within the ascending channel while holding above bullish fair value gap, suggesting potential for near-term gains. If BTCUSD closes above the 94,000 resistance, the price may surge toward the channel upper bound. Conversely, retreating below 94,000 may prompt a retest of the support at 89,000.
By Li Xing Gan, Financial Markets Strategist Consultant to Exness
