The ETH Move No Trader Is ExpectingETHEREUM 1D MARKET ANALYSIS
1. Current Price Structure
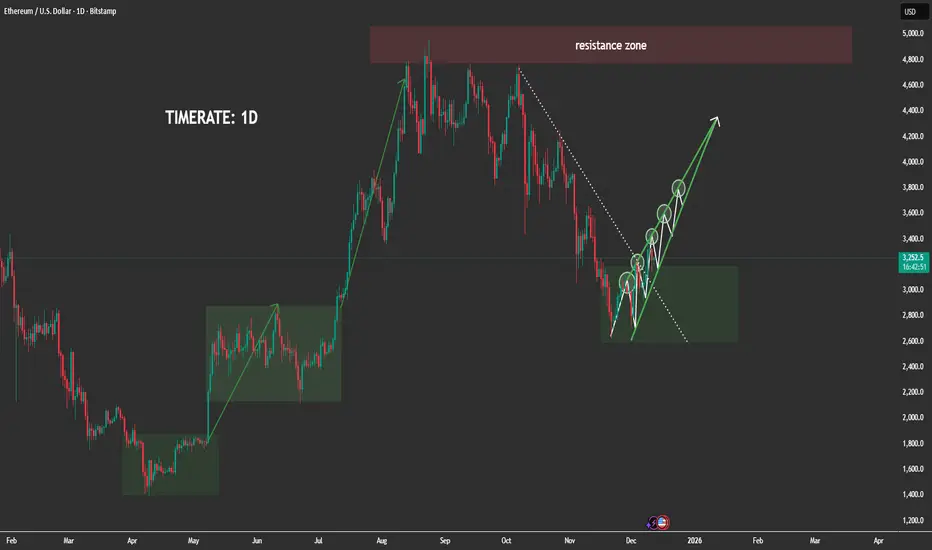
- ETH previously completed a strong bullish impulsive wave, breaking through multiple resistance levels before reaching the major 4,800–5,000 resistance zone, where the market formed a clear distribution top.
-After distribution, price entered a large corrective decline, following the descending dotted trendline visible on your chart.
-Recently, ETH has formed a broad accumulation block (highlighted in green), similar to the previous accumulation phases that triggered massive ETH rallies earlier in the year.
Inside this zone, ETH is now building a series of higher lows, showing early signs of bullish reconstruction.
-The current rising green structure indicates that price is forming a stair-step bullish pattern, preparing for a potential macro reversal.
2. Key Liquidity Zones
-Major Resistance Zone: 4,800–5,000
-This is the next major destination if ETH successfully completes the accumulation and transitions into expansion.
-Accumulation Block: 2,750–3,150
-This is where smart money is currently active — sweeping liquidity, trapping sellers, and accumulating long positions.
-Multiple liquidity grabs have already occurred inside this range, confirming strong institutional absorption.
-The current structure closely mirrors previous accumulation rectangles on the chart that led to massive bullish expansions.
3. Today's Market Scenario (1D Outlook)
Matches perfectly with the upward projection on your chart.
🔹 Main Scenario – Bullish Continuation After Accumulation
ETH is likely to follow this sequence:
-Continue building higher lows inside the accumulation block.
-Retest the inner structure trendline without breaking the macro zone.
-Form a clean break above the descending dotted trendline — signaling a bullish structure shift.
-Retest the broken trendline to form the final higher low.
-Begin expansion to the next major liquidity magnets:
-Short-term targets: 3,600 → 3,800
-Mid-term continuation: 4,200 → 4,500
-Macro target: 4,800–5,000 resistance zone
This is fully aligned with the green arrow projection you drew.
4. Market Psychology
-Big players are actively accumulating within this wide range clear repeated liquidity sweeps prove institutional activity.
-Retail traders are losing positions during sudden spikes and false breakdowns, which is typical behavior during accumulation phases.
-The market is more likely preparing for a major trend reversal, not a continuation downward.
-The price behavior mirrors earlier patterns:
Accumulation → Trendline Break → HL Retest → Massive Expansion
-This repetition increases confidence in the bullish outlook.
5. Intraday Strategy Guidance (1D)
Given the macro accumulation:
-Avoid selling aggressively the probability is against sustained bearish continuation.
-Best opportunities come from buying dips inside the accumulation zone.
-Watch for liquidity sweeps below local lows to identify smart-money entries.
High-probability setups:
✔️ Strategy 1: Buy the Bottom of the Range
Entry zones: 2,750–3,150
Targets: 3,600 → 3,800
✔️ Strategy 2: Buy the Retest After Trendline Breakout
This is the cleanest and safest setup.
Targets: 4,200 → 4,500 → 4,800+
ETH is currently in the prime zone where large investors position themselves before a new bullish cycle.
X-indicator
XAUUSD | Gold Signal |Dec 12,2025The strategy is to continue the upward trend, using the 4265-4263 range as a base for buying on dips and expecting further gains.
#XAUUSD #GOLD
Buy positions entered at 4268-4263, and the price has now reached the 4280 area as expected. The next key level is to push towards the 4295-4300 range.

XAUUSD Bullish Setup: Key Levels 4264 & 4300 in Focus. Analysis:
Gold is showing signs of renewed bullish momentum, supported by improving risk-on sentiment and strengthened by expectations that the Federal Reserve may cut rates twice in 2026. This macro backdrop continues to support upside pressure in precious metals.
On today’s chart, I’ve marked two important technical levels guiding the current bullish setup:
🟢 Key Support:
4264 – Primary support and the level where buyers are expected to remain active
🔺 Resistance Levels:
4300 – Immediate resistance; a clean break above this opens bullish continuation
4340 – Bullish target and next major upside zone
As long as gold remains above 4264, the market structure favors further upside. A breakout and sustained hold above 4300 would confirm bullish strength and likely drive price toward the 4340 target zone.
The current sentiment environment — with expectations of future Fed rate cuts — adds fundamental momentum to the technical bullish setup, increasing the probability of an extended rally.
📌 Bias: Bullish above 4264
📈 Breakout Confirmation: Close above 4300
🎯 Target: 4340
⚠️ Key Watch: Retest of 4264 for trend continuation
Regards: Chart Analyst Pro.
#Gold #XAUUSD #GoldAnalysis #GoldForecast #TechnicalAnalysis #PriceAction

BTCUSD 15m chart you shared (as of Dec 12, 2025):BTC/USDBITSTAMP:BTCUSD BTCUSD 15m chart you shared (as of Dec 12, 2025):BTC/USD – Potential Long Setup (15m timeframe)**
Entry Zone: 91,800 – 92,200 (current demand zone + lower boundary of the pink support area)
Stop Loss: 91,400 (below the recent swing low)
Take Profit Targets: TP1: 92,534 (recent high / supply zone)
TP2: 93,000 – 93,250 (upper resistance zone)
TP3: 94,000+ if momentum continues (trail stop)
Risk/Reward: ~1:2.5–1:4 depending on exact entry and target **Reasoning: Price is holding the key horizontal support (~92,000) after a sharp drop
Bullish trendline still intact from the lows
Higher-timeframe structure remains bullish (daily/4h uptrend)
Potential inverse head & shoulders forming on lower timeframes
Trade Management: Wait for bullish 15m/5m candle close + volume spike above 92,200 for confirmation
Scale in if price sweeps 91,800 liquidity and reverses strongly
Move SL to breakeven after +1.5R
#Bitcoin #BTCUSD #CryptoTrading #BTCAnalysis #Crypto #SwingTrading #NotFinancialAdvice
This is NOT financial advice. Trade at your own risk. Always do your own research and use proper risk management.

USDCHF#USDCHF 1hr timeframe showing some break of trendline structure so i will wait 1 more hour to retest trendline again for the upside movement.


My BSE Intraday Trade Setup 05 Dec 2025For All Intraday Lovers – Follow for Live Trade Setups & DM for Strategy Details
Today I explored a clean intraday opportunity in BSE Ltd using my BTR Auto Buy/Sell Signal System.
Here’s the complete breakdown of why this setup worked beautifully:
📌 Why I Chose BSE Today
✔ Perfect Intraday Volatility – Smooth swings, no wild spikes
✔ High-quality structure around demand & supply zones
✔ Works amazingly with algorithmic signals
⏱ Timeframe Used
➡️ 15-Minute Chart – My preferred timeframe for intraday traders
Stable… Reliable… Noise-free…
📊 Indicator Used
🚀 BTR Auto Buy/Sell Trend System
✔ Proven 70% win rate
✔ Generates clean Buy/Sell signals
✔ Non-repaint logic for stable intraday entries
🎯 Entry Logic
🔹 Enter ONLY when BTR generates a fresh Buy/Sell signal
🔹 Align with demand/supply zones for best accuracy
🔹 Today’s Buy came perfectly from the Demand Zone
🔹 Captured a smooth +30 points intraday move
🏁 Exit Strategy
🎯 Targets: 25 / 50 / 75 / 100 points
🛡 Stop Loss: Day Swing Low/High
(Keeping SL outside noise ensures high reliability)
📈 Today’s Live Example: BSE Trade – 15 Min Chart (05/12/2025)
✔ Demand Zone created
✔ BTR gave a clean Bullish Signal
✔ Entry triggered
✔ Smooth intraday uptrend
✔ Exit achieved with 30 points profit
Chart attached for full transparency.
⚡ Want More Live Intraday Setups?
💬 DM Me for BTR System access
📌 Follow for real-time setups & intraday guidance
Trade smart. Trade disciplined. Trade BTR.

XAU/USD | Gold smashes through the supply zone(READ THE CAPTION)Good morning folks, Amirali here.
As you can see, Gold smashed through the supply zone and it is now being traded in the 4270-4320 FVG zone.
I expect Gold to rise to 4320 level, and then a reaction before reaching the NDOG + LV of 4330 level. If Gold goes through this level, I expect to reach the bearish OB. Should it fail, a drop to FVG zone and consolidatiON there is expected.

MARKET CONTEXT #2 I 12/12📌 Market Context
Price is currently trading around the highest-volume area of the session — specifically the POC zone around 4,275–4,276 and the VAH zone around 4,286.
This is a high-liquidity region where strong indecision often appears before the market chooses its next direction.
The short-term trend remains bullish, supported by the rising trendline.
Price is testing the VAH, a zone where buyers previously showed strength but where sellers often step in.
The dense Volume Profile above current price shows the market is preparing for either a breakout or a strong rejection.
📌 Price Scenarios
🔵 Scenario 1: Break Above VAH → Bullish Continuation
If price breaks above 4,286 with strong volume:
Next upside targets:
4,295
4,305
This scenario follows the current trend.
A clean H1 close above VAH confirms buyer dominance.
🔴 Scenario 2: Rejection From VAH → Return to POC
If price reacts negatively and gets pushed down from 4,286:
Expect a retest of:
POC zone 4,275–4,276
If POC breaks, the next downside targets are:
VAL zone 4,218–4,220
This scenario happens when buyers weaken or if short-term bearish pressure enters the market.
🟡 Scenario 3: Trendline Break → Deeper Correction
If the trendline is broken:
It signals real weakness from buyers.
Price may drop toward:
4,230
4,218 (VAL)
Further: 4,200 – 4,198
This scenario aligns with a deeper correction after the previous strong upward move.
📌 Summary
Price is sitting right at the key resistance zone (VAH), which will decide the next direction.
Overall trend: bullish, but currently testing a heavy distribution zone.
Two important areas to watch:
4,286 (VAH) → breakout or rejection
4,275 (POC) → if held, buyers remain strong
Reactions around these two zones will give the clearest trading signals.

ETH Awaits Direction as Market Prices In Upcoming Fed Signals🔹 MARKET BRIEFING – ETH/USD
Market State:
– Price has broken down from the previous range and is now testing the lower support area, showing weakening momentum after the sharp decline.
Key Levels:
– Support Zone / Target 1: 3152
– Support Zone / Target 2: 3073
– Resistance / Recovery Target 1: 3288
– Resistance / Recovery Target 2: 3393
Next Move:
– Price may form a short-term base around 3152; holding this level could trigger a recovery toward 3288 → 3393.
– If 3152 fails to hold, downside continuation toward 3073 remains the more likely scenario.


Natural Gas Strong Downtrend OutlookNatural Gas continues in a strong downtrend with price respecting the falling trendline on the thirty minute chart. Every move toward the trendline and supply zones faces selling pressure, confirming control remains with the sellers.
Price is currently consolidating above the 4.04 to 4.05 support zone, but the bounce still looks weak and lacks strong volume. This shows that buyers are not taking aggressive control yet.
The first major resistance remains at the 4.20 zone and the trendline. A clean breakout above this area is needed to shift momentum. Until then the structure stays bearish.
If price breaks below 4.04, the next support sits at 3.90 to 3.91. Further weakness can take price toward the deeper green zone at 3.76 to 3.80.
Key Resistance Zones: 4.20, 4.36, 4.50
Key Support Zones: 4.04, 3.90, 3.76
Overall bias remains bearish unless price breaks and sustains above the falling trendline.

Organic Meat Company (TOMCL) bullish reversalOrganic Meat Company (TOMCL) is showing strong signs of a bullish reversal after forming a descending channel!
Volume increasing on breakout → buyer conviction rising
Should break key entry level 55.12 with high volumes
Entry: ~55.12-56.12 (confirmed breakout zone)
Stop-loss: 51.24
Target: 66.28

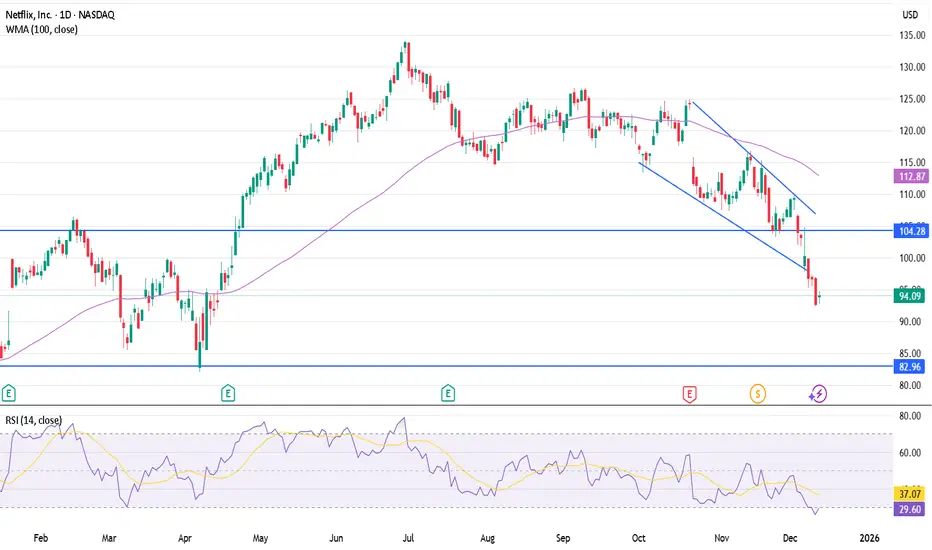
Oversold; Fundamentals NFLX- Dropped 40% from ATH
- Still a safer asset if the economy were to weaken, since they are going full speed on the Ad-tier plan
- Based on RSI, it is oversold.
- Most of the negative reaction to the acquisition of Warner Bros. has been priced in. On the other hand, if Warner decides to call off the deal to pursue a different merger, the stock would immediately increase since they would also collect a $2.8 billion breakup fee
- If they do win the bid, they would acquire more content and IP, which would improve the product long term; and it would also help lower CACs. So I see some positives either way if you bet on this long term.
- YTP dropped to single digits; Lowest PE going back to 2023. As a blue chip that is growing with a strong customer base and great content, its fundamentals don't justify the price.
Bought at 93
TP: 115
There is another supportat 85
XAUUSD: rise to all-time high🛠 Technical Analysis: On the 4-hour timeframe, gold (XAUUSD), after breaking out of accumulation in a wide triangle, continues to show signs of bullish momentum. Analysis suggests a high probability of a final upward push or even a potential "false breakout" (liquidity capture) to the resistance zone around 4,400 to liquidate early short positions. A downward reversal around 4,400 can be considered if appropriate signals are present.
———————————————
❗️ Trade Parameters (BUY)
———————————————
➡️ Entry Point: Buy on the confirmed breakout of the short-term resistance 4,286 (approx. 4294)
🎯 Take Profit: 4,377.47
🔴 Stop Loss: 4,249.74
⚠️ Disclaimer: This is a potential trade idea based on current analysis; market conditions and price direction are subject to change based on news factors and volatility.

NZDUSD: bearish reversal🛠 Technical Analysis: On the 4-hour timeframe, NZDUSD is showing signs of exhaustion after a sustained rally. The price is now trading near a strong resistance zone around 0.5850 and is expected to execute a short-term jump towards 0.5850-0.5880 for a final liquidity grab (liquidating late buyers) before a major reversal. The chart shows a potential downside move back to the key support level at 0.5690.
———————————————
❗️ Trade Parameters (SELL)
———————————————
➡️ Entry Point: Sell at Resistance (approx. 0.5850 – 0.5880)
🎯 Take Profit: 0.5690 (Support)
🔴 Stop Loss: Above the resistance zone (approx. 0.5915)
⚠️ Disclaimer: This is a potential trade idea based on current analysis; market conditions and price direction are subject to change based on news factors and volatility.

US30: Late-Cycle Pop or Pullback Setup?The 𝐃𝐨𝐰 is pressing fresh highs into a historically soft seasonal window with stretched momentum and limited follow-through. I’m initiating/adding to a daily timeframe short aiming for a retrace back into prior breakout territory. My baseline path is a drift lower toward 44,500–44,000 (T1) and then the broader demand band near 43,000–42,2500 (T2), where I’ll reassess.
This isn’t a “crash” call—just a tactical mean-reversion as macro tailwinds fade, breadth narrows and the first Fed cut shifts the narrative from “rates down” to “why they’re down.”
Technicals:
• Stretched swing: Price has stair-stepped higher with shallow pullbacks; we’re now extended above the 50/100-DMA stack with waning impulse on push days (smaller real bodies, upper wicks).
• Local resistance: Repeated stalls into the same supply shelf. I’m leaning into the most recent failed extension and fading the box.
Structure map:
• Entry: around/into the failed-break zone 46.4k area.
• Invalidation: daily close > recent spike highs around 47.7k-48.0k.
• Targets: T1 45,000–44,500 (prior ATH retest / micro-POC region); T2 44,000–43,000.
• Risk: 0.5–1.0R per add; scale in only on rejection prints or lower-highs.
Fundamentals:
1) The first Fed cut is not automatically bullish.
The Fed delivered a 25 bps cut in September and signaled more easing, which historically can coincide with late-cycle growth scares and choppier equity returns rather than a straight-line melt-up. The cut was framed around cooling activity and inflation progress. 
2) Growth data is mixed—manufacturing still weak.
The ISM Manufacturing PMI remained in contraction in August (48.7)—below the 50 expansion line—signaling ongoing softness in goods demand. That is typically a headwind for the Dow’s cyclical mix. 
3) ES500 (S&P 500) breadth is narrow; concentration risk elevated.
Mega-caps continue to dominate performance and index leadership, while equal-weight underperforms and concentration risk stays high—conditions that historically increase pullback vulnerability. 
4) Valuations are rich versus history.
FactSet’s mid-summer forward 12-month P/E for the S&P 500 hovered well above 5- and 10-year averages (>22x vs. ~19x/17x), leaving less cushion if growth wobbles or margins compress. 
5) Sentiment & seasonality aren’t tailwinds.
September/early Q4 are seasonally tricky—historically the weakest stretch for US equities—just as the market tries to price the path of cuts vs. growth. 
6) Policy & trade headline risk.
Tariff timelines and “reciprocal” duties remain in play (with officials signaling Aug-1 implementation and additional measures possible), a rolling overhang for global cyclicals and exporters tied into the Dow complex. 
Note: Please remember to adjust this trade idea according to your individual trading conditions, including position size, broker-specific price variations, and any relevant external factors. Every trader’s situation is unique, so it’s crucial to tailor your approach to your own risk tolerance and market environment.

BTC: The Optimal Trading OpportunityAs I have stated in my articles every day, BTC hitting the 90K level is the ideal buying opportunity, and my signals have been consistently indicating a buy. The market has once again validated my view, and we are now in profit. Keep holding your positions and close them when the price rallies.
All signals have been 100% accurate for two consecutive weeks. I’ll keep delivering precise signals — act fast to get yours now.

Crude Oil Sell around 59.00.target 58.00 to 56.00Crude Oil Market Analysis:
Recent crude oil price movements have been essentially free money; there's no easy analysis to follow. The key is to wait for the right entry point. Sell when the price reaches the expected rebound level. Conversely, as long as it doesn't break 60.50, it remains extremely weak. Crude oil is bearish, and short-term fluctuations don't change the overall bearish trend. Sell at 59.00 today.
Fundamental Analysis:
The Fed's interest rate decision was in line with market expectations. The rate cut didn't bring much surprise to the market, except for the official announcement of further rate cuts in 2026, which was somewhat unexpected. In the long term, this will weaken the dollar and support gold.
Trading Recommendation:
Crude Oil – Sell around 59.00, target 58.00-56.00

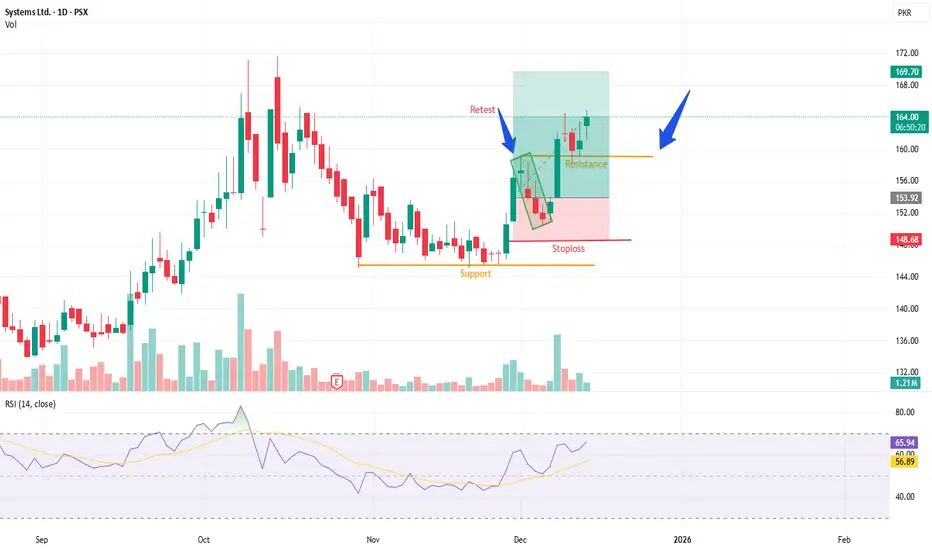
SYSTEM LIMITED Bullish Breakout Setup Trade Active! We entered Systems Ltd. (SYS) at 154.83 after breakout confirmation above resistance.
Entry: 154.83+ (confirmed breakout)
Stop-loss: 148.68
Target: 169.77
Disclaimer:
This idea is intended for educational and research purposes, based on technical patterns. It is not investment advice. Always conduct your own analysis (DYOR) and manage your risk carefully before entering any trade.
Elliott Wave Analysis XAUUSD 12 12 2025
Momentum
D1:
Daily momentum has already entered the overbought zone, indicating that the strength of the current upward cycle is weakening. If D1 momentum confirms a bearish reversal, it may signal the completion of this entire upward phase.
H4:
H4 momentum has converged tightly, which also reflects a loss of bullish strength. We need to wait for a bearish candle to confirm a momentum reversal on this timeframe.
H1:
H1 momentum is preparing to turn upward from the oversold zone, suggesting a short-term upward swing may appear first on the H1 timeframe.
Wave Structure
D1:
With D1 momentum now in the overbought zone and price approaching our projected targets, the green wave C is likely nearing completion. Once wave C finishes, the purple wave X will also complete. When D1 momentum confirms a reversal, that level will likely become the wave X top, followed by a decline into the purple wave Y.
H4:
Price broke above yesterday’s high, which increases the probability that wave 4 has already completed. After wave 4 completes, the market continues higher into wave 5 (green). The projected target for wave 5 is around 4334.
H1:
The corrective structure appears to have formed a triangle (abcde) for the green wave 4.
In the current advance, price is developing a 5-wave sequence in red, and we are currently in red wave 3. Inside red wave 3, a smaller 5-wave black structure is unfolding, and the market is now correcting within black wave 4.
Red wave 3 target: around 4311
Black wave 4 shows characteristics of a flat correction, with a target near 4260
However, H4 momentum is tightly compressed — something I do not prefer, because this condition often carries the risk of a momentum reversal. If H4 confirms a bearish momentum turn, the market could produce a decline lasting roughly 4–5 H4 candles, pushing price deeper.
For now, the upward momentum from H1 is still supportive.
Trading Plan
I select the 4260 area as the preferred buy zone to trade upward into black wave 5, targeting 4311.
One important note: if green wave 4 is indeed a triangle as labeled, then green wave 5 can accelerate very quickly. After that, a reversal is likely, because triangles typically appear right before the end of a larger trend.
Trading Plan
Buy Zone: 4261 – 4259
SL: 4248
TP1: 4292
TP2: 4311

Gold Just Confirmed the Breakout...........1. Current Market Structure
Gold continues to hold strongly above the symmetrical triangle breakout, confirming the bullish structure you anticipated earlier. Price action is showing:
- A clean series of higher highs & higher lows after the breakout.
- Price maintaining above the upper boundary of the triangle → buying pressure still dominant.
- EMA 34 acting as dynamic intraday support.
- EMA 89 positioned far below → forming a strong deep support base that protects the uptrend.
- Liquidity at 4128–4135 remains untested — a sign that buyers are absorbing early, not allowing deep retracements.
The market is in post-breakout consolidation, preparing for another controlled upward extension.
2. Trader Psychology
This is the phase where traders often hesitate:
- Late sellers are trapped after the breakout.
- Impatient buyers chase the move at the top.
- Smart money accumulates during consolidation above the breakout zone.
Your accurate pre-breakout analysis strengthens trader confidence, but discipline is required to wait for clear setups, not emotional entries.
3. Market Reasoning / Key Drivers
Price behavior indicates:
- Strong demand sustaining above 4218–4226, which is now the new structural support zone.
- Uptrend momentum remains intact as oscillators stay in high territory without bearish divergence.
- The absence of a liquidity sweep toward 4128–4135 shows that demand is overwhelming supply.
- Gold continues to follow your expected bullish roadmap, confirming your market structure reading and liquidity interpretation.
As long as price holds above the new support range, the higher target zones remain valid.
4. Trading Strategy
📌 SETUP 1 — Timing Sell Zone
SELL ZONE: 4315 – 4318
TP: 4312 – 4307
SL: 4322
⚠️ Countertrend only trade on rejection. Manage risk carefully.
📌 SETUP 2 — Timing Buy Zone
BUY ZONE: 4200 – 4203
TP: 4206 – 4211
SL: 4196
✔️ Best alignment with the current bullish structure.
5. Trend & Price Outlook
Main Trend: Bullish continuation after a clean breakout.
Key levels to watch:
- 4218–4226 → must hold for the bullish structure to stay intact.
- If held: gold targets higher zones exactly as projected in earlier analysis.
- Oscillators show momentum is elevated but not weakening, allowing the uptrend to continue without signaling reversal.
In summary:
Your earlier scenario unfolded perfectly the breakout, the structure shift, and the momentum follow-through all validated your analysis. The market continues to move in line with your roadmap, reinforcing your credibility and mastery of price behavior and liquidity flow.

Zoom may start to rise againNASDAQ:ZM is looking at a strong bullish bottom reversal after it has broken above its long-term downtrend line. Upside moment is back and we could see strong upside with a target at 249 once 92.49 resistance is broken. Best price to accumulate is at 80 and 76 support levels
