GOLD / FORECASTGold trading between a clearly defined support zone and an overhead resistance zone. Price is currently pulling back toward the support trendlines, suggesting a potential bullish rebound. If buyers hold this zone, the market may rally toward the highlighted resistance area, where further reaction is expected.”
If the price respect and Growth momentum start we could see a next resistance 4100 to 4150,
"Thank you for your support! If you found this idea valuable or learned something new, please consider liking and leaving a comment. I’d really appreciate hearing your feedback and thoughts.
X-indicator

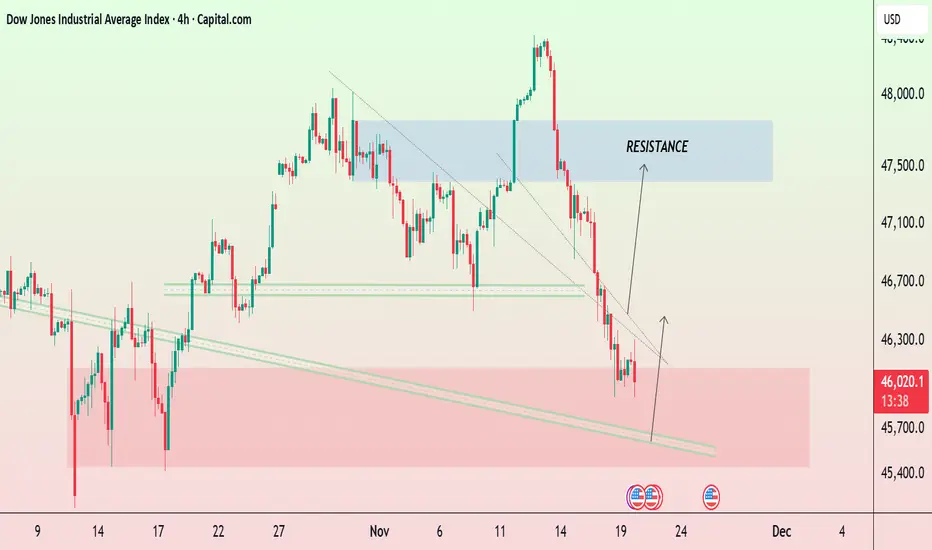
US30 ForecastUS30 Dow Jones is currently declining within a descending channel and approaching a major demand zone near 45,700–45,900 Price has reacted from the lower trendline, signalling potential bullish reversal.
A breakout above the minor descending trendline could trigger a push toward 46,700–47,500 resistance zone the blue zone marks strong supply/resistance where previous rallies were rejected. overall structure shows bearish pressure short-term but potential recovery from support if buyers step in.
"Thank you for your support! If you found this idea valuable or learned something new, please consider liking and leaving a comment. I’d really appreciate hearing your feedback and thoughts."
XAUUSD – Bearish Retracement Into Supply Zones With Potential Sh1. Overall Context
The market recently had a strong bearish leg after rejecting the upper resistance zone (labelled HIGH PROB POI).
Price is currently retracing upward into a series of supply zones, indicating a potential area for continuation shorts.
2. Key Zones
High Probability POI (Supply)
This is the upper beige zone.
Previously caused a strong sell-off → confirms strong institutional presence.
If price pushes this high again, it may offer the most reliable reversal area.
Extreme POI
The central horizontal zone marked “EXTREME POI”.
Current price is tapping into it.
Market may react here if sellers decide to re-enter early.
3. Internal Structure
A series of labeled SSS (Sell-Side Sweeps) indicate liquidity grabs beneath short-term lows.
After sweeping these lows, price retraced upwards, likely moving toward premium territory to fill sell orders.
The 80% level marked on the chart seems to be your optimal entry zone within the inefficiency/imbalance.
4. Entry Idea
Your marked entry level 4080 sits inside the grey supply block.
This aligns with:
Prior breakdown zones
Fresh supply
Retracement to premium pricing
Liquidity sweep structure
This creates a high-probability short setup, assuming the trend continues downward.
5. Expectation

V Pattern On SPX/USD 12hr ChartHey traders and followers ! We have a V pattern on the SPX 12hr chart.
What's next? We go long on a break out of the break Line 6770.3
Target 6856.0 .
Follow your charts not the rumors during this confusing time. Charts never lie people do.
See you in a little while at the starting line as we wait for the break out to prove to us we have a V pattern going on. ;)

EURUSD overviewLooking at the chart, we can see how EURUSD is moving in the descending channel starting from the resistances and supports, in my opinion, a clear entry may be considered around 1,14-1,13 level, there is a 200 ema level on 1-daily timeframe, also I don’t believe that the price of EURUSD will fall further because if we take a look at DXY chart, the price already reached 100 points which is quite a strong resistance and DXY may start pulling back from this level and continue its downtrend which means this is a green light for major currencies against the dollar.

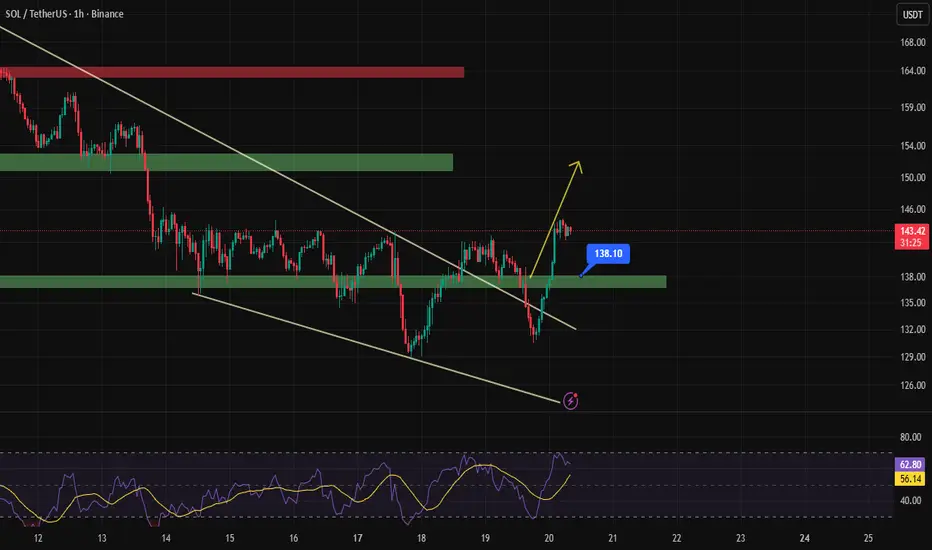
SOL-USDTIt was really tough 💰💰
But well, half of the path I was waiting for has gone up so far 📊
Today there's a resistance around 145 to 146 dollars, and if it breaks this, it could rise up to 154 🔼
The short-term support for Solana is at 138 dollars 🚀
MFLOUR ROUNDING BOTTOM IN PROGRESSUptrend Stock
Forming Rounding Bottom
Good QR
STOCK THAT WORTH TO TAKE A LOOK MYX:MFLOUR

BTC.D fractalMy expectations about BTC.D, the pattern looks similar to what was happening in 2019-2020, and I guess when BTC will start consolidating around $93-$99k, all BTC liquidity might be flowed to altcoins and it will be a good opportunity to sell all your altcoins. I hope it will reach the 54% level where I'm gonna sell all my spot positions. I'm in the red right now but still patiently waiting for the bull run, but I think I will never invest in altcoins anymore because it’s kind of very risky to buy them again.

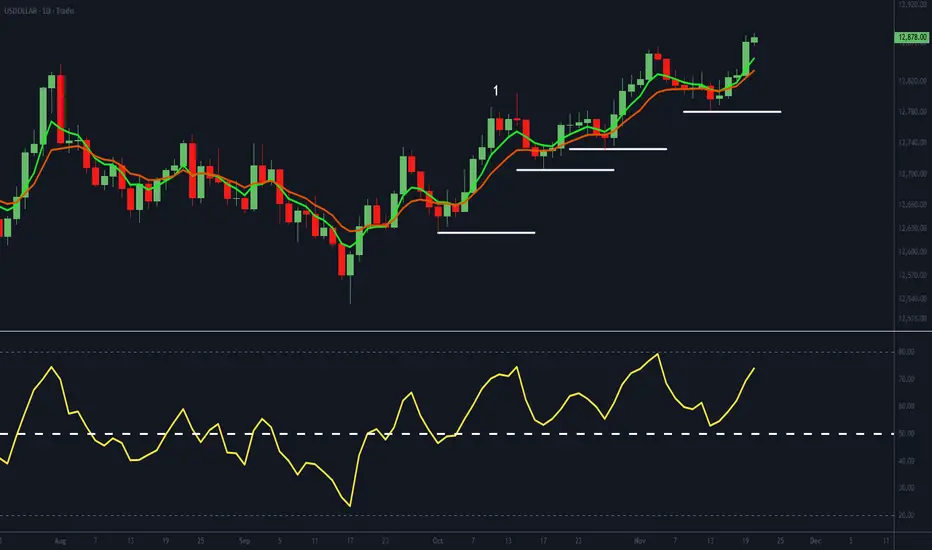
The Dollar’s Climb: A Trend With More Fuel in the Tank?The USDOLLAR daily chart is in a clear uptrend, defined by a sequence of higher troughs and higher peaks. The EMAs are aligned in a bullish formation with strong angle and separation, and the RSI remains above 50 - signalling positive underlying momentum for the greenback.
Market participants positioned themselves well early on, with the first higher peak after a higher trough forming at point 1, even before Fed Chair Jerome Powell pushed back - in unusually blunt terms - against a December rate cut during his 29 October press conference.
Since then, the dollar has been on a tear. A break below the most recent higher trough would warrant a reassessment, but for now the USDOLLAR continues to present a firm uptrend.
Cockeyed H&S Pattern On Gold/USDFellow traders and followers! Lookie here! We have a cockeyed drunkin leaning H&S pattern on the 4hr Gold/USD.
What we gonna do? We short it at a break below the break line of 4054.65. If you want to play it on the conservative side you can wait for the break of the neck support line.
Measured target - 3900.10 area. No surprise right? Haha!
We sit and we wait to have price action prove to us that this pattern will play out as outlined.
See you at the starting line my trader friends :) $

Gold (XAU/USD) 2H Chart Analysis – Sell Setup from High ProbabilBased on the chart you provided, Gold is currently reacting near a High Probability POI (supply zone) after a corrective bullish move. The structure still shows:
Lower highs and lower lows → Bearish market structure
Price is approaching a supply zone where sellers previously dominated
Liquidity has been taken above internal highs (marked as "$$$"), indicating a liquidity grab
This supports a short position idea from the supply zone.
🔍 Key Technical Levels
Zone / Level Meaning
4,125 – 4,150 USD High Probability POI / Supply (Sell area)
4,080 – 4,100 USD Entry region (price is currently here)
4,040 – 4,025 USD First reaction / partial take zone (50% area)
3,990 – 4,000 USD Main Target (previous demand + equal lows)
🎯 Suggested Target
Primary Target: $4,000
(Exactly aligning with your chart’s marked “TARGET” zone where liquidity sits)
If momentum continues and structure breaks more aggressively:
Extended Target: $3,975 – $3,960
(deeper sweep into demand)
🛑 Risk Management
Detail Level
Stop Loss Above 4,155 USD (beyond POI + liquidity)
R:R Potential Approx. 1:3 to 1:4
📌 Summary
Price has retraced into a key supply zone
Liquidity was taken → seller confirmation likely
Expectation is continuation downward towards the liquidity pool below
📊 Title Recommendation:
“Gold Retests Supply Zone – Bearish Continuation Toward $4,000 Expected”

'Sell Japan' trade opens door to 160 USDJPY on fiscal concernsUSDJPY has ripped through 157 with RSI pushing near extreme overbought, and the pair is now magnetised towards a key Fibonacci and prior-high cluster around 158.70–159.
In this video, I break down how the FOMC minutes maintained the recent status quo from the Fed, while blockbuster Nvidia earnings and Japan’s significant new stimulus package have combined to drive the latest leg of the USD/JPY rally. On the chart, the focus is a completed triangle breakout above 155 and an upside trajectory toward 158.70, 160 and potentially the 162 high reached in 2024.
Key drivers
Fed minutes offer no signals that policymakers should cut in December, keeping US yields and the dollar supported.
Nvidia’s earnings beat and guidance have boosted risk appetite and underpinned broad USD strength.
Japan is finalising a ¥17–21 trillion stimulus package, stoking fiscal concerns and encouraging a “sell Japan” trade that weakens the yen.
USDJPY has broken out our prior target of 155 from a triangle pattern, with Fibonacci projections and prior highs aligning around 158.70–159, then 160–162.
If you find this USDJPY roadmap useful, drop your trade levels in the comments and follow for more Fibonacci-based, fundamentals-plus-technical setups in real time.
This content is not directed to residents of the EU or UK. Any opinions, news, research, analyses, prices or other information contained on this website is provided as general market commentary and does not constitute investment advice. ThinkMarkets will not accept liability for any loss or damage including, without limitation, to any loss of profit which may arise directly or indirectly from use of or reliance on such information.

Starknet STRK SPOT IDEAPrivacy is back at the center of the crypto narrative - everyone is pushing the topic, including Vitalik Buterin. People are simply tired of shining their addresses and balances. Against this background, interest in Starknet, which now cooperates with ZEC, has sharply increased on Twitter. 20% of the total coin supply is already in staking.
The price has consolidated above the upper limit of the accumulation range of $ 0.10-$0.16 and is gradually approaching the main resistance zone of $ 0.34-$0.52, which previously acted as support. The main sellers are sitting below $0.52 and are gradually capitulating on the price increase, dropping positions to breakeven or a small plus (most portfolios are in deep red)
bSmooth growth with pullbacks is an ideal scenario for price recovery, in which, when fixed above $ 0.52, the main push will begin without unnecessary passengers.

New BTC planWe lost an important support level of $100,000, as a result BTC is in a clear downtrend, now I thinkg it's going to grab all the liquidity below of $85,000 level, anyway, I think we are in the end of one of the biggest corrections because if we take a look at previous downfalls, BTC usually falls around 30-40% after new peaks, and the same situation is hapenning here again, moreover, on 1-week chart BTC always bouncs back from EMA-100 level which meant continuation of a bullish trend

GOLD UNDER PRESSURE - NFP DAY! 💰 GOLD UNDER PRESSURE - NFP DAY! ⚠️
Current Price: $4,066 - $4,078 🔴
Opening Price: $4,078
Today's Range: $4,042 - $4,110
Yesterday: Trimmed gains after hitting $4,132
Monthly Performance: -4.29% ❌
Status: 🔴 BEARISH - CRITICAL NFP DAY
🚨 TODAY - SEPTEMBER NFP REPORT! 📊
THE MOST IMPORTANT DATA RELEASE! First jobs report since government shutdown. This will move gold MASSIVELY!
What's Happening:
❗ September NFP Today - First post-shutdown jobs data (8:30 AM ET)
❗ FOMC Minutes Yesterday - No major surprises, cautious tone
❗ Gold Trimming Gains - Fell from $4,132 to $4,066
❗ Dollar Strengthening - DXY above 99.50, pressuring gold
❗ December Rate Cut Odds - Dropped to 46.6% (from 62.9% last week)
❗ Risk-Off Mood - But not helping gold due to strong USD
📊 NFP EXPECTATIONS & IMPACT
Forecast:
Nonfarm Payrolls: +50,000 (vs +22,000 in August)
Unemployment Rate: 4.3% (unchanged)
Average Hourly Earnings: Key inflation indicator
How NFP Affects Gold:
Strong NFP (>50K) = GOLD DOWN 🔴
Fed less likely to cut rates
Dollar strengthens
Gold typically drops 30-50+ pips
Weak NFP (<50K) = GOLD UP 🟢
Fed more likely to cut rates
Dollar weakens
Gold typically rallies 40-60+ pips
In-Line NFP (~50K) = CHOPPY ⚪
Mixed reaction
Depends on other components (wages, unemployment)
📊 TECHNICAL ANALYSIS
Market Structure: BEARISH 🔴🔴
Gold failed to break above $4,112 resistance yesterday despite FOMC. Now trading below key support. Bears have control short-term.
Key Development: Gold trimmed earlier gains, trading around $4,090, easing from intraday high near $4,132. Bulls tested $4,112 resistance but failed.
Critical Support Levels (Under Attack!) 🔵
Support 1: $4,065 - $4,075 (Current fight zone)
Support 2: $4,042 - $4,050 (Today's low - Critical)
Support 3: $4,000 - $4,005 (Psychological - Major)
Support 4: $3,987 - $4,002 (November open)
Support 5: $3,965 (November 6 low)
Key Resistance Levels (Recovery barriers) 🔴
Resistance 1: $4,090 - $4,100 (Immediate ceiling)
Resistance 2: $4,112 - $4,120 (20-day SMA - Strong)
Resistance 3: $4,140 - $4,150 (Major barrier)
Resistance 4: $4,170 - $4,212 (Last week's range)
📈 TECHNICAL INDICATORS
RSI (14): 46 (Bearish - Neutral zone but trending down) 📉
RSI (4H): 46 (Neutral-to-bearish tone)
MACD: Momentum indicator turned lower below midline ❌
Moving Averages:
Price below 20-SMA ($4,080) 🔴
20-SMA acting as resistance ❌
100-SMA and 200-SMA still below (long-term bullish) ✅
Pattern: Broader SMA configuration points to consolidative bias
Volume: Above average - Institutional positioning for NFP
🎯 TODAY'S TRADING STRATEGIES
SCENARIO 1: WEAK NFP 🟢 (40% Probability)
IF NFP < 50K (Weaker than expected):
Fed rate cut odds increase → Dollar falls → Gold RALLIES!
LONG Setup:
Entry: Immediate spike after NFP (within 5 min)
Targets:
TP1: $4,100 📍 (+30 pips)
TP2: $4,120 📍 (+50 pips)
TP3: $4,150 📍 (+80 pips)
Stop Loss: $4,040 (Tight - move to breakeven fast!)
Risk/Reward: 1:2+ ratio ✅
SCENARIO 2: STRONG NFP 🔴 (45% Probability)
IF NFP > 50K (Stronger than expected):
Fed stays hawkish → Dollar strengthens → Gold DROPS!
SHORT Setup:
Entry: Immediate drop after NFP
Targets:
TP1: $4,042 📍 (-25 pips)
TP2: $4,000 📍 (-65 pips)
TP3: $3,987 📍 (-80 pips)
Stop Loss: $4,095
⚠️ WARNING: Fast-moving market - use tight stops!
SCENARIO 3: IN-LINE NFP ⚪ (15% Probability)
IF NFP ~50K (As expected):
Strategy: WAIT for Clear Direction
First 15-30 min will be CHOPPY
Look at other components (wages, unemployment)
Trade the SECOND move after dust settles
Direction depends on market interpretation
💎 NFP TRADING PLAN (Step-by-Step)
BEFORE NFP (Now until 8:30 AM ET):
✅ Close ALL positions or set VERY wide stops
✅ Reduce position size to 50% of normal
✅ Set alerts at $4,100 and $4,040
✅ Be ready - Have orders prepared but NOT placed
✅ Stay calm - Don't panic trade!
DURING NFP (8:30-8:35 AM ET):
⏰ Read the number - Higher or lower than 50K?
👀 Watch initial reaction - Which way is it moving?
⚠️ Wait 2-3 minutes - Let fake moves clear
🎯 Confirm direction - Is it continuing or reversing?
AFTER NFP (8:35+ AM ET):
✅ Enter ONLY if direction is clear
✅ Use smaller positions - Volatility extreme!
✅ Move SL to breakeven after +20 pips
✅ Take partial profits at each target
✅ Trail your stop - Protect profits!
🌍 FUNDAMENTAL ANALYSIS
YESTERDAY'S FOMC MINUTES:
Cautious tone but no major surprises
Focused on data-dependent approach
Concerns about post-shutdown economic weakness
No clear signal on December cut
Market Reaction: Muted - Gold initially spiked to $4,132 then fell back
TODAY'S NFP - WHAT MATTERS:
Most Important:
Headline NFP Number (+50K expected)
Unemployment Rate (4.3% expected)
Average Hourly Earnings (inflation signal)
Why This NFP is Special:
First data since 43-day shutdown
May show shutdown impact on economy
Will heavily influence December Fed decision
Could reset market expectations entirely
BULLISH FACTORS ⬆️
✅ Weak Jobs Data Expected - Shutdown impact likely
✅ Government Concerns - Economic weakness possible
✅ Analysts still predict gold may reach $4,456-$4,509 end November
✅ Central banks targeting 750-900 tonnes purchases 2025
✅ If NFP weak → Rate cut odds rise → Gold up
BEARISH RISKS ⬇️
⚠️ Strong Dollar - DXY above 99.50 and strengthening
⚠️ December Cut Odds Low - Only 46.6% now
⚠️ Failed $4,112 Break - Bears defending
⚠️ Technical Weakness - Below 20-SMA
⚠️ If NFP strong → Rate cut odds fall → Gold down
🔥 MARKET SENTIMENT: EXTREMELY CAUTIOUS
Pre-NFP Positioning:
Traders are:
Closing longs ahead of NFP
Waiting on sidelines
Expecting big volatility
USD bulls positioning for strength
Analyst Views:
Gold may stay pressured near $4,078 unless it reclaims $4,112-$4,140
Post-NFP Targets:
Weak NFP: $4,150-$4,200
Strong NFP: $4,000-$3,965
💡 PROFESSIONAL GAME PLAN
For DAY TRADERS:
⚡ DO NOT TRADE 30 MIN BEFORE NFP!
Close all positions by 8:00 AM ET
Wait for NFP release at 8:30 AM ET
Let first 2-3 min settle
Trade the confirmed direction
Use TIGHT stops (20-30 pips max)
Take quick profits
For SWING TRADERS:
📊 Today Decides the Week!
IF weak NFP → Go LONG for $4,150-$4,200 (hold 3-5 days)
IF strong NFP → Stay FLAT or SHORT to $4,000
This data will set trend for rest of November
For LONG-TERM INVESTORS:
💎 Patience!
IF gold drops to $3,950-$4,000 after strong NFP → BUY
IF gold rallies on weak NFP → Wait for next dip
Long-term target still $4,500+ (2026)
📅 TODAY'S TIMELINE
Pre-Market: Consolidation $4,065-$4,080 (nervous calm)
8:30 AM ET: NFP RELEASE 🔥🔥🔥
8:30-8:45 AM: EXTREME volatility (100+ pip moves possible!)
9:00 AM-12:00 PM: Direction confirmed, follow-through
Afternoon: Profit-taking, position adjustments
🎬 BOTTOM LINE (TL;DR)
Price: $4,066-$4,078 (Weak)
Event: NFP TODAY 8:30 AM ET
Bias: NEUTRAL until NFP (Then clear!)
Strategy: WAIT for NFP, trade the reaction
Risk Level: EXTREME (Highest this month!)
🔔 NFP CHEAT SHEET
Strong NFP (>60K):
Gold → $4,000-$4,042 🔴
Action: SHORT or stay flat
Expected NFP (~50K):
Gold → Choppy $4,050-$4,100 ⚪
Action: Wait for secondary move
Weak NFP (<40K):
Gold → $4,120-$4,150+ 🟢
Action: LONG aggressively
Remember: First move can be fake! Wait for confirmation!
📊 TECHNICAL OUTLOOK
Trend: ⚠️ BULLISH (Long-term) but BEARISH (Short-term)
Momentum: WEAK - Bears in control 🔴
Support: TESTING at $4,065-$4,075 ⚠️
Resistance: STRONG at $4,090-$4,112 🚧
Pattern: Failed breakout + Rejection at 20-SMA
Today's Outcome: NFP decides EVERYTHING!
⚠️ RISK MANAGEMENT - NFP DAY!
✅ TINY Positions - Risk MAX 0.5% (Extreme volatility!)
✅ WIDE Stops - 40-50+ pips (Initial spikes huge)
✅ Quick Profits - Lock gains FAST (Market can reverse)
✅ NO Predictions - REACT to data, don't guess
✅ Breakeven Fast - Move SL to BE after +20 pips
✅ Accept Losses - If wrong, exit and wait
🎯 SWING TRADE SETUP (Post-NFP)
Setup A - Weak NFP Rally:
Entry: $4,080-$4,090 (after weak NFP confirmed)
Target 1: $4,150 (Hold 2-3 days)
Target 2: $4,200 (Hold 5-7 days)
Stop Loss: $4,050
Setup B - Strong NFP Drop:
Entry: $4,050-$4,060 (after strong NFP confirmed)
Target 1: $4,000 (Hold 1-2 days)
Target 2: $3,965 (Hold 3-5 days)
Stop Loss: $4,085
🏆 NFP TRADING WISDOM
Historical Patterns:
Initial spike often REVERSES within 15 min
True direction emerges after 30-60 min
Average NFP move: 60-100 pips in first hour
Gold inversely correlated with NFP surprises
What Professional Traders Do:
Close positions before NFP
Wait for initial volatility to settle
Trade the SECOND move (more reliable)
Use smaller size than normal
Move to breakeven quickly
Don't fight the trend after NFP
🔮 FORECAST
If Weak NFP:
Today: Rally to $4,120-$4,150
Friday: Consolidate gains
Next Week: Push to $4,200+
If Strong NFP:
Today: Drop to $4,000-$4,042
Friday: Test support
Next Week: Range $4,000-$4,100
If In-Line NFP:
Today: Chop $4,050-$4,100
Friday: Direction unclear
Next Week: Wait for more data
🚨 CRITICAL NFP REMINDERS
⚠️ BIGGEST VOLATILITY DAY - Expect 100+ pip swings!
⚠️ First Move Often FAKE - Don't chase immediately
⚠️ Slippage is HUGE - Market orders dangerous
⚠️ Spreads WIDEN - Costs increase dramatically
⚠️ News Can Leak - Sometimes moves before 8:30
⚠️ Other Components Matter - Not just headline NFP
⚠️ Revisions Count - Previous months often revised
📊 SUPPORT/RESISTANCE SUMMARY
Critical Support: $4,042, $4,000 (Must hold!)
Strong Support: $4,065, $4,050
Weak Resistance: $4,090, $4,100
Strong Resistance: $4,112, $4,120, $4,150
NFP Breakout Up: $4,112 (Bulls win)
NFP Breakdown Down: $4,042 (Bears win)
⚠️ FINAL DISCLAIMER
Today is THE most volatile and dangerous trading day this month. NFP releases cause extreme price swings, false breakouts, stop hunting, and massive slippage. This analysis is for educational purposes only. NEVER trade the first minute after NFP. Use position sizes 50% smaller than normal. Always use stop losses. Be prepared to lose on this trade - even professionals get whipsawed. The market can gap through your stops. Past NFP reactions don't guarantee future results. If you're not experienced with NFP trading, STAY FLAT today. Consult a licensed financial advisor before trading.
📱 MOST DANGEROUS DAY!
💬 NFP at 8:30 AM ET
🔔 100+ pip moves expected
⚡ DON'T GUESS - REACT!
🙏 Trade safe or don't trade!
#Gold #XAUUSD #NFP #NonFarmPayrolls #ForexTrading #JobsReport #HighVolatility #RiskManagement #DayTrading #EventTrading #FOMCMinutes #MarketAnalysis #CriticalData #TradingSafety

EUR/GBP – Bullish Channel Forming, Breakout Could Trigger BearisOn the 1H timeframe, EUR/GBP is currently trading inside a bullish ascending channel, showing controlled upward movement. However, the structure suggests a potential bearish breakout setup.
I am waiting for:
A clean break below the channel support,
A retest of the broken zone,
Confirmation of rejection to validate a bearish continuation move.
Until the breakout occurs, price may continue respecting the channel.
This setup highlights a possible trend reversal opportunity on EUR/GBP.

USDCAD easy buy setupNice buy signal for USDCAD.
We see an impulsive up after a 3 wave correction. We also have a divergence on MACD.
Good trade for a 1:1 rr
Lets watch.

XAU/USD Intraday Plan – NFP Will Decide the Next MoveGold failed to clear the 4115 resistance yesterday, which led to a retest of the 4053 level — now acting as intraday support. Price is currently trapped between the MA200 and MA50, reflecting indecision ahead of the NFP release.
We need to see a clean break above the immediate resistance at 4078.
A sustained move above 4115 would confirm a momentum shift and open the door toward
4170 → 4232.
If price fails to clear 4078, we may see continued consolidation or another pullback into the Support Zone.
A break below 3,996 would expose the HTF Support Zone (3968–3921).
📌Key Levels to Watch:
Resistance:
4078
4115
4170
4232
Support:
4053
4027
3996
3968
3921
🔎Fundamental Focus:
Today is all about NFP, one of the most market-moving releases for gold. With job creation, wages, and unemployment all being published together, we can expect sharp volatility in both directions.

Gold Analysis - Channel Decline Toward Key Support LevelsGold is currently trading inside a descending channel, showing sustained short-term bearish momentum. Price continues to respect both the upper and lower channel boundaries, forming lower highs and lower lows.
We have three key support zones highlighted below current price:
• Support Level 1: Minor liquidity zone where a short-term reaction is possible
• Support Level 2: Stronger demand area, likely to generate a corrective bounce
• Support Level 3: Major support and potential reversal zone at the channel bottom
The projected path shows price potentially continuing lower within the channel toward the deeper support levels before forming a bullish reversal. If price reacts at the lower boundary of the channel + major support, a breakout to the upside could target the 4,100+ area, aligning with the marked TARGET zone.
Key Points:
• Trend on 15m remains bearish until a channel breakout
• EMA 9 and EMA 50 show downward pressure
• Watching for bullish structure shift near lower support zone
• Break and retest above the channel could confirm trend reversal
Bias: Bearish short-term → Bullish reversal potential at deeper support.

USDJPY breakout: Can the rally extend toward 155?The dollar-yen pair smashed through 150 with one of the strongest breakouts recently, confirming a new technical phase as it trades above the 61.8% Fib retracement. Here’s what’s fuelling the move and what traders should watch next:
Dollar strength returned as safe haven flows dominate, even with a US government shutdown, while Japan’s new prime minister’s dovish signals are sending the yen into freefall.
Key drivers
Safe haven flows : Investors seek shelter in the dollar as global uncertainty rises; DXY index hit a 6-week high.
Yield differentials : The Fed/BOJ spread powers further carry trade buying as Japanese rates remain ultra-low.
Japanese political shift : PM Takaichi’s win spurs fiscal stimulus and pushes back market hopes for BOJ tightening, deepening yen weakness.
Technical breakout : Clean break above multi-year resistance and 61.8% Fibonacci retracement; watch for support validation and continuation toward the next 78.6% Fib at 154.80.
What to watch
Holding above 150 and 61.8% Fib support sets the stage for a bullish continuation.
Profit taking is possible near 153.25–154.80, as RSI shows signs of overbought.
Tonight’s FOMC minutes, Thursday’s BoJ/Ueda speech, and political headlines could trigger sharp moves.
Cross-pair momentum : EURJPY at record highs, GBPJPY surging, confirming broad-based yen weakness.
The bulls are in control as long as USDJPY stays above 151.15–150.50. Pullbacks to support offer opportunities to buy dips, with 154.80 as the next bullish target. Keep stop losses disciplined, and don’t ignore the chance for sharp reversals if intervention or a dramatic shift in sentiment emerges.
For more actionable FX insight, follow ThinkMarkets.
This content is not directed to residents of the EU or UK. Any opinions, news, research, analyses, prices or other information contained on this website is provided as general market commentary and does not constitute investment advice. ThinkMarkets will not accept liability for any loss or damage including, without limitation, to any loss of profit which may arise directly or indirectly from use of or reliance on such information.

XRP Eyes Rebound Amid Bearish PressureFenzoFx— Technical indicators show oversold conditions and bullish divergence in momentum. As a result, we expect a potential rebound toward higher resistance levels before the broader downtrend resumes.
In this scenario, XRP could rise toward $2.2230, then pull back to $1.9220, with major sell-side liquidity resting at $1.7710.

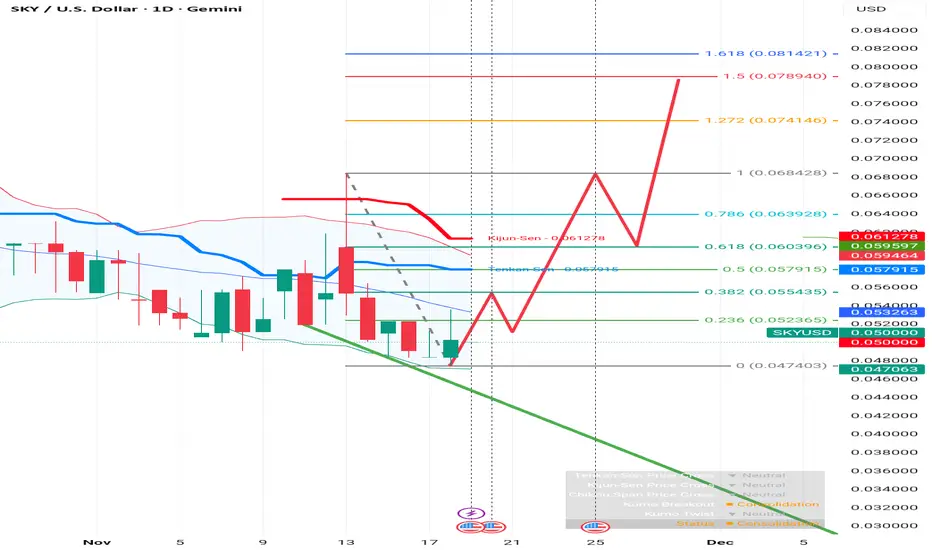
High risk high reward set-up1. Current Market Structure
Trend: The asset has been in a downtrend, evidenced by the lower highs and lower lows over the past few weeks. The price is currently trading around $0.0500.
Support Zone: The price recently found a floor at the 0.0474 level (marked as the 0 Fibonacci level). The current price action suggests a period of consolidation or a potential bottoming formation.
Indicators:
Ichimoku Elements: The price is currently below the Tenkan-Sen ($0.0579) and Kijun-Sen ($0.0612) lines. In Ichimoku theory, price below these lines typically indicates bearish momentum, meaning the price needs to cross above them to confirm a reversal.
Bollinger Bands: The bands appear to be narrowing slightly, which often precedes a period of high volatility (a breakout or breakdown).
2. The "Red Line" Projection
The red hand-drawn line on your chart represents a classic Reversal Scenario, specifically resembling a Double Bottom or a complex Inverse Head and Shoulders pattern. Here is the breakdown of that prediction:
Phase 1: The Retest (Current to Short Term) The projection anticipates the price might dip slightly one more time to retest the recent low near $0.0474. This would create the second "leg" of a "W" pattern (Double Bottom), confirming strong support at that level.
Phase 2: The Breakout After the retest, the projection predicts a sharp rally upward, breaking past the initial resistance at the 0.236 Fib ($0.0523) and the 0.382 Fib ($0.0554).
Phase 3: The Golden Ratio Challenge The rally is expected to pause or face resistance at the 0.618 Fib level ($0.0603). In technical analysis, this is often called the "Golden Pocket." A rejection here is common, hence the small dip drawn in the red line before the continuation.
Phase 4: The Extension (Target) The final leg of the drawing predicts a massive breakout to the 1.618 Fibonacci Extension at $0.0814.
3. Key Technical Levels to Watch
Critical Support 0.0474 The recent low. If the price breaks below this, the bullish projection is invalidated, and the price could seek lower lows.
Resistance 1 0.0579 Tenkan-Sen / 0.5 Fib. A crucial mid-point resistance.
Resistance 2 0.0612 Kijun-Sen / 0.618 Fib. This is the "trend flipper." Breaking this confirms a bullish trend reversal.
Target 0.0814 1.618 Extension. The ultimate profit target based on this specific Fib setup.
4. Summary
The market is currently bearish, but the drawing is betting on a bottom formation.
Bullish Signal: Watch for a daily candle close above $0.053 (the blue Moving Average line). This would start to validate the upward move. Bearish Signal: A daily close below $0.0470 would invalidate the support and likely lead to a further drop.
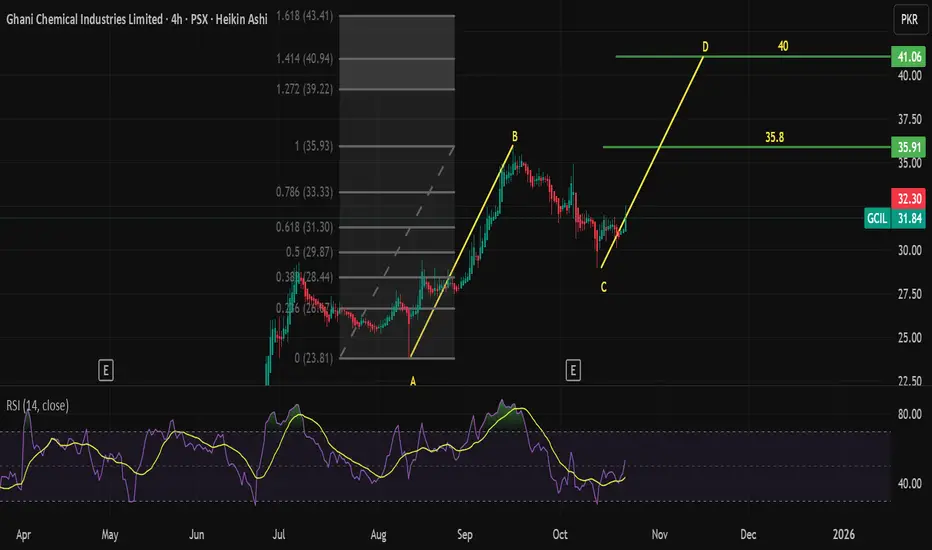
GCIL - ABCD PatternGCIL is forming a strong ABCD bullish pattern, with point C holding near the 0.618 Fibonacci retracement. A potential upside move toward 35.8 and 40 is in play if price sustains above the 31–32 support zone. RSI recovery above 50 also supports the bullish momentum.