XAUUSD ON NEXT WEEK FIBONACCI CHANNEL 4160 TO 4320XAUUSD – Technical Outlook (Educational Analysis Only)
Price is moving inside a rising channel with support and resistance well-defined.
Current structure suggests that as long as the lower trendline holds, price may attempt another move toward the upper channel zone.
Key Levels:
Support Zone: 4160 – 4185
Mid-Level Reaction Area: 4250 – 4260
Upper Channel Target Area: 4320 (possible if bullish momentum continues)
This chart highlights potential reaction zones based on structure, Fibonacci extensions, and channel movement.
X-indicator

DowJones key trading levelsKey Support and Resistance Levels
Resistance Level 1: 49000
Resistance Level 2: 49253
Resistance Level 3: 49600
Support Level 1: 48100
Support Level 2: 47870
Support Level 3: 47520
This communication is for informational purposes only and should not be viewed as any form of recommendation as to a particular course of action or as investment advice. It is not intended as an offer or solicitation for the purchase or sale of any financial instrument or as an official confirmation of any transaction. Opinions, estimates and assumptions expressed herein are made as of the date of this communication and are subject to change without notice. This communication has been prepared based upon information, including market prices, data and other information, believed to be reliable; however, Trade Nation does not warrant its completeness or accuracy. All market prices and market data contained in or attached to this communication are indicative and subject to change without notice.

NSDQ100 renewed cautionThe Nasdaq-100 saw mixed but resilient performance as the index worked through a heavy tech news cycle:
Tech drag early in the session:
The index opened weak after a sharp tech selloff, led by Oracle (-10.83%), which plunged on missed revenue and higher-than-expected capex, stoking concerns about whether AI-related spending is beginning to show fatigue.
Broader tech sentiment remained cautious with Broadcom slipping after underwhelming AI-related expectations.
Recovery driven by macro tailwinds:
Despite early weakness, the broader US market mood improved, helping the Nasdaq-100 stabilise as investors continued to digest the Fed’s rate cut and easing inflation pressures.
2-yr inflation swaps hit a 13-month low, reinforcing the view that the Fed’s easing cycle is intact—supportive for duration-sensitive tech names.
Global backdrop supportive:
European equities rallied strongly as markets pared back the probability of an ECB hike next year, adding to the global risk-on tone.
Global indices moved closer to record highs on confidence that monetary easing will continue through 2025.
Stock-specific movers with Nasdaq implications:
UBS reached a 17-year high (banking sentiment supportive but not directly Nasdaq-linked).
Lululemon surged pre-market on CEO departure news—boosting retail sentiment within the consumer discretionary components of tech-heavy indices.
Dollar outlook: Strategists at Deutsche Bank and Goldman see the USD weakening in 2025 as the Fed cuts further. A softer dollar typically supports large-cap growth and tech.
Geopolitical noise:
Comments from Donald Trump about guaranteeing Ukraine’s security added volatility in the defense complex globally, but impacts on Nasdaq-100 were indirect and limited.
Takeaway for Nasdaq-100 traders
Early tech weakness (Oracle, Broadcom) signalled renewed caution around AI-driven capex trends.
However, macro easing tailwinds dominated, allowing the index to recover from the weak open.
The path of least resistance remains upward as long as the Fed easing narrative holds, though AI-spending scrutiny may introduce pockets of volatility within the megacap tech complex.

Bank of America Flirts with HistoryBank of America has plodded higher for months, and now it’s flirting with history.
The first pattern on today’s chart is the $55.08 level. It was the previous all-time high from 2006, before the global financial crisis. BAC suffered a 95 percent drawdown from that peak and has now returned to the same historic line. That could keep traders on guard for a potential breakout.
Second, the megabank has made a series of higher lows while staying above its rising 50-day simple moving average. Is an intermediate-term uptrend in effect?
Next, MACD is rising and the 8-day exponential moving average (EMA) is above the 21-day EMA. Those patterns may reflect short-term bullishness.
Finally, BAC is an active underlier in the options market. That could help traders take positions with calls and puts.
TradeStation has, for decades, advanced the trading industry, providing access to stocks, options and futures. If you're born to trade, we could be for you. See our Overview for more.
Past performance, whether actual or indicated by historical tests of strategies, is no guarantee of future performance or success. There is a possibility that you may sustain a loss equal to or greater than your entire investment regardless of which asset class you trade (equities, options or futures); therefore, you should not invest or risk money that you cannot afford to lose. Online trading is not suitable for all investors. View the document titled Characteristics and Risks of Standardized Options at www.TradeStation.com . Before trading any asset class, customers must read the relevant risk disclosure statements on www.TradeStation.com . System access and trade placement and execution may be delayed or fail due to market volatility and volume, quote delays, system and software errors, Internet traffic, outages and other factors.
Securities and futures trading is offered to self-directed customers by TradeStation Securities, Inc., a broker-dealer registered with the Securities and Exchange Commission and a futures commission merchant licensed with the Commodity Futures Trading Commission). TradeStation Securities is a member of the Financial Industry Regulatory Authority, the National Futures Association, and a number of exchanges.
Options trading is not suitable for all investors. Your TradeStation Securities’ account application to trade options will be considered and approved or disapproved based on all relevant factors, including your trading experience. See www.TradeStation.com . Visit www.TradeStation.com for full details on the costs and fees associated with options.
Margin trading involves risks, and it is important that you fully understand those risks before trading on margin. The Margin Disclosure Statement outlines many of those risks, including that you can lose more funds than you deposit in your margin account; your brokerage firm can force the sale of securities in your account; your brokerage firm can sell your securities without contacting you; and you are not entitled to an extension of time on a margin call. Review the Margin Disclosure Statement at www.TradeStation.com .
TradeStation Securities, Inc. and TradeStation Technologies, Inc. are each wholly owned subsidiaries of TradeStation Group, Inc., both operating, and providing products and services, under the TradeStation brand and trademark. When applying for, or purchasing, accounts, subscriptions, products and services, it is important that you know which company you will be dealing with. Visit www.TradeStation.com for further important information explaining what this means.

Lithium Argentina AG (LAR) Develops Major Lithium Brine ProjectsLithium Argentina AG (LAR) develops large lithium brine projects in Argentina, supplying a key material used in EV batteries and energy storage. The company focuses on scaling production from high-quality brine resources, and its growth leans on rising global demand for cleaner transportation, new supply agreements, and long-term expectations for strong lithium consumption.
On the chart, LAR printed a confirmation bar with increasing volume as price moved above the 0.236 Fibonacci level and into the momentum zone. A trailing stop can be placed just under that 0.236 line using the Fibonacci snap tool, helping protect downside while letting momentum continue.

December MM Exposure & Positioning GEX VEX CEX DECEMBER Exposure read SP:SPX AMEX:SPY
Positioning: upward drift 7000
GEX: Easy to slip quickly up to a hard rally to 7000
VEX: if IV drops further they start buying 6950 adding fuel to the rally up
CEX: this just looks like constant delta hedging
🎯Target right now 6950 we will overshoot to 7000 MM will sell and it will drop down according to these positions

GOLD SELL PREDICTION DEC 2025After Asian Market session open and hit it's high i'm in for a XAUUSD (GoldUS dollar) short position .

XAUUSD Bullish Setup: Key Levels 4264 & 4300 in Focus. Analysis:
Gold is showing signs of renewed bullish momentum, supported by improving risk-on sentiment and strengthened by expectations that the Federal Reserve may cut rates twice in 2026. This macro backdrop continues to support upside pressure in precious metals.
On today’s chart, I’ve marked two important technical levels guiding the current bullish setup:
🟢 Key Support:
4264 – Primary support and the level where buyers are expected to remain active
🔺 Resistance Levels:
4300 – Immediate resistance; a clean break above this opens bullish continuation
4340 – Bullish target and next major upside zone
As long as gold remains above 4264, the market structure favors further upside. A breakout and sustained hold above 4300 would confirm bullish strength and likely drive price toward the 4340 target zone.
The current sentiment environment — with expectations of future Fed rate cuts — adds fundamental momentum to the technical bullish setup, increasing the probability of an extended rally.
📌 Bias: Bullish above 4264
📈 Breakout Confirmation: Close above 4300
🎯 Target: 4340
⚠️ Key Watch: Retest of 4264 for trend continuation
Regards: Chart Analyst Pro.
#Gold #XAUUSD #GoldAnalysis #GoldForecast #TechnicalAnalysis #PriceAction

Buy Signal #SEI 12 des 2025🎯 Entry Zone : $0.13 - $0.135
Stop Loss (SL): $12
Take Profit 1 (TP1): $1.4
Take Profit 2 (TP2): $1.45
Take Profit 3 (TP3): $1.50
⚠️ RISK DISCLAIMER: This is my personal analysis and not investment advice. The crypto market is extremely volatile. Always use proper risk management, including stop-loss orders. Do Your Own Research (DYOR).
#Bitcoin #BTC #TradingView #BuySignal #TechnicalAnalysis #CryptoTrading #SwingTrade #Crypto #SEI #BUYSEI #LONGSEI

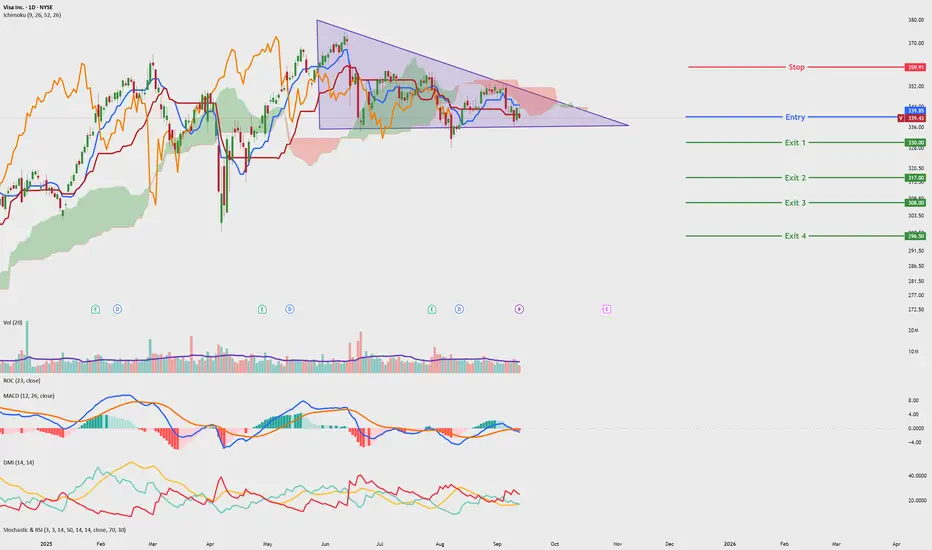
Visa - Potential drop from descending triangleV - Potential Bear Swing
Timeframe - 1 weeks to 3 months
Volume
- Maintained volume
Price Action + Trend
- bullish trend broken
- Price broken out of downtrend line
Ichimoku
- Lagging, base and conversion line below kumo
- Kumo cloud thinning and red cloud forming
Patterns
- Descending triangle
Oscillators
- MACD - Turning into bearish MMT
- DMI - Bearish mmt picking up, DM + DM - showing divergence, DX turning up towards 20
Conclusion
- Low to mid risk
- high return
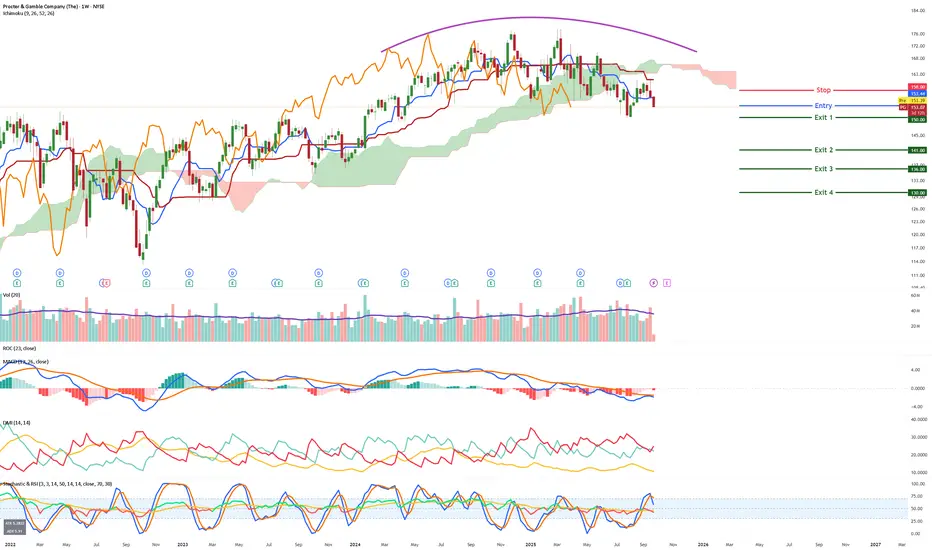
PG - Ride the bears======
Volume
======
- neutral, healthy
==========
Price Action
==========
- Price rejected 158
- Change of trend observed
=========
Oscillators
=========
- all lines below ichimoku cloud, kumo cloud turn bearish
- MACD turning down
- StochRSI, bearish cross and entering band
- DMI Neutral
=========
Conclusion
=========
- Short to mid term setup
AMAT - Bullish building blocks applied!=======
Volume
=======
-Stable
==========
Price Action
==========
- downtrend line of one year is broken in Jun 2025
- supported at $150 region for and rebounded at trendline
- Change of trend observed
=========
Oscillators
=========
- Ichimoku, price above cloud, kumo turns green, base + conv + lagging shows sign of piercing clouds
- MACD up
- DMI turning bullish
- StochRSI, bullish crossover + entered band
=========
Conclusion
=========
- short to long term swing, price may reverse at current level, to enter spot or wait for pullback.

Holding the trendlineNASDAQ:FTNT holding the trendline for quite some time, in these uncertain times. Since ATH, it's been struggling to regain momentum.

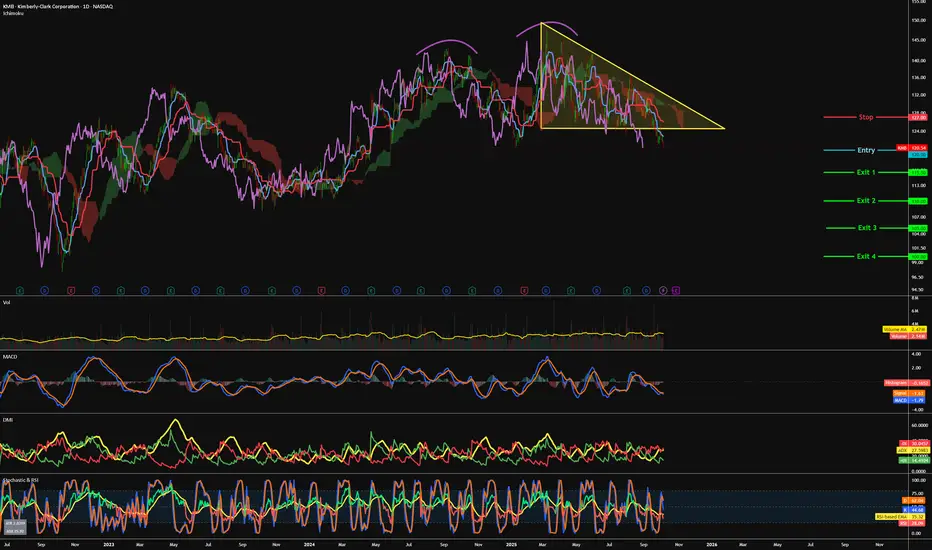
KMB - Out of descending triangle=======
Volume
=======
-Stable
==========
Price Action
==========
- descending triangle broken out
- currently supported at $120 region
- double top observed
=========
Oscillators
=========
- Ichimoku, price below cloud, kumo turns red, base + conv + lagging shows sign of piercing clouds
- MACD bearish
- DMI turning bearish
- StochRSI, bearish crossover + entered band
=========
Conclusion
=========
- short to long term swing, price may reverse at current level, to enter spot or wait for pullback.
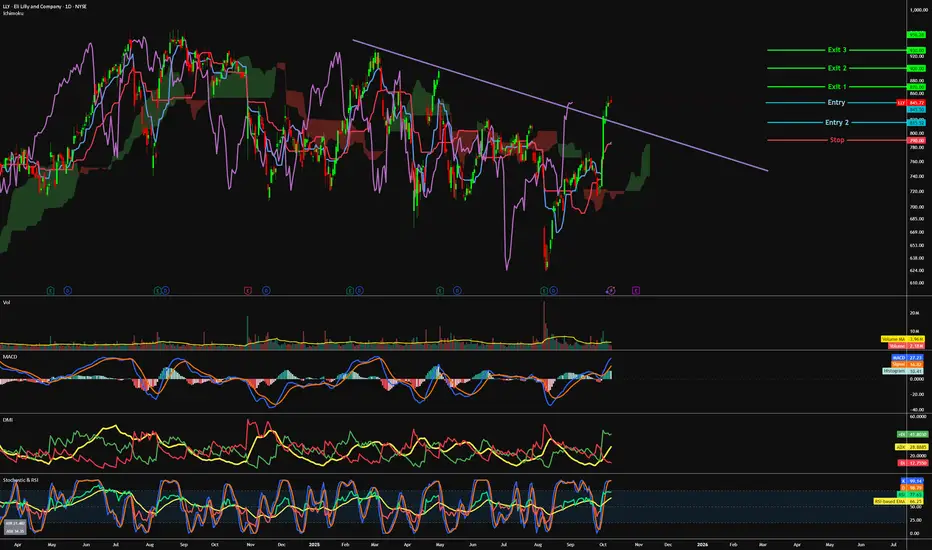
LLY - looking to reach the previous high ?=======
Volume
=======
-slight decreasing volume
==========
Price Action
==========
- Latest downtrend broken
- Change of trend observed
=========
Oscillators
=========
- Ichimoku, price above cloud, green kumo expanding, base + conv + lagging above sign of piercing clouds
- MACD still bullish
- DMI still bullish
- StochRSI, bullish + slight OB
=========
Conclusion
=========
- short to long term swing, price may reverse at current level, to enter spot or wait for pullback.
V - Can we see a new ATH?=======
Volume
=======
-Neutral
==========
Price Action
==========
- Price broke out of falling wedge
- Rounded bottom observed
- Triple bottom observed
=========
Oscillators
=========
- Ichimoku, price above cloud, green kumo expanding, base + conv + lagging piercing clouds upwards
- MACD bullish
- DMI slightly bullish
- StochRSI, slightly bullish
=========
Conclusion
=========
- short to long term swing, price may reverse at current level, to enter spot or wait for pullback.

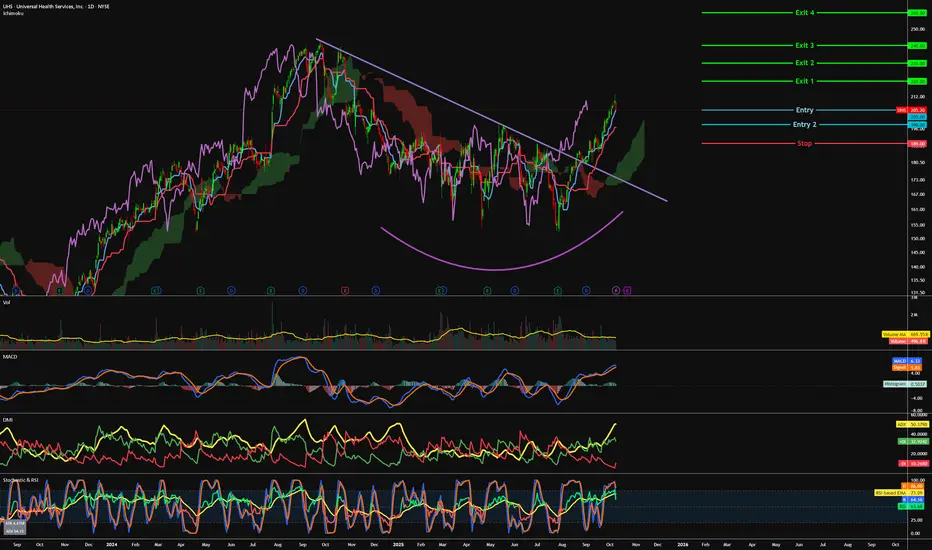
UHS - Will the bull continue?=======
Volume
=======
- slight decrease
==========
Price Action
==========
- Latest uptrend line broken and supported with pullback
- Rounded bottom
- Change of trend observed
=========
Oscillators
=========
- Ichimoku
>>> price above cloud
>>> green kumo expanding
>>> base + conv + lagging above clouds
- MACD still bullish
- DMI bullish
- StochRSI, slight OB with pullback signs
=========
Conclusion
=========
- short to long term swing
- price may reverse at current level, to enter spot or wait for pullback at entry 2.
DELL - The Long Climb=======
Volume
=======
- slight increase
==========
Price Action
==========
- Latest downtrend line broken and supported pullback way above line
- Rounded bottom
- Change of trend observed
=========
Oscillators
=========
- Ichimoku
>>> price above cloud
>>> green kumo
>>> base + conv + lagging above clouds
- MACD bullish
- DMI bullish
- StochRSI, bullish
=========
Conclusion
=========
- short to long term swing
- price may reverse at current level, to enter spot or wait for pullback.

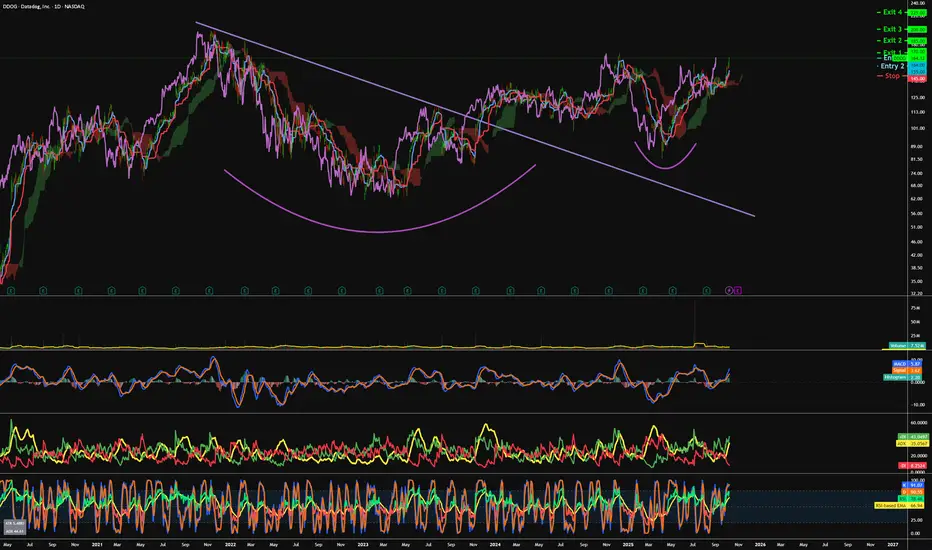
DDOG - back to the clouds=======
Volume
=======
- neutral
==========
Price Action
==========
- Latest uptrend line broken and supported with pullback way above trend
- Cup and handle
- Broken out of the latest bull flag
=========
Oscillators
=========
- Ichimoku
>>> price above cloud
>>> green kumo noticed
>>> base + conv + lagging above clouds and sloping upwards
- MACD bullish
- DMI bullish
- StochRSI, near OB region
=========
Conclusion
=========
- short to long term swing
- price may reverse at current level, to enter spot or wait for pullback at entry 2.
XPEV - Time to rev to the top =======
Volume
=======
- neutral
==========
Price Action
==========
- Broken out of 3 year trendline, rebounded and rebounded at trendline
- Double bottom and Cup + handle spotted
- 6 month rounding formed
=================
Technical Indicators
=================
- Ichimoku
>>> price closed above cloud and supported
>>> green kumo expanding
>>> Tenken + Chiku - above clouds
>>> Kijun - above clouds
=========
Oscillators
=========
- MACD still bullish
- DMI neutral
- StochRSI, still bullish
=========
Conclusion
=========
- short to long term breakout swing
- price may reverse at current level, to enter spot or wait for pullback at entry 2.

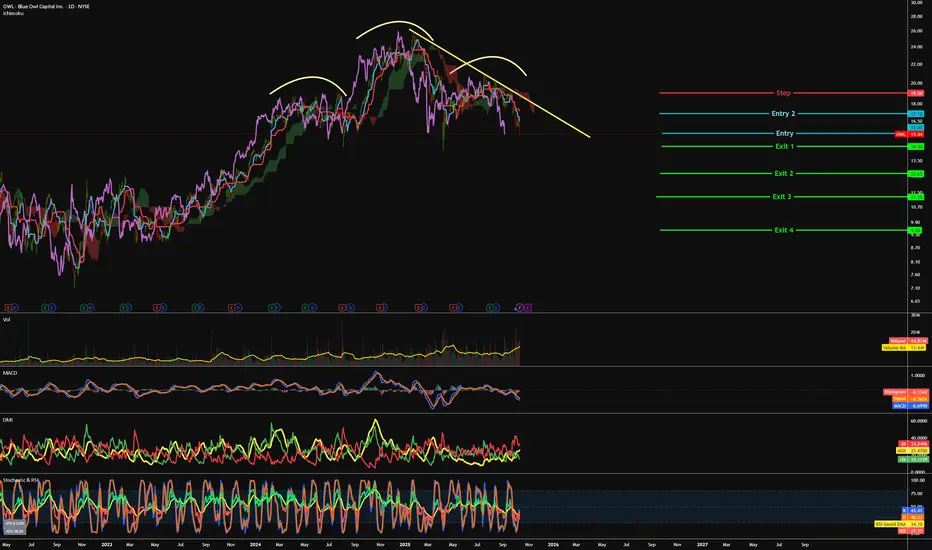
OWL - Diving down initiated=======
Volume
=======
-Increasing
==========
Price Action
==========
- Head and shoulders noticed
- rounding top noticed on the 2nd shoulder
- unable to clear downtrend line
=================
Technical Indicators
=================
- Ichimoku
>>> price below cloud and resisted below trendline
>>> red kumo expanding
>>> Tenken + Chiku - below clouds and moving away
>>> Kijun - below clouds and moving away
=========
Oscillators
=========
- MACD still bearish
- DMI bearish
- StochRSI, neutral
=========
Conclusion
=========
- short to long term breakout swing
- price may reverse at current level, to enter spot or wait for pullback at entry 2.
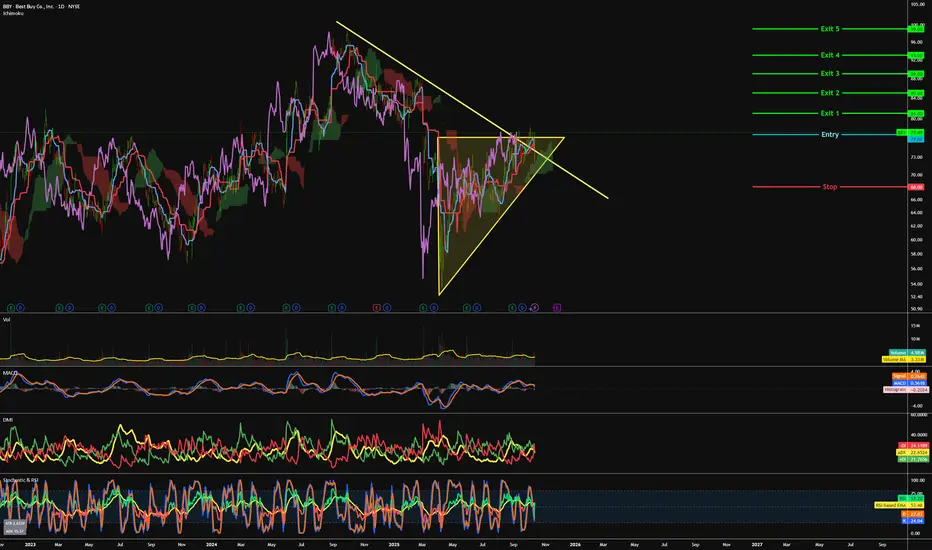
BBY - The best buy ever?!=======
Volume
=======
-slight increase
==========
Price Action
==========
- ascending triangle noticed
- Engulfing bullish candle
- broken out of 1.5 years downtrend line and supported on the same trendline
=================
Technical Indicators
=================
- Ichimoku
>>> price above cloud
>>> Green kumo expanding
>>> Tenken + Chiku - above clouds
>>> Kijun - Above clouds and moving away
=========
Oscillators
=========
- MACD turning bullish
- DMI turning bullish
- StochRSI, bullish and sloping up
=========
Conclusion
=========
- short to long term breakout swing
- price may reverse at current level, to enter spot or wait for pullback.
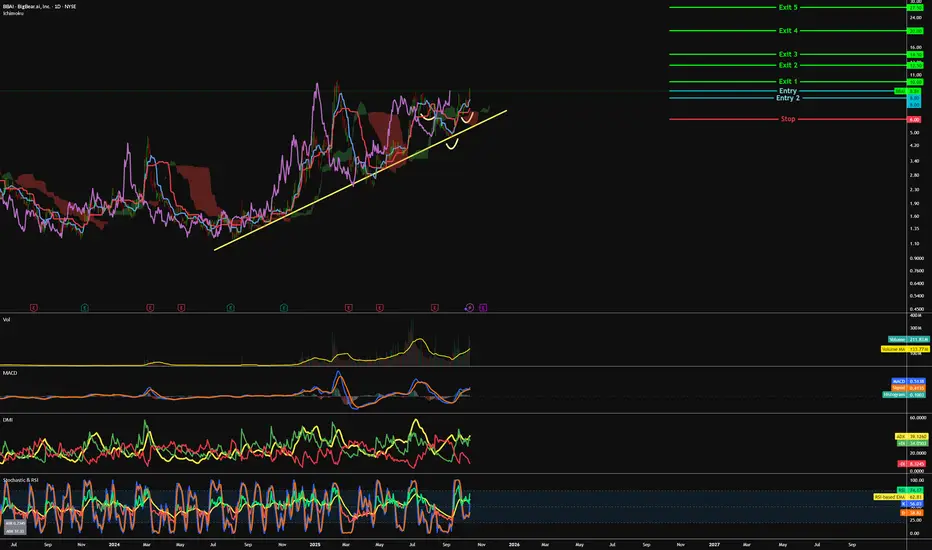
BBAI - Big Bear on the tails of the Bull!=======
Volume
=======
-increasing
==========
Price Action
==========
- supported on the uptrend line
- inverted H&S
=================
Technical Indicators
=================
- Ichimoku
>>> price above cloud
>>> Green kumo budding
>>> Tenken + Chiku - above clouds and moving away
>>> Kijun - Above clouds and moving away
=========
Oscillators
=========
- MACD bullish
- DMI bullish
- StochRSI, bullish
=========
Conclusion
=========
- short to long term breakout swing
- price may reverse at current level, to enter spot or wait for pullback at entry 2.