Weekly and Daily Bearish DivergenceSPX is starting to show the bearish divergence everyone has been anticipating. Let’s see how this plays out with Treasury tight liquidity, over night funding rates going up. I think we are going to see a Red 12/01 though the week.
X-indicator
ETHUSD Outlook!**Swing Analysis →Daily chart**
Price is in a bullish trend. We recently saw a correction towards discounted prices on daily timeframe. I am expecting longs around the marked OB{2335.8-2102.89} which lines up with the weekly key level around {2122.50}. From this point we could potentially see buyers stepping in, as this level has proven to be a key area for institutions to start buying Ethereum. Swing structure is Bullish.
**Internal structure → 4H chart**
Following internal structure, price is in a bearish trend and we recently broke below the last LL and reacted from the weekly key level {2816.00{ and we saw buyers stepping in correctively to push price higher towards the previous weekly {3056.75} level/LL which lines up perfectly with daily OB {3245.99-3102.00} and 50% Fibonacci level which has been common retracement point for ETHUSD since the bearish trend has started. I am expecting shorts to push price lower towards daily OB or key level mentioned above. Initially target is 2620.68 and a break below will open doors towards the weekly key level. Internal structure is bearish.

$HIMS BEARISH SENTIMENT If we can look into actions on volume and price. Institutional traders are luring retails to fomo with this surges which are basically traps to rekt em. Smart money are spoofing volume,$50 is a area that has acted as a supply zone multiple times not until it got broken downwards and the overall sentiment on NYSE:HIMS is indicating more bearish momentum, for price to continue it’s downside movement it has to test that area which is also in between the 50% and 61.8 % retracement level on the fib. Initially we saw a bearish divergence but with lots of retail fomo on longs were expected to see another bearish divergence whereby price will be low but volume is showing strength.


HNTUSDT 2D#HNT is moving inside a falling wedge pattern on the 2-day timeframe. Consider buying a small bag here and on the support zone between $1.892 ~ $1.754. If price breaks above the wedge resistance and the 2-day SMA50, the potential targets are:
🎯 $2.401
🎯 $2.741
🎯 $3.046
🎯 $3.351
🎯 $3.785
🎯 $4.338
❌ Invalidation: a 2-day candle closing below the wedge support.
⚠️ Always remember to use a tight stop-loss and maintain proper risk management.

$BTC short term long opportunity This is a short term long opportunity, the whole sentiment now is bearish and due to FOMO most retail are shorting but my bear family we have to be patient. Late December our long term short play might be back in action.

UNI Waite for strong breakout %25 gain toward 7.70$Hi the support and resistances on the chart are based on the previous data and weekly candlesticks if BINANCE:UNIUSDT holds this last support the potential of 25% gain is logical toward 7.70$

PUMP ready for uper levels %40 gain toward $0.004080Hi the support and resistances on the chart are based on the previous data and weekly candlesticks if BYBIT:PUMPUSDT holds this last support the potential of 40% gain is logical toward 0.004080$

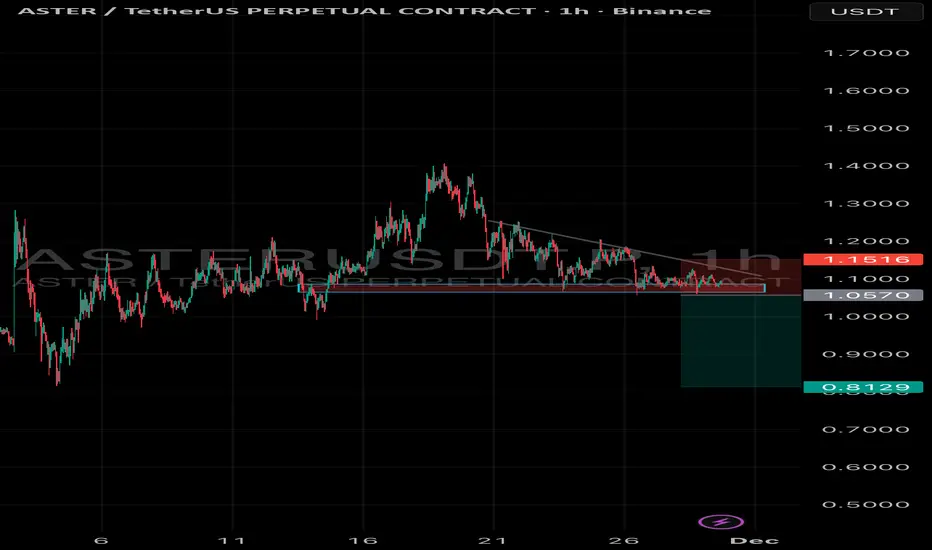
$ASTER to $0.8Just like the textbook format (bearish descending triangle) a break below will see aster go to the mud.

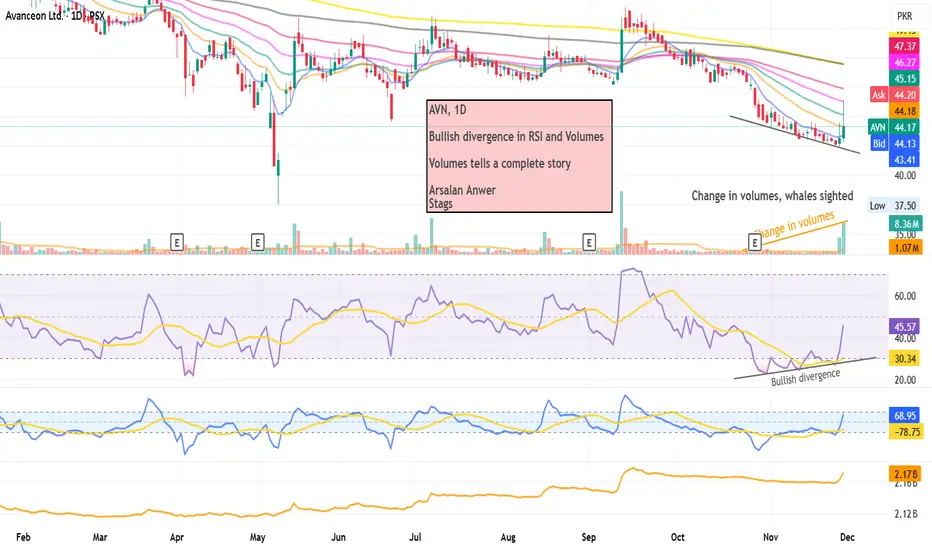
AVN, 1D (Bullish divergence with change of volumes)AVN, 1D
Bullish divergence in RSI and Volumes
Volumes tells us the complete story
Arsalan Anwer
Stags
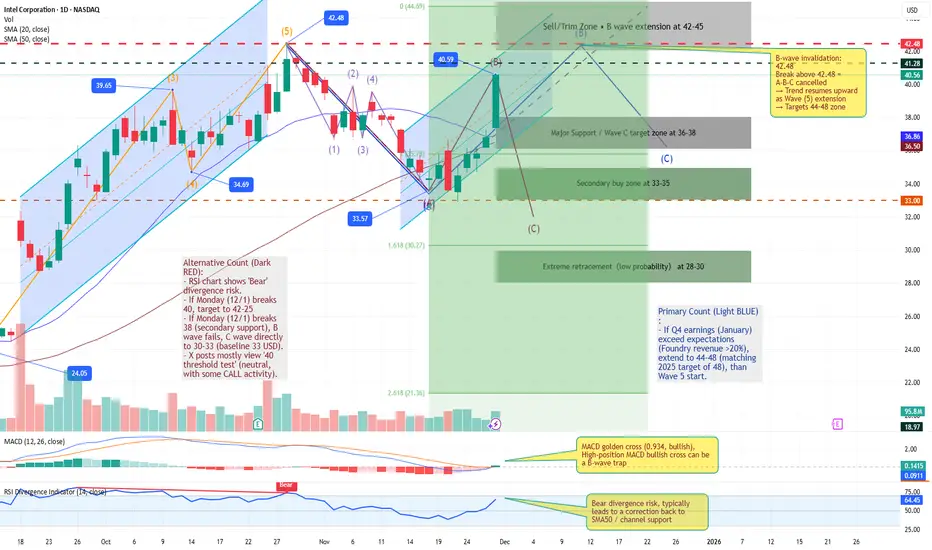
INTC:B-Wave Rally Targets 42-45 Amid Foundry MomentumIntel (INTC): B-Wave Rally Targets 42-45 Amid Foundry Momentum
Published: Nov 29, 2025 | Bullish Bias | Elliott Wave Setup
Intel ( NASDAQ:INTC ) is staging a compelling B-wave rebound from its A-wave low at $33, breaking above the $40 Fibonacci 78.6% retracement and ascending wedge upper channel.
Yesterday (11/28)'s close at $40.56 (+2.3%) on 1.9B shares confirms bullish control, with MACD golden cross at 0.934 signalling momentum shift. RSI at 64.5 shows bearish divergence risk—watch for >70 overbought pullback to SMA channel support (~$36).
Technical Breakdown:
• Wave Structure: Primary count (light blue): A-C correction complete; B-wave (zigzag) underway, targeting up to 100% retrace at $42.48 (A-high test)—break above invalidates ABC, signalling impulse wave (e.g., Wave 3 start) with higher targets (45+). Extension to 123.6% ($44.72) unlikely without invalidation, but possible if Q4 earnings beat (Jan 2026). Alternative (dark red): Bear divergence leads to C-wave failure below $38, probing $30-33 baseline.
• Key Levels: Support $38 (secondary)/$33-35 (major); Resistance $42-45 (sell trim zone). Volume surge (+60% avg) validates upside—sustain >2B shares for conviction.
• Indicators: MACD bullish (high-position cross as B-trap escape); Stochastic neutral (18.7, room to run).
Fundamentals Fueling the Move: Q3 revenue beat ($13.7B) and AI PC shipments (>1B units by 2025 end) underscore Foundry pivot. Apple chip rumors and CHIPS Act tailwinds add catalysts, offsetting TSMC litigation noise (neutral short-term). Consensus "Hold" (target $34.84) undervalues rally potential—Tigress eyes $52.
Momentum Notes: If Q4 Foundry >20% growth, extend to $44-48 (2025 match). Position for 1-2 weeks; rotate profits to TSLA on pullback. Bullish until $38 break—watch FOMC Dec 18.
Disclaimer: This analysis is for educational purposes only and is not investment advice. Please do your own research (DYOR) before making any trading decisions.
SPX to Money Supply WARNING!If the charts aren’t showing bubble setups, I’m not going to invent them. I post what the data shows. So please don’t shoot the messenger when I say GTFO & STFO.
And just to keep the facts straight:
Brokerage, stock, and crypto accounts are not part of M2.
Why does M2 matter?
It’s the actual spendable money in the economy.
When M2 grows faster than real output (as it did in 2021), price pressure builds.
The economy runs on liquidity.
Retail, goods, services all of it requires money you can actually spend, not paper gains in a trading account.
When the S&P 500 disconnects massively from M2 — like during the dot-com bubble — revenue and profit growth can’t keep pace. Valuations expand purely on speculation, not on real, organic fundamentals. That’s how multiples stretch and bubbles form.
The problem? Most retail traders have no idea this is happening. They’re trading with their hair on fire, following cute social-media stories dressed up as “analysis,” using strategies that have never been tested in real markets.
And that’s exactly how bubbles are fed:
big players sell into retail euphoria, and retail ends up holding the bag of schitt!
Buy when stocks are cheap, not at all-time highs in euphoria land.
"Price is what you payt, VALUE is what you get!"
THANK YOU for getting me to 5,000 followers! 🙏🔥
Let’s keep climbing.
If you enjoy the work:
👉 Drop a solid comment
Let’s push it to 6,000 and keep building a community grounded in truth, not hype.

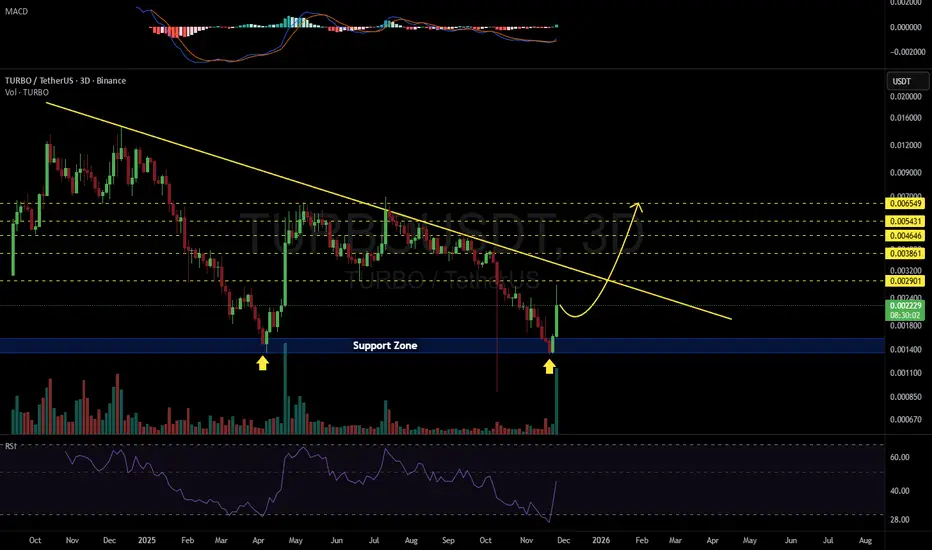
TURBOUSDT 3D#TURBO has bounced off the support zone perfectly with significant volume on the 3-day timeframe. RSI is showing potential for upward movement. In case of a breakout above the descending resistance, the potential upside targets are:
🎯 $0.002901
🎯 $0.003861
🎯 $0.004646
🎯 $0.005431
🎯 $0.006549
⚠️ Always remember to use a tight stop-loss and maintain proper risk management.
A safe long setup for cautious peopleThe previous analysis was with a longer-term perspective. In this analysis, a completely safe setup is presented for cautious people. The stop of this setup is placed at the point 87550. If this point is crossed, the short-term upward trend is ruled out.

(JPY) futures: The Risk and Rate DifferentialThe Yen chart highlights global risk appetite and the impact of interest rate divergence.Pattern: The price is in a long-term decline, consolidating in a descending wedge/triangle above major support approx 0.0063$.
Signal: The Yen's weakness is fundamentally caused by the massive interest rate differential between low Japanese yields and high US yields.
- US 10Y Yield approx 4.02%
- Japan 10Y Yieldapprox 1.81%
The differential is approx 2.21% (high) and has caused the Yen to sell off (Futures price down).
Monetary Divergence. A break of the Yen's consolidation suggests either a continuation of this divergence (Yen weakness) or a major shift in global risk flows (Yen strength), which historically has a positive correlation with gold (and thus silver), as both are considered safe-haven assets.

USD Index Proxy: EURUSD Breakout to Validate T-Note & XAGUSD MovThe Core Thesis: The Euro Futures chart, which is the mirror image of the US Dollar Index (DXY), is consolidating in a Symmetrical Triangle pattern. The direction of the inevitable breakout will be the ultimate fundamental driver for the Silver ATH move and the T-Note's wedge break. This chart holds the key to the macro move.
Technical Snapshot: The Symmetrical Triangle
The Pattern: The daily chart shows a clear Symmetrical Triangle formed since mid-2025, characterized by converging trendlines (lower highs and higher lows). This pattern signals indecision but precedes a high-momentum directional move.
Key Levels: The price is hovering near a critical support zone around 1.15000 and just above a major long-term EMA (shown in pink/red).
Trendline Breakouts:
Bullish Breakout: A decisive close above the upper trendline and the resistance around 1.16840 would confirm a move higher.
Bearish Breakdown: A close below the lower trendline and the major support cluster around 1.14300 - 1.15000 would confirm a move lower.

Bitcoin Next hurdel is waiting Hello trader's
Here is your bitcoin chart explained with all levels
work accordingly and read the chart form your own
learn the market & trade with it ..

(ZN1!): The Wedge of Decision. Rate Cut Confirmation Imminent ?The Core Thesis: The 10-Year T-Note futures price has been locked in a massive, multi-year symmetrical triangle or falling wedge pattern. A decisive breakout from this formation will not only determine the next phase of the bond market but will also confirm the direction of the 10-Year Yield, which acts as the global benchmark for borrowing costs.
Technical View: The Wedge Breakdown/Breakout
The Pattern: The Weekly chart shows a clear consolidation, characterized by lower highs and higher lows, forming a tightening range. The market is coiling, anticipating a major break.
Breakout Level (Bullish): A sustained Weekly close above the upper trendline, which corresponds roughly to the 113'16 to 114'00 zone on the chart, would signal a bullish breakout.
Price Implication: T-Note prices move UP (a bullish breakout).
Yield Implication: The 10-Year Yield (US10Y) moves DOWN.
Breakdown Level (Bearish): A definitive close below the lower trendline (around the recent lows, near 112'00) would signal a bearish breakdown.
Price Implication: T-Note prices move DOWN (a bearish breakdown).
Yield Implication: The 10-Year Yield (US10Y) moves UP.

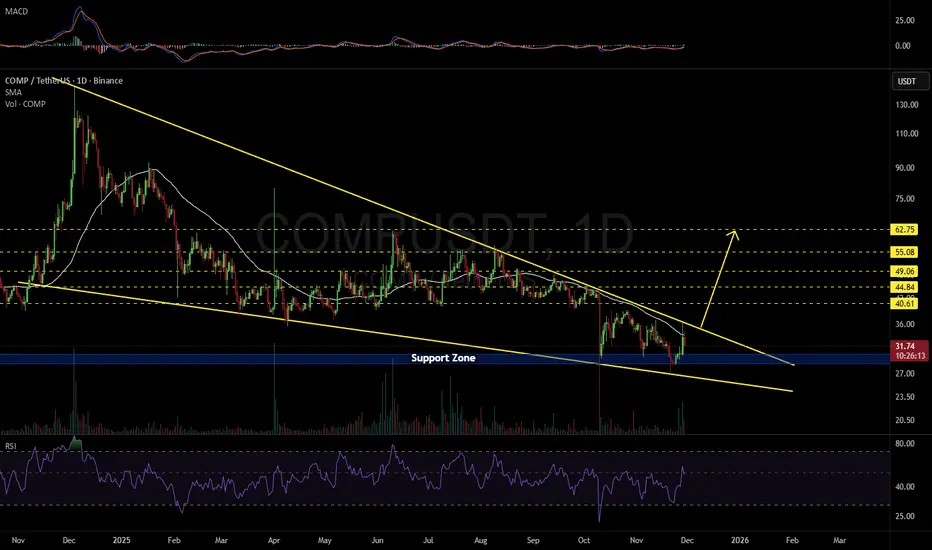
COMPUSDT 1D#COMP is moving inside a falling wedge pattern on the daily chart. Its first breakout attempt was rejected at the wedge resistance, and the second attempt was rejected at the daily SMA50. Consider buying a small bag near the support zone. If price breaks above both the wedge resistance and the SMA50, the potential upside targets are:
🎯 $40.61
🎯 $44.84
🎯 $49.06
🎯 $55.08
🎯 $62.75
❌ Invalidation: a daily candle closing below the wedge support.
⚠️ Always remember to use a tight stop-loss and maintain proper risk management.
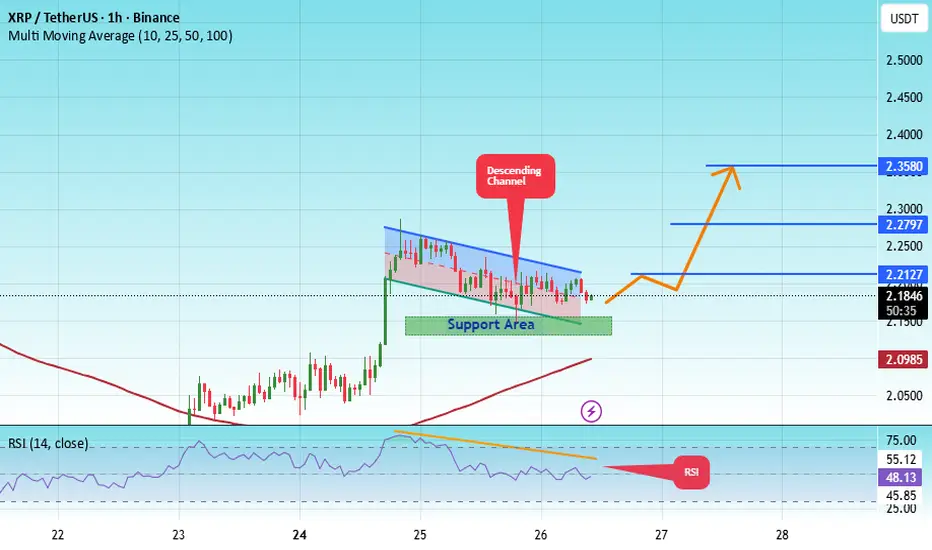
#XRP/USDT XRP (1h) (spot)#XRP
The price is moving within an ascending channel on the 1-hour timeframe and is holding well. It is poised to break out strongly and retest the channel.
We have a downtrend line on the RSI indicator that is about to break and retest, which supports the upward move.
There is a key support zone in green at the price of 2.14, representing a strong support point.
We have a trend to stabilize above the 100-period moving average.
Entry price: 2.18
First target: 2.21
Second target: 2.28
Third target: 2.35
Don't forget a simple money management rule:
Place your stop-loss order below the green support zone.
Once you reach the first target, save some money and then change your stop-loss order to an entry order.
For any questions, please leave a comment.
Thank you.
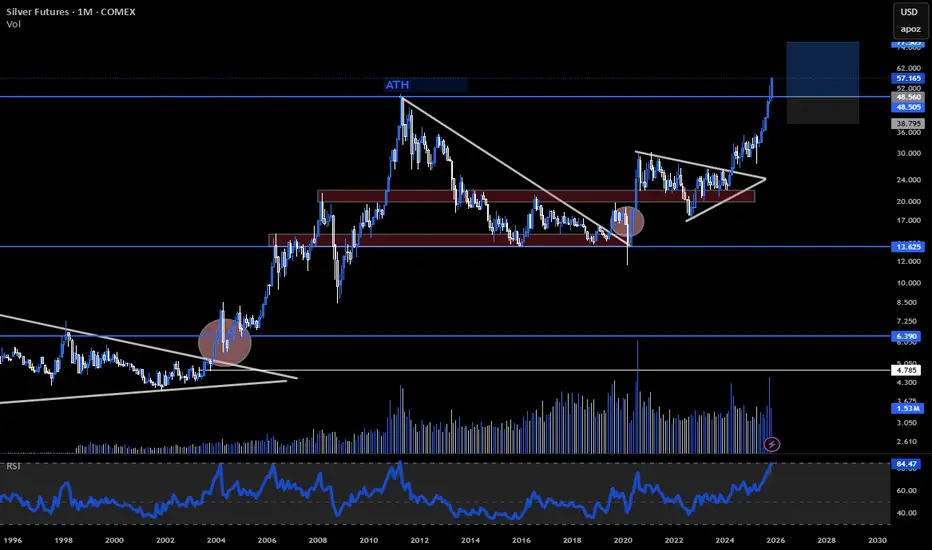
SILVER (XAGUSD): Multi-Decade ATH Breakout Confirmed. $80+ Next?
The Thesis: After decades of forming a colossal base, Silver (XAGUSD) has confirmed a structural breakout above its multi-decade all-time high resistance zone, previously capped between $49.76 and $55.00. This is not a short-term trade; it marks the beginning of a new secular bull market for the metal.
Technical Confirmation
The Breakout: A sustained weekly/monthly close above the $55.00 level is critical and confirms the elimination of the 45-year resistance ceiling.
Measured Move Target: The completion of this massive basing pattern projects a minimum initial target toward the $75.00 - $80.00 range.
Momentum: Key momentum show strong upward conviction, indicating that this move is supported by heavy institutional volume.
Fundamental Drivers
Structural Deficit: Global mine supply and recycling are chronically insufficient to meet demand. The Solar/Photovoltaic and Electric Vehicle (EV) industries are creating a massive, unyielding demand floor. Analysts project a fifth consecutive year of significant supply deficit.
Monetary Tailwinds: Expectations of a dovish Fed and eventual rate cuts are pushing investors toward non-yielding assets. The Gold/Silver Ratio is falling, suggesting silver is playing catch-up to gold with amplified gains.
Risk Management
The current bullish thesis would be heavily invalidated if XAG/USD sees a decisive weekly close back below the psychological $50.00 level, which was the prior critical resistance turned support.
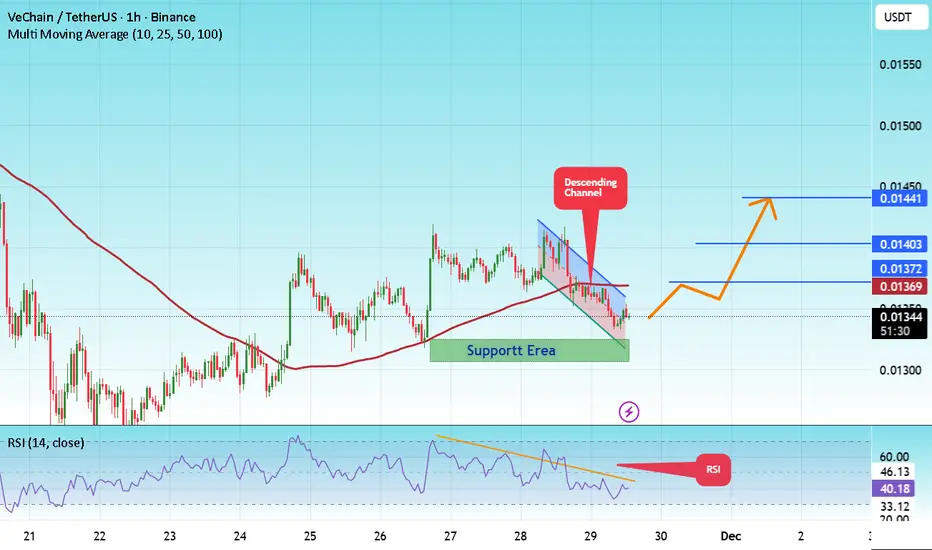
#VET/USDT Traders watch VeChain 10% upside targeting 0.01441 ?#VET
The price is moving in a descending channel on the 1-hour timeframe. It has reached the lower boundary and is heading towards a breakout, with a retest of the upper boundary expected.
We are seeing a bearish bias in the Relative Strength Index (RSI), which has reached near the lower boundary, and an upward bounce is expected.
There is a key support zone in green at 0.01320. The price has bounced from this level several times and is expected to bounce again.
We are seeing a trend towards stabilizing above the 100-period moving average, which we are approaching, supporting the upward trend.
Entry Price: 0.01345
First Target: 0.01372
Second Target: 0.01403
Third Target: 0.01441
Remember a simple principle: Money Management.
Place your stop-loss order below the green support zone.
For any questions, please leave a comment.
Thank you.