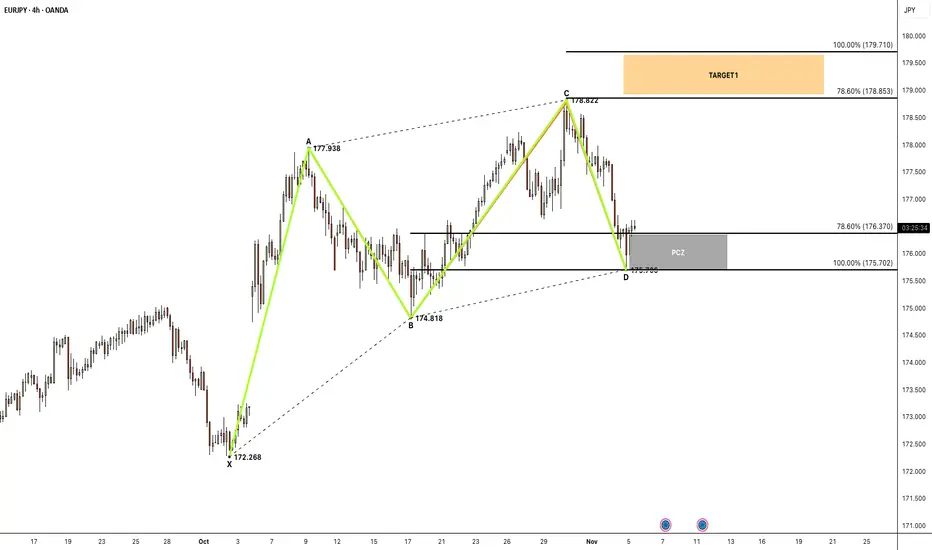
121Hello traders — hope you’re doing well and banking pips. Quick read on EURJPY: a 1:1 symmetry (AB=CD) completed and price is trading inside the PCZ. As long as the zone holds and we press back above the top of the box, I’m looking for continuation toward TP1.
Pattern
1:1 Symmetry / AB=CD (bullish continuation).
Swings: A 177.938 · B 174.818 · C 178.872 · D ~175.78.
Key Levels
PCZ support: 175.702–176.370 (100%–78.6%) — current battle.
TP1 zone: 178.853–179.710 (78.6%–100%).
Plan
Aggressive long: Bullish rejection/engulfing inside PCZ, then ride toward 61.8% first and TP1 box next.
Conservative long: Wait for an H4 close above 176.370, buy pullbacks while the PCZ top holds as support.
Xabcd
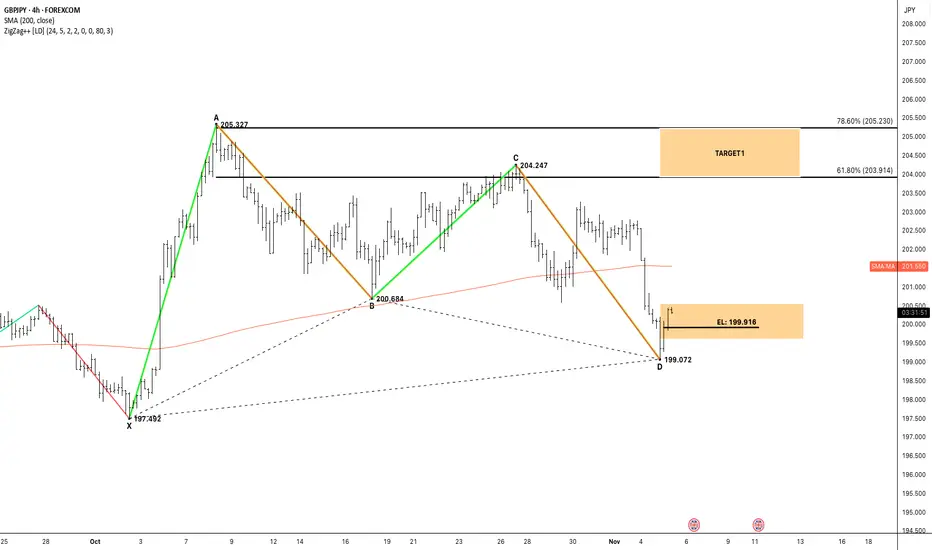
GARTLEYHello traders — hope you’re doing well and banking pips. Quick look at GBPJPY: a clean Gartley completed with D ≈ 199.072. Price is trading in the PCZ; I want to see it hold above EL 199.916 to confirm continuation toward the target band.
Pattern
XABCD (Gartley) — A 205.327 · B 200.684 · C 204.247 · D 199.072.
Key Levels
PCZ: around 199.0 (D completion).
EL (reclaim trigger): 199.916.
Intermediate: 200-SMA ~ 201.55 (first headwind/support on reclaim).
TP1 zone: 203.914–205.230 (61.8%–78.6%).
Plan
Aggressive Long: Bullish rejection inside PCZ; risk tucked below D low.
Conservative Long: Wait for H4 close > EL 199.916, then buy pullbacks while EL holds as support.
Scale partials near 203.9 and let runners push into 205.23 if momentum stays firm.
GARTLEYDOGE/USD (4H) – Bullish Gartley at D (Reversal → T1/T2)
Quick summer check-in while I sneak some downtime: DOGE just printed a clean Gartley-style completion and buyers are reacting at D.
📌 Pattern Overview
Pattern: Gartley (Bullish)
Asset: Dogecoin / USD
Timeframe: 4H
Bias: Long from D/PRZ on confirmation and structure reclaim
🔑 Key Levels
X: 0.1956
A: 0.2549
B: 0.2176 (shallow retrace of XA)
C: 0.2427
D (PRZ): 0.2078 (confluence with XA fib + AB=CD symmetry)
Target 1: 0.2493 – 0.2606 (≈ 61.8%–78.6% of AD)
Target 2: 0.2933 – 0.3165 (≈ 127.2%–161.8% extension)
📐 Technical Confirmation
BC retrace ≈ 67% of AB, CD ≈ 1.27–1.41 × BC into D.
Confluence at 0.207–0.210 forms the PRZ; first bullish reaction printed.
Structure pivot to watch: 0.224–0.226 (break/hold confirms momentum).
⚡️ Price Action & Trade Setup
Plan A (confirmation): Wait for a close above 0.224–0.226, buy the retest → T1, trail remainder toward T2.
Plan B (PRZ fade): Scale in small on holds within 0.208–0.212 with a tight stop; add on higher-low + pivot reclaim.
🧠 Market Sentiment
Choppy, but dip-buyers active near structure lows; holding above D keeps the recovery path open.
📊 Next Potential Movements
Upside path: 0.226 → 0.235 → 0.249–0.261 (T1), extension toward 0.293–0.317 (T2) if momentum broadens.
Pullbacks: 0.214 / 0.210 are spots to defend for higher-low continuation.
🛡 Risk Management
Invalidation: clean close below 0.2078 (D); conservative invalidation below 0.1956 (X).
Stops: just under 0.205 (aggressive) or < 0.195 (structure).
TP: scale at T1, trail to T2; move stop to BE after ~1R.
🚀 Conclusion
Gartley completion at D is holding. A firm 0.224–0.226 reclaim unlocks T1 (0.249–0.261), with room toward T2 (0.293–0.317) if buyers keep control.
“Patterns set the map — discipline drives the journey.”
@TRADECHARTPATTERNSLIKETHEPROS.

XABCD
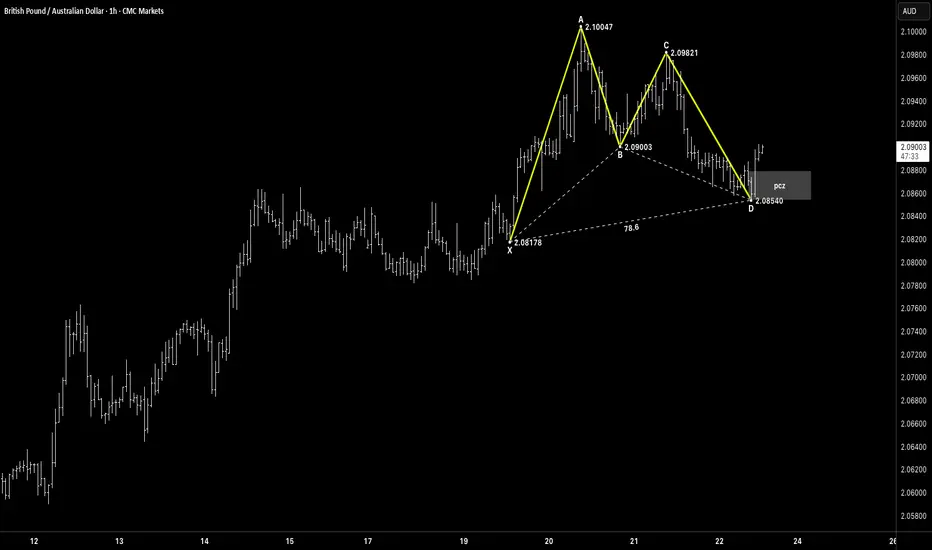
Hey awesome traders! Hope you’re enjoying a well-deserved holiday. Quick summer check-in: GBPAUD just completed a clean Bullish Gartley into the PRZ, and buyers are reacting at D—poolside or beach, plan it, execute it, manage the profit.
📌 Pattern Overview
Pattern: Gartley (Bullish)
Bias: Long from D/PCZ on confirmation and structure reclaim
🔑 Key Levels
X: 2.08178
A: 2.10047
B: 2.09003
C: 2.09821
D (PRZ): 2.08540
PCZ: 2.084 – 2.087 (XA 78.6% + AB=CD/BC 1.27–1.618 confluence)
📐 Confirmation Triggers
First reaction off D printed.
Stronger confirmation: reclaim/close above 2.0900 (B pivot).
Hold of higher-lows inside 2.084–2.087 keeps the setup valid.
⚡ Trade Plan
Plan A (confirmation entry):
Wait for close > 2.0900, buy the retest.
Targets: 2.10293 – 2.10707 (T1 zone).
Trail once price clears 2.100.
Plan B (PRZ fade, smaller size):
Scale in on basing/higher-lows 2.084–2.087.
Add on 2.0900 reclaim.
🛡 Risk Management
Invalidation (aggressive): clean close below 2.0854 (D).
Conservative invalidation: below 2.0818 (X).
Stops: under 2.084–2.085 (tight) or under 2.0815–2.0820 (structure).
Move stop to BE after ~1R; partials at T1.
🎯 Targets & Path
T1: 2.10293 – 2.10707 (≈ 78.6%–100% of AD).
If momentum persists after T1, look for continuation legs toward prior swing supply.
Symmetry
Hello awesome traders! Hope you’re having a great summer. I’ve been juggling a few projects and a little time off—but eyes always on the charts. Today: Ethereum showing a clean symmetry (equal-legs) bullish setup.
Overview
Pattern: Symmetry / AB=CD (equal-legs) bullish
Context: Price printed D ≈ 4,047 and reclaimed momentum above 4,140, then based inside PCZ1.
Bias: Bullish while holding/reclaiming the PCZ1 band.
Key Levels
PCZ1 (retest/reclaim zone): 4,204 – 4,329
Momentum line: 4,140 (hold above = bulls in control)
Target 1: 4,652 (prior measured level on chart)
Target 2 zone: 5,191 – 5,498
Trade Plan
Primary long: 4H close above 4,329 (top of PCZ1) → look for continuation toward T1 4,652, then T2 5,191–5,498.
Alternative long: Reactive buy on a retest/hold of 4,204–4,220 with a bullish rejection (wick + strong close back inside PCZ1).
If PCZ1 rejects: Watch for a higher-low setup back near 4,260/4,220. Lose 4,140 on a 4H close → stand aside; deeper pullback to 4,080–4,050 possible.
Risk Management
Risk ≤ 1% per idea.
Stops: Conservative below 4,120 (for PCZ1 retest entries) or below 4,040 (for deeper-pullback entries).
Management: Scale at T1, trail to BE after ~1R, leave a runner toward T2 if momentum holds.
Notes
Structure stays valid while 4,140 holds on closing basis and price continues to respect PCZ1.
Confirmation = clean 4H close and hold above 4,329 with rising momentum.
@tradechartpatternslikethepros.

28 Apr - XABCD Pattern Signals Potential UpsideRecently, the expected Head and Shoulders pattern seems to be delayed — and possibly invalidated — as buyers successfully defended the line at $3,287, pushing the price up to $3,319 on Friday. As a result, a new bullish setup has emerged.
On the 1-hour chart, an XABCD harmonic pattern has clearly formed, offering two upside targets:
Target 1: $3,367
Target 2: $3,435
On the downside, $3,260 is now acting as the critical level. A break below this point could open the door for lower prices.
For now, the bias is long until Target 1 at $3,367 is reached. Traders should monitor short-term sentiment closely: if signs of weakness or a shift appear, the price could reverse earlier.
Important to note: the Head and Shoulders pattern remains a risk if price falls below $3,260 after reaching $3,370 and moves toward the neckline at $3,237.
📍 Summary:
Idea: Go long toward $3,367.
Risk: Head and Shoulders pattern could still complete if bearish momentum returns.
Stay sharp and manage your risk accordingly!
-------------------------------------------------------------------------
This is just my personal market idea and not financial advice! 📢 Trading gold and other financial instruments carries risks – only invest what you can afford to lose. Always do your own analysis, use solid risk management, and trade responsibly.
Good luck and safe trading! 🚀📊

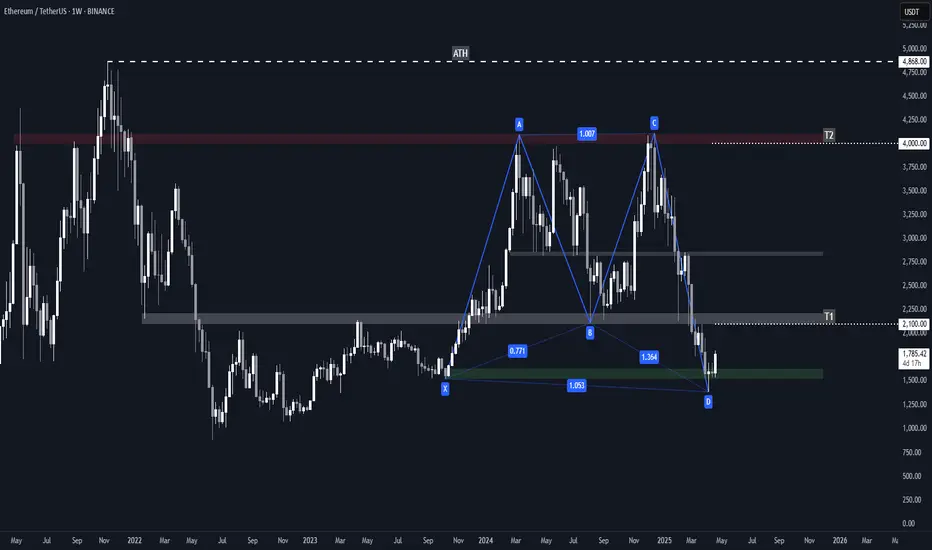
ETH Bullish Navarro 200 Harmonic Pattern + Key Levels / TargetsHarmonic Structure: Navarro 200
Ethereum's weekly chart showcases a fully formed Navarro 200 pattern, identified by:
• A deep B-to-D leg extension (~1.364) — beyond typical harmonic norms, validating the Navarro classification.
• Precise internal Fibonacci alignments:
- XA retracement to B = ~0.771
- BC extension to D = ~1.364
• Completion of point D in a historical demand area around $1500, indicating a potential reversal zone (PRZ).
This harmonic pattern suggests a bullish reversal scenario, contingent on price holding above the $1500 level.
Demand Zone: $1500–$1600
This green box zone represents a major accumulation range from early 2023:
• High volume support — confirmed by prior consolidations.
• On-chain data supports this as a major ETH acquisition zone (1.5M+ ETH bought).
• Current bounce from this area following a liquidity sweep reaffirms it as a strong demand base.
Failure to hold this zone could invalidate the bullish harmonic setup.
Target Zones (Based on Navarro 200 Mechanics)
• T1: $2100–$2200
- Historically significant support-turned-resistance.
- Converges with structural highs and prior breakdown area from mid-2024.
- First logical profit-taking or reaction point following a D-point reversal.
• Mid-Zone: ~$2800
Though not labeled as a target, this is a key supply region to monitor:
- Past consolidations and price rejection.
- Mid-range of the overall pattern.
- Also aligns with prior bullish support in 2024 that flipped to resistance.
• T2: $4000–$4100
- Strong weekly supply zone marked in red.
- Aligns with point C of the pattern.
- Also a psychological barrier near the previous all-time high area ($4,868).
- Likely to see heavy resistance if price rallies that far.
Risks to Watch
• Failure to hold the $1500–$1600 demand zone could send ETH into deeper retracement.
AUDUSD LongAUDUSD completed ABC and as per rtm also it reached the origin Swap FL. harmonic made deep crab. Now its time for a upside reversal.

How To Use The XABXD Pattern ?The term "xabcd pattern" is commonly used in technical analysis, specifically in the field of harmonic trading. It refers to a specific price pattern that is believed to have predictive value in identifying potential market reversals.
The xabcd pattern is based on the Fibonacci retracement and extension levels, which are ratios derived from the Fibonacci sequence (a sequence of numbers in which each number is the sum of the two preceding ones). The pattern consists of four key points labeled as x, a, b, and c, forming specific ratios between these points.
Here's a breakdown of each point in the pattern:
1. Point X: This is the starting point of the pattern and represents the beginning of a significant price move.
2. Point A: This marks the end of the initial price move and is usually a retracement of the XA move. Point A is typically at the 0.618 or 0.786 Fibonacci retracement level of the XA move.
3. Point B: This represents a retracement of the AB move. Point B is typically at the 0.382 or 0.618 Fibonacci retracement level of the AB move.
4. Point C: This marks the completion of the pattern. Point C is usually at the 1.272 or 1.618 Fibonacci extension of the AB move.
The xabcd pattern suggests that once point C is reached, there is a higher probability of a market reversal in the opposite direction.
Traders who use harmonic patterns like the xabcd pattern look for these formations on price charts and use them to anticipate potential trend reversals. They may enter trades based on the completion of the pattern, placing stop-loss orders below or above the pattern's points to manage risk.
It's important to note that while harmonic patterns can be a part of a trader's toolkit, they are not foolproof and should be used in conjunction with other technical analysis tools and risk management strategies. It's recommended to study and practice extensively before relying solely on any specific pattern for trading decisions.

XMRUSDT Sell/Short Setup on 4H TFBearish XABCD pattern. Once this support is broken, we can take an entry @ 157 and have the retracements for our planned take profits as follows:
🚪Entry: 157
💰Trade: Cross 10-15x (2% of capital)
⛔SL: 10-20%
🎯1: 152.91
🎯2: 148.89
🎯3: 144.88
🎯4: 139.16

LTC follow XABCD partnernAbove is the pattern of LTC, the price and the wave need to correct to $59 to complete the parallelogram correction trend for the XABCD wave to approach the new target of $171. Let us know what you think about this code

Bitcoin: Drop one more wave and then rise againbitcoin is forming a butterfly pattern XABCD with 2 single waves.
You can sell at $24,629 and buy back at $16,986 and hold till the end of the next target at $28,000

The Method has been INITIATED If you know me and my method, yes we want to get in after the 61.8 hit, but
we wait for a clear break out before entering trade

XABC PATTER (RESISTANCE BROKEN)If you know you know..
61.8, break out happened..
ENTERED SL at the 61.8 and TP @ 1.27

CVS - Bearish BAT Harmonic PatternThe stock shows strong indication to remain bearish for the foreseeable future due to the formation of a strong bearish XABCD harmonics pattern.

BTC/USDT - Possible bearish XABCD formation! BULLS ARE BACK!Considering the inverse effect of DXY its still not too late to short sell BTC.
Following my previous analysis of Double Top Reversal, BTC continues to drop further. Currently my analysis is based
on the inverse effect $ has on BTC. My biased is to take a safe short trade upto TP1 as marked.

APPLE EX SWING PREDICTION XABCD PATTERNHere I took the trade for 3 reasons,
1 XABCD PATTERN
2 FIBONACCI level 0.618 is at the same level as strong support marked in purple on my chart which is where I set my take profit
3 the price was reaching the point D (the highest one) on the resistance of the descending channel existing since December.
4 RSI shows that the price is running out of steam, indicating a eventual drop

2609 Euro-NY SESSION Dollars making correction ?Hello traders,
On this Monday, maybe is a good time for all pairs to make a correction.
Just take this Dollars Indext as a signal that it is now turning down on 1h chart after EURO session begin.
This is a classic XABC pattern for sellers. Just keep eyes on candlestick signals when price reaching those dash lines.
GOOD LUCK !!!
LESS IS MORE!


Perfect break-out on XABCD PATTERN Trade according to your risk appetite
0.886 is an important level for target

downfall on crudegreat to see how crude obeys the exact pattern on xabcd and now has begun with a bearish fall

crude enters a bearish marketNote the XABCD pattern formed. Crude is at the highest selling point
It is advisable to use a put now at this level, as crude enters a bearish market

Jumia Technologies Monthly Chart I believe I can see at Jumia Technologies share, XABCD pattern on Monthly chart. This pattern is very bullish on the share..
