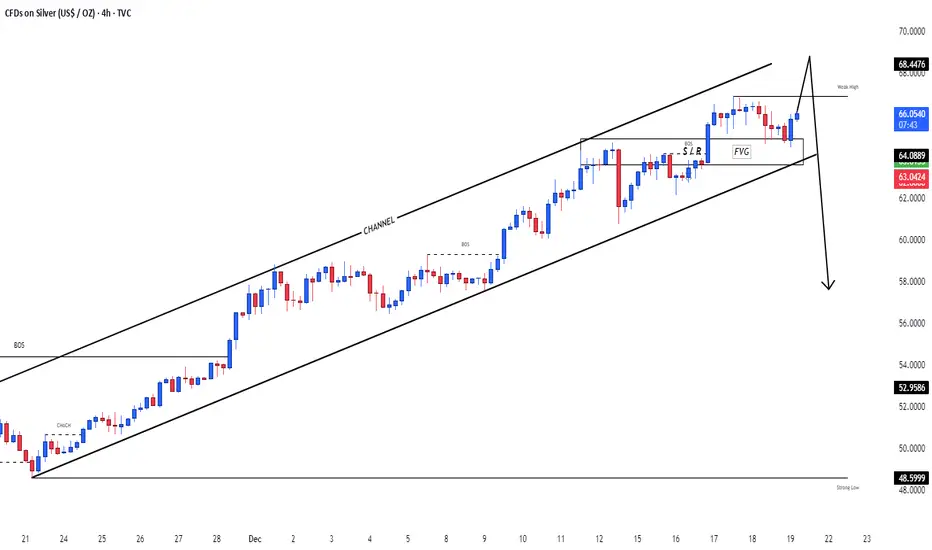
SilverXAGUSD
- Demand Zone
- Completed " 12345 " Impulsive Waves
- Break of Structure
- Descending Triangle as an corrective pattern in Short Time Frame
- Fair Value Gap
Xagusdbuy

XAG/USD Bullish Structure Signals Upside Continuation!🔥 XAG/USD — SILVER vs U.S. DOLLAR
📊 Metals Market Opportunity Blueprint (Day / Swing Trade)
🧭 Market Bias
🟢 BULLISH PLAN CONFIRMED
Silver continues to show strength with bullish momentum supported by macro and metals-sector flows. Volatility expansion favors trend continuation traders.
🟢 Trade Execution Plan
📌 Entry:
✅ Buy at any price level
➡️ Suitable for scaling, cost-averaging, or momentum entries based on individual strategy.
🛑 Risk Management
🔻 Stop Loss: 73.000
⚠️ Dear Ladies & Gentlemen (Thief OG’s),
This SL is not mandatory. Adjust according to your own risk management & position sizing.
Trading involves risk — manage capital wisely.
🎯 Profit Objective
🎯 Target: 80.000
📍 Strong resistance zone detected
📍 Overbought conditions possible near highs
📍 Potential correction & liquidity trap expected
🚨 Kindly secure profits near resistance levels.
⚠️ TP level is guidance only — adapt exits based on market behavior and your strategy.
🔗 Related Markets to Watch (Correlation Focus)
💵 U.S. Dollar Index (DXY)
📉 Weakening USD = Bullish for Silver
📈 Strong USD = Headwind for XAG/USD
🟡 XAU/USD (Gold vs USD)
Silver often follows Gold’s directional bias
Gold strength usually confirms Silver upside momentum
📈 US10Y Treasury Yields
Falling yields → Supports precious metals
Rising yields → Pressure on non-yielding assets like Silver
🛢️ WTI Crude Oil (USOIL)
Inflation expectations linked to energy prices
Rising oil can indirectly support Silver as an inflation hedge
🌍 Fundamental & Economic Factors to Watch
🏦 Federal Reserve Policy
Rate cut expectations → Positive for Silver
Dovish tone weakens USD, boosting metals
📊 U.S. Inflation Data (CPI / PCE)
Higher inflation → Silver demand as a hedge
Cooling inflation may slow momentum temporarily
🏭 Industrial Demand Outlook
Silver has strong use in solar panels, EVs, electronics
Global manufacturing recovery supports long-term demand
🌐 Geopolitical & Risk Sentiment
Market uncertainty → Safe-haven inflows into metals
Risk-off environments favor Silver accumulation
🧠 Trader’s Note
📌 This is a market opportunity blueprint, not financial advice.
📌 Trade responsibly, manage risk, and adapt to live market conditions.

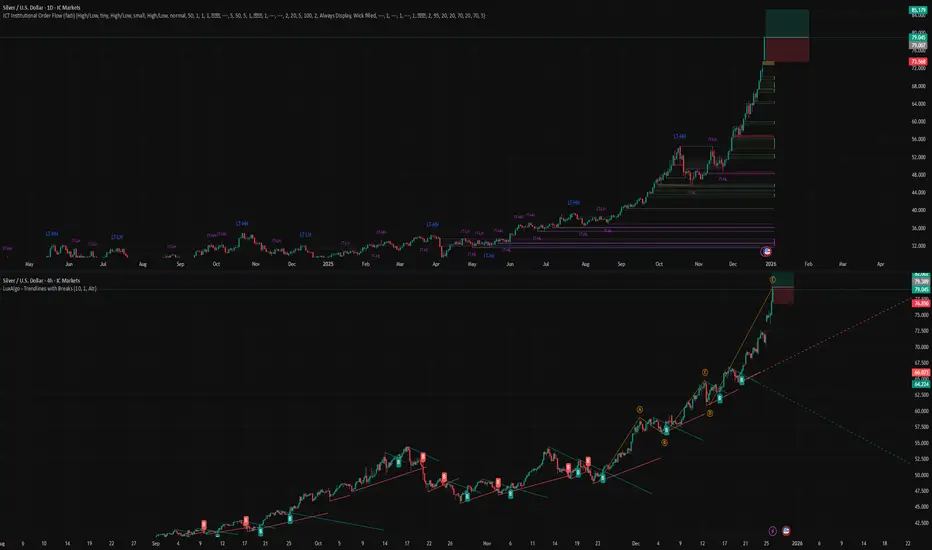
#SILVER(XAGUSD): Another Big Buy In Making, 2026 We Are Ready! **SMC|ICT Based Analysis On Silver (XAGUSD)**
Dear Traders,
We extend our best wishes for the upcoming New Year.
🔺Today, we will analyse Silver (XAGUSD). The month of December typically presents reduced market liquidity and volume due to numerous holidays. The market initiated with a positive liquidity gap at $83.50, subsequently experiencing a significant decline. The price descended to $70.44 and is currently trading at $71.51. This substantial sell-off indicates a high probability of further price depreciation. We anticipate the price to fall within the range of $68 to $66.
🔺Entering a position within our identified key levels may prove profitable, with take-profit targets established at the following key levels: the first at $75, the second at $78, and the swing key level at $85. These levels should be utilized as take-profit objectives. For stop-loss placement, we suggest setting it at $66, or at your discretion.
🔺We wish you a prosperous New Year and hope this year fulfils your aspirations. We sincerely appreciate your continued support throughout the years.
Team SetupsFX_

XAGUSD: Silver Awaits a New WaveXAGUSD: Silver Awaits a New Wave
XAGUSD Wave Overview (D1 and H4)
As a trader who has been practicing wave analysis for over ten years, I note that silver is currently forming an interesting structure, where the global picture and local movements are beginning to coalesce into a single scenario.
Chart D1: The global dynamics show the completion of an extended corrective formation. Silver is gradually breaking out of its sideways range, forming the basis for the next impulse. The wave structure indicates that the market is preparing for a phase change and may transition to a more directional movement.
Chart H4: The local pattern confirms the formation of key entry points. Here, the first signs of an impulse are visible, which could be the beginning of a larger wave. The internal structure appears to be the end of a correction and preparation for a move in the direction of the trend.
Main Scenario
After the completion of the corrective phase, a downward impulse sequence is expected to develop. This movement may be accompanied by increased seller activity and a gradual shift in priority to the downside.
Alternative Scenario
If the price holds above local peaks and forms a stable upward impulse structure, the priority will shift to continued growth. In this case, the correction will be considered incomplete, and silver could stage an additional rebound.
Trading Idea
Conservative approach: wait for confirmation of a breakout of key levels and enter with the trend.
Aggressive approach: use local impulses on H4 for earlier entries, but with tight stops.
In both cases, it is important to maintain strict risk management and adjust the plan as new impulses emerge.
Conclusion
Silver is at the transition point between a correction and a new impulse. The wave structure on D1 and H4 provides clear guidelines for action: watch for confirmation of the scenario and act with discipline.
SilverXAGUSD
- Bullish Channel as an corrective pattern in Long Time Frame
- HH - HL
- RSI - Divergence
- Break of Structure
- Change of Characteristics

Silver Breakout Confirmed or False Move Ahead?💎 PROFESSIONAL SILVER BLUEPRINT: XAG/USD BREAKOUT STRATEGY 💎
Day & Swing Trade Opportunity | Metals Market Analysis
🎯 TRADE SETUP SUMMARY
Asset: XAG/USD (Silver vs US Dollar)
Bias: Bullish Breakout
Timeframe: 4H & Daily Charts
Strategy Type: Momentum Breakout with Risk Management
📊 ENTRY & EXECUTION PLAN
⚡ ENTRY CONDITIONS (MUST HAVE ALL):
Price Breakout above 66.900 with 4H candle close
Volume Confirmation – Higher than average volume on breakout
Momentum Alignment – RSI above 50 (but not overbought >70 on entry)
🎯 PRIMARY TARGET: 69.000
Why this level? Previous major resistance turned support
Multiple confluence:
Fibonacci 61.8% extension from recent swing
Psychological round number
Overbought zone on weekly chart
🛡️ RISK MANAGEMENT PROTOCOL
Stop Loss: 65.500 (1.4% risk from entry)
Alternative SL options for different risk profiles:
Aggressive: 66.200 (1.05% risk)
Moderate: 65.500 (2.1% risk)
Conservative: 64.900 (3.0% risk)
🔍 MARKET CONTEXT & RATIONALE
📈 TECHNICAL CONFLUENCE:
Pattern Recognition: Ascending triangle breakout on 4H
Moving Averages: Price above 50 & 200 EMA on daily
Momentum: MACD histogram turning positive on daily
Volume Profile: High volume node at 66.50 supports bullish bias
🎭 MARKET PSYCHOLOGY:
"Police Barricade" at 69.000: Institutional resistance zone where profit-taking intensifies
Overbought Trap Risk: RSI likely to hit 75+ at target – smart money exits early
Retail Sentiment: Currently neutral – room for bullish momentum
🌐 CORRELATION MATRIX – RELATED ASSETS
1️⃣ PRIMARY CORRELATION: XAU/USD (Gold)
Correlation Coefficient: +0.85 (Strong Positive)
Key Insight: Silver often amplifies gold moves (2-3x volatility)
Watch For: Gold breaking $2,350 = Accelerated silver rally
Divergence Alert: If gold rises but silver lags → Caution needed
2️⃣ USD INFLUENCE: DXY (US Dollar Index)
Relationship: Inverse (-0.70 correlation)
Critical Levels: DXY below 104.50 = Bullish for silver
Data to Monitor: Fed statements, CPI data, employment reports
3️⃣ CURRENCY PAIRS WITH HIGH CORRELATION:
EUR/USD (+0.65) – Euro strength often mirrors silver strength
AUD/USD (+0.60) – Australia = major silver producer
USD/JPY (-0.55) – Risk sentiment indicator
4️⃣ COMMODITY & EQUITY CORRELATIONS:
Copper (+0.75) – Industrial demand proxy
S&P 500 (+0.50) – Risk-on environment supportive
US Treasury Yields (-0.60) – Real yields critical for non-yielding metals
⚖️ FUNDAMENTAL BACKDROP
🦅 MACRO DRIVERS SUPPORTING SILVER:
Monetary Policy: Dovish Fed pivot expectations
Industrial Demand: Green energy transition (solar panels, EVs)
Geopolitical: Safe-haven flows during uncertainty
Inflation Hedge: Persistent inflation concerns
⚠️ RISK FACTORS MONITORING:
USD Strength Surprise
Rate Hike Resurgence
Economic Slowdown impacting industrial demand
ETF Outflows (SLV holdings)
📋 TRADE MANAGEMENT PROTOCOL
A-SCALE EXECUTION (RECOMMENDED):
Position Size: 1-2% account risk per trade
Scale-In: 50% at breakout, 50% on retest of 66.900 as support
Scale-Out: 50% at 68.200, 50% at 69.000
Trailing Stop: Move to breakeven at 67.800
B-SCALE ADJUSTMENTS FOR MARKET CONDITIONS:
High Volatility: Reduce position size by 30%
Low Volume Breakout: Wait for confirmation candle
News Event Day: Consider entering after news settles
📊 CONFLUENCE CHECKLIST – BEFORE ENTERING
✅ Price > 66.900 (4H close)
✅ Volume > 20-day average
✅ DXY < 104.80
✅ XAU/USD trending upward
✅ No major economic news in next 4 hours
✅ Risk defined (max 2% of account)
"Are you trading silver this week? Bullish or bearish?"
"What's your silver target for Q2?"
"Which correlation do you find most reliable: gold or DXY?"
✨ LIKE if this adds value! FOLLOW for systematic trade blueprints! ✨
💬 COMMENT your silver outlook or trade adjustments below!
🔄 SHARE to help fellow traders navigate volatile markets!

SilverXAGUSD
- Completed " 12345 " Impulsive Waves
- Symmetrical Triangle as an corrective pattern in Long Time Frame
- Higher Highs
- RSI - Divergence
- Bullish Channel in Short Time Frame
Silver Holds Trend Structure as Buyers Step In🥈 XAG/USD: SILVER BREAKOUT SETUP | DAY/SWING TRADE BLUEPRINT 📊
💎 Asset: XAG/USD (Silver vs. U.S. Dollar) - Metals Market
⏰ Timeframe: Day Trading / Swing Trading
📈 MARKET ANALYSIS
Current Price: $61.89 (Real-time verified December 15, 2025)
Recent High: $64.62 (All-time high recorded this week)
Strategy: BULLISH MOMENTUM CONFIRMED
✅ Hull Moving Average Pullback Strategy Active
✅ Bullish outlook supported by Fed policy
✅ Strong momentum structure intact
✅ Rising industrial demand driving prices higher
🎯 TRADE PLAN
📍 Entry Zone: Buy above Hull MA @ $63.00
Wait for price confirmation above moving average
Strong buyer presence confirms breakout validity
🎯 Target Zone: $66.00
Major resistance confluence area
Overbought conditions likely
Profit-taking zone - scale out recommended
⚠️ Risk Disclaimer:
Ladies & Gentlemen (OG Traders) - Stop Loss and Take Profit levels are YOUR personal decision. Manage YOUR capital, take YOUR profits at YOUR own risk. This is educational analysis, not financial advice.
🔗 CORRELATED PAIRS TO WATCH (IN USD)
1️⃣ OANDA:XAUUSD (Gold) - $2,650-$2,680 range
📌 Correlation: Highly positive (+0.85-0.90)
💡 Gold and Silver move together as precious metals. When Gold pushes higher, Silver typically follows with amplified momentum.
2️⃣ TVC:DXY (U.S. Dollar Index) - Currently @ 98.32-98.53 range
📌 Correlation: Strongly negative (-0.70-0.80)
💡 Dollar declining for three consecutive weeks - weakening Dollar = stronger Silver prices. Watch for DXY breakdown below 98.00 support.
3️⃣ FX:EURUSD (Euro) - $1.05-$1.06 range
📌 Correlation: Positive (+0.60-0.70)
💡 Euro strength = Dollar weakness = Silver rally. Monitor Euro breakouts above 1.0600.
4️⃣ FX:USDJPY (Yen) - 152-156 range
📌 Correlation: Negative (-0.50-0.60)
💡 Yen strength signals risk-off sentiment, benefiting safe-haven metals like Silver.
5️⃣ CSE:GC (Gold Futures) - Watch for directional cues
📌 Correlation: Near-perfect positive (+0.90+)
💡 Gold futures lead Silver movements. Track institutional positioning.
🔑 KEY TECHNICAL POINTS
✔️ Breakout Confirmed: Silver consolidating above $64.00 level after reaching new highs
✔️ Volume Profile: Strong buyer accumulation on pullbacks
✔️ Moving Averages: Hull MA providing dynamic support structure
✔️ RSI: Monitor overbought zones near target - exit signals critical
✔️ Trend Structure: Higher highs, higher lows = bullish continuation pattern
💰 FUNDAMENTAL CATALYSTS
🔹 Silver added to U.S. critical minerals list - increasing strategic importance
🔹 Fed rate policy supporting precious metals environment
🔹 Industrial demand from solar/electronics sectors rising
🔹 Weakening Dollar providing tailwind for commodity prices
⚡ TRADING REMINDERS
✅ Manage position sizing (never risk more than 1-2% per trade)
✅ Watch DXY correlation - Dollar weakness = Silver strength
✅ Set alerts at $63.00 entry and $66.00 target zones
✅ Scale out profits at resistance levels
✅ Trail stops as price advances to lock gains
🚀 Let's Secure These Profits! Drop a 👍 if you're watching this setup!
📌 Follow for more metal market opportunities and professional trading blueprints!
#XAGUSD #Silver #MetalsTrading #TechnicalAnalysis #SwingTrading #DayTrading #ForexTrading #PreciousMetals #TradingSetup #MarketAnalysis
⚠️ FINAL DISCLAIMER: Trading precious metals involves substantial risk. This analysis is for educational purposes only and is not financial advice. Always conduct your own research and trade responsibly according to your risk tolerance.

XAG/USD: Major Resistance Cleared, What Comes Next?🥈 XAG/USD — SILVER VS U.S. DOLLAR
Metals Market • Swing / Day Trade Opportunity Guide 🧭📈
⚙️ Market Outlook — Bullish Confirmation
Silver has broken through a major resistance zone, shifting momentum firmly into bullish territory.
This breakout signals the presence of strong buyers stepping in, making the market attractive for both short-term and swing-trade setups.
🎯 Trade Plan
📌 Entry:
Enter at any available level after the confirmed breakout retest.
Bullish continuation patterns are forming, giving us a clean pathway to the upside.
🛡️ Stop Loss — Thief Style SL @ 57.000
Dear Ladies & Gentlemen (Thief OG’s), secure your capital wisely.
Adjust SL according to your personal system, risk appetite, and style.
I do not recommend copying my SL blindly — your strategy = your rules.
🎯 Target — Profit With Precision @ 62.000
We have:
🧱 Strong resistance zone
🔥 Overbought conditions expected
🎭 Potential bull-trap areas above
So escape with profits once the market hits our zone.
Dear Ladies & Gentlemen (Thief OG’s), your TP is also your choice — manage your profits with discipline.
🔗 Correlated & Related Pairs to Watch ($ Versions Included)
Tracking these helps confirm momentum, spot divergences, and follow overall metals sentiment.
1️⃣ XAU/USD (Gold vs USD) — TVC:GOLD
Why watch?
Gold and Silver often move together due to safe-haven demand.
When Gold surges strongly while Silver lags, Silver usually follows.
If Gold rejects from resistance, Silver may also cool off.
Key Point:
Gold strength = higher probability continuation in Silver’s bullish wave.
2️⃣ XAU/XAG (Gold-to-Silver Ratio) — $GoldSilverRatio
Why watch?
A falling ratio means Silver is gaining strength faster than Gold.
A rising ratio signals Silver weakness.
Key Point:
A drop in the ratio supports our bullish Silver narrative.
3️⃣ DXY (US Dollar Index) — TVC:DXY
Why watch?
Silver is priced in USD.
When DXY drops, metals typically rise due to USD weakening.
Key Point:
If TVC:DXY shows bearish momentum → Silver bullish continuation is more confident.
4️⃣ XAG/EUR (Silver vs Euro) — OANDA:XAGEUR
Why watch?
Useful to understand Silver’s global demand, not just USD-denominated.
If Silver is bullish across currencies, then the trend is fundamentally strong.
Key Point:
Multi-currency strength confirms genuine Silver demand.
5️⃣ Copper Futures (HG) — CAPITALCOM:COPPER
Why watch?
Silver has partial industrial demand.
When copper rises, it signals industrial activity strength → bullish for Silver.
Key Point:
Copper strength = supportive macro backdrop for Silver.
🧠 Final Outlook
A clean breakout, supportive cross-metal correlations, and favorable USD weakness give Silver an attractive path toward 62.000.
Trade smart, protect your capital, lock in profits, and execute like true Thief OG’s. 🥷📊

Silver Outlook Turning Stronger — Bullish Setup in Play!🥈 XAG/USD SILVER SURGE | Bullish Swing Trade Setup 📈
🎯 TRADE SUMMARY
Asset: XAG/USD (Silver vs US Dollar) | Metals Market 💰
Strategy: Swing Trade | Bias: BULLISH ⬆️
Risk/Reward: Professional Grade | Timeframe: Multi-Day Setup
📍 ENTRY STRATEGY - LAYERED APPROACH 🔄
Recommended Entry Zones (Multiple Buy Limit Orders)
1st Entry: $49.000 - Initial Position 20% 📌
2nd Entry: $49.500 - Add Position 30% 📌
3rd Entry: $50.000 - Final Entry 50% 📌
Strategy: Use limit orders at each level for better execution. Scale in progressively to optimize average entry price. This approach reduces risk and increases position efficiency.
🛑 STOP LOSS
Recommended SL Level: $48.000
⚠️ RISK DISCLAIMER: This is a suggested level based on technical structure. You must adjust your stop loss according to YOUR personal risk management, account size, and trading strategy. There is NO one-size-fits-all SL - ownership of risk is yours alone.
🎪 PROFIT TARGETS 🚀
Primary Target: $54.000
Confluence Factors:
Strong Resistance Zone Identified ✓
Overbought Condition Setup ✓
Potential Trap/Correction Reversal ✓
Bullish Breakout Extension ✓
⚠️ TP DISCLAIMER: This target is based on technical analysis. You control your profit-taking strategy. Consider taking partial profits at key resistance levels. Lock in gains at YOUR discretion - this is YOUR trading decision.
🔗 CORRELATED PAIRS TO MONITOR 📊
1️⃣ DXY (US Dollar Index) - INVERSE CORRELATION
Why: Silver prices move inversely to dollar strength
Watch For: If DXY weakens 📉, XAG typically strengthens 📈
Key Level: Monitor 103.50-105.00 zone
2️⃣ EURUSD - INDIRECT CORRELATION
Why: Euro strength correlates with silver strength (risk-on sentiment)
Watch For: EURUSD above 1.1000 supports silver bullish bias
Key Level: 1.0950-1.1050 range critical
3️⃣ GOLD/USD (XAU/USD) - POSITIVE CORRELATION
Why: Precious metals move together in risk-off/on scenarios
Watch For: Gold breaks above 2,700 = Silver momentum likely follows
Key Level: XAU/USD 2,650-2,750 zone
4️⃣ SPX500 (S&P 500) - RISK SENTIMENT
Why: Equities strength supports risk-on sentiment, bullish for silver
Watch For: SPX breaks 6,000+ supports precious metals outflow
Key Level: 5,850-6,050 pivot zone
5️⃣ COPPER/USD (HG) - INDUSTRIAL DEMAND
Why: Copper demand correlates with economic growth = Silver bullish signal
Watch For: HG above 4.30 = Risk-on sentiment confirmed
Key Level: 4.20-4.35 critical range
📈 KEY TECHNICAL POINTS
✅ Bullish Structure: Lower highs/lows pattern breaking
✅ Momentum: Building strength in watch zone
✅ Risk/Reward: Favorable 1:2+ setup
✅ Entry Precision: Multiple confirmation levels
✅ Exit Clarity: Clear profit target defined
⚡ QUICK TRADE CHECKLIST
Confirm DXY weakness before entry
Check Gold (XAU/USD) above 2,650
Verify EURUSD above 1.0950
Set all 3 limit orders at entry zones
Place SL at 48.000 (adjusted to YOUR risk)
Divide position into TP tranches
Monitor correlated pairs daily
🎓 TRADER'S NOTES
This analysis reflects current technical structure as of publication. Market conditions evolve. Adjust strategy based on:
Market news/data releases
Central bank decisions
Geopolitical events
Real-time price action
Remember: Past performance ≠ Future results. Trade with discipline. Manage risk first, profits follow.
💡 LIKE if helpful | 📌 SAVE for reference | ✅ FOLLOW for updates
Technical Analysis | Swing Trading | Metals Market | XAG/USD Strategy

XAG/USD : Bearish Pullback Meets Bullish Reversal at Key DemandXAG/USD 30-Minute Chart Analysis: Bearish Pullback Meets Bullish Reversal Signals at Key Demand Zone
This TradingView chart, authored by GoldMasterTrades on December 4, 2025, at 13:49 UTC-5, depicts the XAG/USD (Silver/US Dollar) pair on a 30-minute timeframe. It illustrates intraday price action spanning approximately December 2 to December 6, 2025, based on the x-axis timestamps (from 21:00 on Dec 2 through 12:00 on Dec 6). The candlestick format highlights a recent downtrend amid high volatility, with annotations pointing to a potential bullish turnaround. At the time of the snapshot, XAG/USD is quoted at 57.319, with a high of 57.424, low of 57.186, close of 57.234, marking a decline of -0.085 (-0.15%) and robust volume of 19.61K.
The overall narrative captures silver's volatile nature in late 2025, where the metal has surged over 83% year-to-date amid supply fears and industrial demand, but now faces short-term corrective pressure. The chart shows a sharp sell-off from highs near 58.00, probing a reversal zone around 57.20, accompanied by a volume burst and pattern bust—classic signs of exhaustion and impending recovery. This setup aligns with broader market dynamics, where silver recently hit record highs above $58.85 before pulling back. Below, I'll dissect the chart in a professional TradingView idea style, incorporating technical details, fundamentals, and trader insights for comprehensive depth.
Chart Overview and Timeframe Context
The 30-minute chart provides granular insights into short-term momentum, perfect for day traders navigating silver's sensitivity to USD strength, interest rates, and commodity cycles. XAG/USD, often correlated with gold but amplified by industrial uses (e.g., solar panels, electronics), has been in a parabolic uptrend throughout 2025, breaking all-time highs amid global supply constraints.
Key visual components:
Candlesticks: A series of red bearish bodies dominate the left and center, indicating seller control, with increasing wick lengths signaling volatility. Recent candles at the bottom show smaller bodies and longer lower shadows, hinting at buyer defense.
Annotations:
Green horizontal band: "Reversal Zone - Demand Zone" around 57.00–57.20, with a green circle marking the pivot low.
Purple label: "Volume Burst" at the trough, denoting a surge in activity.
Black upward arrow and label: "Pattern Bust," suggesting a failed bearish continuation.
"Ask" in red at 57.436 and "Bid" in blue at 57.237, reflecting the current spread.
U.S. flag and lightning icons at the bottom, likely indicating U.S. data releases (e.g., ahead of key jobs data).
Price Scale: Y-axis from ~56.00 to 59.00, with the action centered around 57.00–58.00, a psychologically significant area post-recent highs.
This configuration screams "bull trap reversal": bears push aggressively lower, but high-volume absorption at support sets the stage for a squeeze higher.
Technical Analysis: Patterns and Indicators
From a pure price action lens, the chart reveals a corrective pullback within a larger uptrend, with reversal cues emerging:
Downtrend Structure: The left side features a topping pattern with lower highs from ~58.50, cascading into a steep decline of about 1.5% (over 80 pips). This forms a descending channel, with red candles exhibiting long upper wicks—evidence of rejection at resistance. The move likely triggered by profit-taking after silver's explosive rally to $58.85 earlier in the week.
Reversal Zone and Demand Dynamics: The green band (57.00–57.20) represents a high-probability demand zone, where prior support (possibly from 4H/ daily charts) intersects with Fibonacci levels (e.g., 38.2% retracement of the recent leg up). Price tagging this area with a "Volume Burst" indicates capitulation: sellers exhaust, and institutions accumulate. In ICT/SMC frameworks, this is a liquidity sweep followed by order block defense.
Volume Burst and Momentum Shift: The purple annotation highlights a spike in volume (19.61K overall, but localized burst at lows), a bullish divergence signal. High turnover at extremes often precedes reversals, as it reflects panic selling absorbed by smart money. If overlaid with RSI (implied but not shown), expect oversold readings rebounding above 30.
Pattern Bust Mechanics: The "Pattern Bust" label with an upward arrow points to a failed bearish setup—likely a flag or head-and-shoulders continuation. Instead of breaking lower, price rejects the zone and forms a potential hammer/doji, trapping shorts and fueling a short-covering rally. A close above 57.50 would confirm the bust, targeting prior highs.
Key Levels and Projections: Support holds at 57.00 (zone low), with resistance at 57.80 (mid-channel) and 58.00 (psychological). Upside extensions could reach 58.50–58.90, aligning with record highs. Downside risks if the zone fails: 56.60–56.00, as noted in recent analyses.
This technical picture favors bulls if confirmed, but silver's volatility demands caution—average true range (ATR) likely elevated post-surge.
Fundamental Context for XAG/USD
Silver's 2025 performance has been stellar, up over 83% YTD driven by industrial demand (e.g., green energy) and supply fears, but December 4 sees a 1.67% dip to 57.51 amid USD rebound and data anticipation. Key drivers include:
Supply Constraints: Growing fears of shortages have propelled prices, with analysts eyeing $60+ long-term.
Economic Data: Pullback tied to rejection at $58.90 ahead of U.S. jobs data, which could influence Fed rate cut expectations.
Market Sentiment from X: Recent posts show mixed views—bullish on record breaks (e.g., "Ons Gümüş 58.8$ seviyesiyle tüm zamanların rekorunu kırdı") but bearish targets to 53-54$ if downside accelerates. Traders signal buys on H1 timeframes if 57.52 holds, or shorts on breaks. Elliott Wave forecasts suggest more upside post-correction.
Cross-reference with economic calendars: Watch NFP or inflation prints for volatility spikes.
Trade Idea: Bullish Reversal Setup with High R:R Potential
Capitalizing on the chart's signals:
Entry: Long on confirmation above 57.40 (breaking the downtrend line), or dip-buy in the reversal zone with volume support.
Stop Loss: Below the demand low at 56.90, risking 30–50 pips.
Take Profit: TP1 at 57.80 (prior resistance), TP2 at 58.50 (recent highs), TP3 at 59.00+ if momentum builds. Trail stops using 30-min ATR.
Risk-Reward Ratio: 1:2 minimum—aim for 60–100 pips upside.
Alternative: Short on zone failure below 57.00, targeting 56.60.
Timeframe Fit: Suited for intraday (2–8 hours), aligning with London/NY sessions.
This idea leverages SMC concepts like order blocks and liquidity grabs for edge.
Risk Management and Trader Mindset
Silver's leverage amplifies risks—volatility can wipe accounts without discipline. Core principles:
Position Sizing: Risk 0.5–1% per trade; use calculators to scale based on stop distance.
Emotional Control: Don't chase—wait for pattern bust confirmation to avoid whipsaws. Journal setups for review.
Multi-Timeframe Validation: Check 1H/4H for uptrend intact; avoid trading during low-liquidity hours.
Broader Mindset: View pullbacks as opportunities in bull markets. Study historical silver zones (e.g., 2021 surge) for patterns. Continuous education via webinars or X communities enhances edge.
Cautionary Note: Fundamentals like Fed policy can override techs—trade with news filters.
In summary, this 30-minute XAG/USD chart signals a high-conviction bullish reversal amid a corrective dip, with volume and structure supporting upside. If validated, it could propel silver back toward $58–60 resistance. Monitor real-time developments on TradingView or reliable platforms. Trade responsibly.

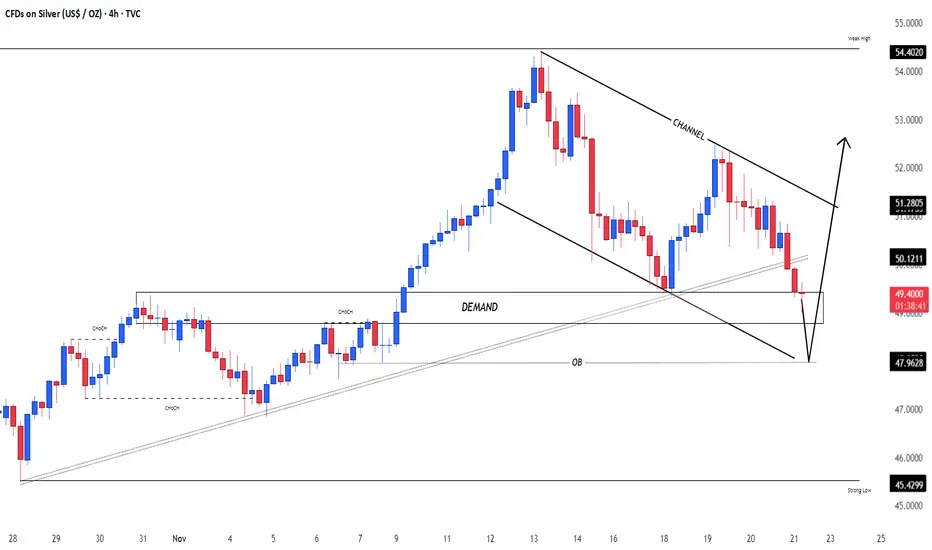
SilverXAGUSD
- Break of Structure
- Ascending Trendline
- Bearish Channel as an corrective pattern in Short Time Frame
- Demand Zone
- Order Block
SilverXAGUSD
- Completed " 123 " Impulsive Waves
- Fibonacci Level - 50.00% / 61.80%
- Break of Structure
- Double Top in Long Time Frame
- RSI - Divergence

SilverXAGUSD
- Completed " 12345 " Impulsive Waves and " AB " Corrective Wave
- Break of Structure
- Fibonacci Level - 61.80% / 78.60%
- Ascending Triangle as an corrective pattern in Short Time Frame
- Order Block

#XAGUSD(SILVER): Bears In Control Three Targets Swing SellSilver’s price dropped significantly yesterday, continuing a trend from last week’s Thursday when substantial trading commenced.
The data suggests an increase in bearish volume, indicating a potential selling opportunity. To identify a more precise entry zone, we should utilise smaller timeframes.
Once this is established, we can create a trading plan with strict risk management. Upon entry, we can select a suitable take-profit area based on our individual trading style and risk management preferences.
For further information, please like and comment on the ideas. Any questions comment down and we will happy to help.
Team Setupsfx

#SILVER: Will Price Momentum Take The Silver To $60?Metals is on the verge of reaching another record high after touching the $54 price point. It is highly probable that it will reach $60 or beyond. Currently, a smaller timeframe is suitable for minor corrections. Once a confirmation is obtained, a trade with strict risk management can be executed.
Best wishes and safe trading.
Team Setupsfx

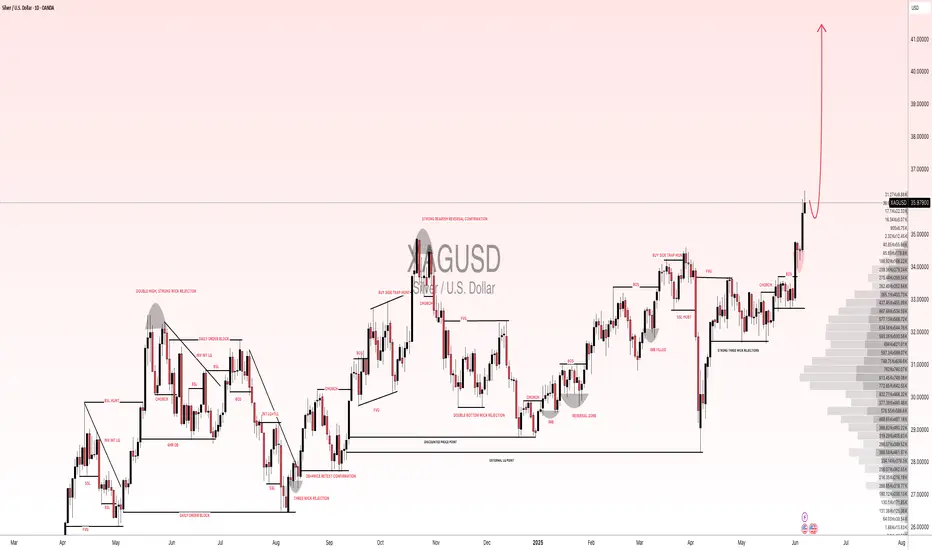
XAGUSD(SILVER):To $60 the silver is new gold, most undervaluedSilver has shown remarkable bullish behaviour and momentum, in contrast to gold’s recent decline. Despite recent news, silver remains bullish and unaffected by these developments. We anticipate that silver will reach a record high by the end of the year, potentially reaching $60.
There are compelling reasons why we believe silver will be more valuable in the coming years, if not months. Firstly, the current price of silver at 36.04 makes it the most cost-effective investment option compared to gold. This presents an attractive opportunity for retail traders, as gold may not be suitable for everyone due to its nature and price.
Silver’s price has increased from 28.47 to 36.25, indicating its potential to reach $60 in the near future. We strongly recommend conducting your own analysis before making any trading or investment decisions. Please note that this analysis is solely our opinion and does not guarantee the price or future prospects of silver.
We appreciate your positive feedback and comments, which encourage us to provide further analysis. Your continuous support over the years means a lot to us.
We wish you a pleasant weekend.
Best regards,
Team Setupsfx
XAGUSD, EXPECTING BUY till 44.20XAGUSD, I am EXPECTING BUY till 44.20 becuase of H4 FVG rejection and BISI, with tight stoploss of 442.33

Silver (XAG/USD) ▲ Thief Strategy: Layer & Escape!🔥🦹♂️ THIEF TRADER’S SILVER HEIST PLAN! 🚨💰 (XAG/USD "The Silver")
🎯 MISSION: BULLISH LOOTING! 🐂💎
💣 ENTRY: ANY PRICE! But Thief OG’s use LAYERS! 🎯👇
(Multiple Limit Orders = More Stolen Profit!)
🔫 Buy Limit Layers: 38.500 | 38.300 | 38.000 | 37.800 | 37.700 (Add more if you’re greedy!)
🛑 STOP LOSS: Thief SL @ 37.000 (Adjust based on your risk, OG!)
🚨 TARGET: 40.500 (But escape at 40.300 before cops arrive!) 🚔💨
🔫 THIEF TRADER’S RULES:
✔ Scalpers: Only LONG side! Use Trailing SL to lock stolen cash! 💰
✔ Swing Traders: Layer up & hold till escape zone! 🏦
✔ News Alert! 🚨 Avoid new trades during high-impact news! Protect your loot with Trailing SL!
💎 WHY SILVER?
✅ Bullish Momentum! 🐂🔥
✅ Weak Bears = Easy Loot! �💀
✅ Fundamentals & COT Report BACKING US! 📊🔍 (Check links below!)
🚀 BOOST THIS PLAN!
💥 Hit LIKE & BOOST! Help us STEAL MORE MONEY! 💸🔥
🚨 Stay Tuned for the NEXT HEIST! 🦹♂️💣
🎯 REMEMBER: TAKE PROFIT & RUN BEFORE COPS ARRIVE! 🚔💨
🔥 THIEF TRADER OUT! 🤑 SEE YOU IN THE NEXT TRADE! 💣🚀
"XAG/USD: Pirate’s Treasure Trade! Bullish & Loaded"🚨 SILVER HEIST ALERT! 🚨 XAG/USD Bullish Raid Plan (Thief Trading Style) 💰🎯
🌟 Attention Market Pirates & Profit Raiders! 🌟
🔥 Thief Trading Strategy Activated! 🔥
📌 Mission Brief:
Based on our elite Thief Trading analysis (technical + fundamental heist intel), we’re plotting a bullish robbery on XAG/USD ("The Silver Market"). Our goal? Loot profits near the high-risk resistance zone before the "Police Barricade" (bear traps & reversals) kicks in!
🚨 Trade Setup (Day/Swing Heist Plan):
Entry (📈): "The vault is open! Swipe bullish loot at any price!"
Pro Tip: Use buy limits near 15M/30M swing lows for safer pullback entries.
Advanced Thief Move: Layer multiple DCA limit orders for maximum stealth.
Stop Loss (🛑): 36.900 (Nearest 1H candle body swing low). Adjust based on your risk tolerance & lot size!
Target (🎯): 39.500 (or escape early if the market turns risky!).
⚡ Scalper’s Quick Loot Guide:
Only scalp LONG!
Rich thieves? Go all-in! Broke thieves? Join swing traders & execute the plan slowly.
Use trailing SL to lock profits & escape safely!
💎 Why Silver? (Fundamental Heist Intel)
✅ Bullish momentum in play!
✅ Macro trends, COT data, & intermarket signals favor upside!
✅ News-driven volatility? Expect big moves!
⚠️ WARNING: Market Cops (News Events) Ahead!
Avoid new trades during high-impact news!
Trailing stops = Your best escape tool!
💥 BOOST THIS HEIST!
👉 Hit LIKE & FOLLOW to strengthen our robbery squad! More lucrative heists coming soon! 🚀💰
🎯 Final Note: This is NOT financial advice—just a thief’s masterplan! Adjust based on your risk & strategy!
🔥 Ready to Raid? Let’s STEAL Some Profits! 🏴☠️💸
👇 Drop a comment & boost the plan! 👇
#XAGUSD #SilverHeist #ThiefTrading #ProfitPirates #TradingViewAlerts
(🔔 Stay tuned for the next heist!) 🚀🤫

Silver Rectangle Pattern Breakout | XAGUSD Analysis + Target🔍 Technical Overview
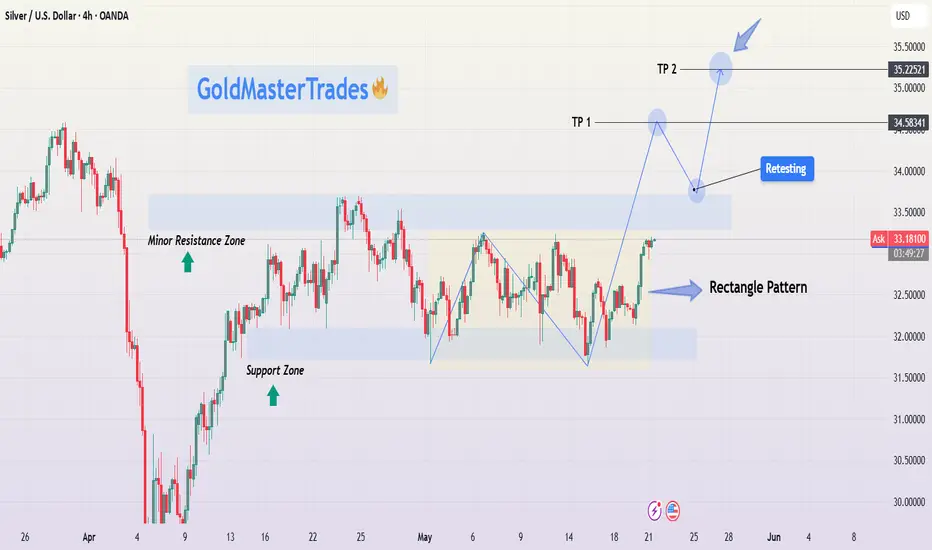
Silver has been forming a textbook rectangle consolidation pattern over the past few weeks, bouncing between a clearly defined Support Zone (~$32.10) and Resistance Zone (~$33.40). This range-bound movement indicates accumulation, a phase where smart money typically builds positions before initiating a directional breakout.
Currently, price action shows a breakout attempt toward the upper resistance. If momentum continues, we could see a bullish breakout, followed by a potential retest of the broken resistance (now support). A successful retest would confirm a high-probability setup for a move to higher targets.
📌 Key Technical Zones
Support Zone: ~$32.10
This level has been tested multiple times, with price consistently bouncing higher, signaling strong buyer interest.
Minor Resistance Zone: ~$33.00
Acted as an intermediate ceiling within the rectangle. Once broken, this level became a signpost for bullish continuation.
Main Resistance Zone: ~$33.40
The top boundary of the rectangle; this is the key breakout level.
Target 1 (TP1): $34.58
A logical resistance level based on previous price structure and breakout projection.
Target 2 (TP2): $35.22
A more extended target derived from the height of the rectangle pattern projected from the breakout point (measured move).
⚙️ Price Action Insights
Rectangle Pattern Behavior: Price ranged within horizontal support/resistance, forming consistent highs and lows — a strong signal of accumulation.
Momentum Shift: Recent bullish candles and higher lows suggest buying pressure is increasing.
Breakout in Progress: Price is currently pushing above the upper rectangle boundary. A confirmed breakout candle close followed by a retest would provide a higher-probability entry opportunity.
Retest Strategy: Retests are critical for confirmation. A pullback to ~$33.40 with rejection signals (e.g., bullish engulfing, pin bar) would strengthen the case for further upside.
🧠 Mindset & Strategy Explanation
This setup represents patience, structure, and discipline in trading:
✅ Wait for the Pattern : Rectangle patterns often trap impatient traders. Waiting for a confirmed breakout and retest gives higher-quality entries.
✅ Risk Management is Key : Use the structure of the rectangle to define risk. Stops should be set just below the last swing low or inside the range.
✅ Targeting with Precision: TP1 and TP2 are not random — they’re derived from prior resistance levels and pattern projections. This keeps your trading logical, not emotional.
✅ Mind Over Market: Don’t chase breakouts. Wait for confirmation. The retest is often your friend in swing trading setups like this.
📋 Trade Idea (Not Financial Advice)
📍 Entry: On confirmed breakout above $33.40 or retest of this level with bullish confirmation.
🎯 Target 1: $34.58 (partial take profit suggested)
🎯 Target 2: $35.22 (measured move projection)
🛑 Stop Loss: Below $32.70 (under recent support structure)
🔁 Optional: Trail stop loss after TP1 to lock in profits as TP2 approaches.
🧠 Final Thoughts for Traders
This chart provides a clean example of how price consolidates before expansion. The rectangle pattern allows for easy identification of entry/exit zones and offers a solid risk-to-reward setup. Whether you're a new trader learning to spot consolidation patterns or a seasoned pro looking for low-risk, high-reward setups — this XAGUSD formation is one to watch.
Keep an eye on volume and candle structure around the breakout zone. Confirmation is key. Discipline is everything.
Silver (XAG/USD) Bullish Trade Setup: Entry, Target & Stop-Loss Entry Point: ~32.35619
Take Profit (Target Point): 33.31252
Stop Loss: 31.87803
EMA 200 (Blue): 31.65932 – indicating long-term trend support.
EMA 30 (Red): 32.28304 – indicating short-term trend.
Current Price: 32.38220
The price is above both EMAs, which is typically bullish.
---
Analysis
1. Bullish Bias:
Price has broken and is holding above the entry zone.
Both EMAs are aligned in a bullish configuration (short-term EMA above long-term EMA).
The market structure shows higher lows and sideways consolidation, suggesting potential for a breakout.
2. Risk-Reward Ratio:
Risk (Entry to Stop Loss)

XAG/USD "The Silver" Metals Market Heist Plan (Scalping/Day)🌟Hi! Hola! Ola! Bonjour! Hallo! Marhaba!🌟
Dear Money Makers & Robbers, 🤑 💰💸✈️
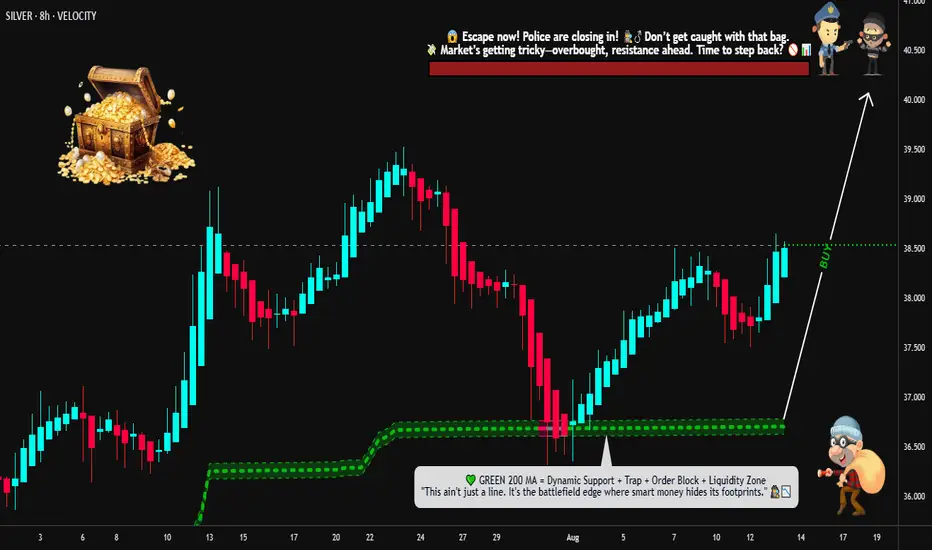
Based on 🔥Thief Trading style technical and fundamental analysis🔥, here is our master plan to heist the XAG/USD "The Silver" Metals Market. Please adhere to the strategy I've outlined in the chart, which emphasizes long entry. Our aim is to escape near the high-risk ATR Zone. Risky level, overbought market, consolidation, trend reversal, trap at the level where traders and bearish robbers are stronger. 🏆💸"Take profit and treat yourself, traders. You deserve it!💪🏆🎉
Entry 📈 : "The heist is on! Wait for the MA breakout (32.800) then make your move - Bullish profits await!"
however I advise to Place Buy stop orders above the Moving average (or) Place buy limit orders within a 15 or 30 minute timeframe most recent or swing, low or high level for Pullback entries.
📌I strongly advise you to set an "alert (Alarm)" on your chart so you can see when the breakout entry occurs.
Stop Loss 🛑: "🔊 Yo, listen up! 🗣️ If you're lookin' to get in on a buy stop order, don't even think about settin' that stop loss till after the breakout 🚀. You feel me? Now, if you're smart, you'll place that stop loss where I told you to 📍, but if you're a rebel, you can put it wherever you like 🤪 - just don't say I didn't warn you ⚠️. You're playin' with fire 🔥, and it's your risk, not mine 👊."
📍 Thief SL placed at the recent/swing low level Using the 2H timeframe (31.700) Day trade basis.
📍 SL is based on your risk of the trade, lot size and how many multiple orders you have to take.
🏴☠️Target 🎯: 33.900 (or) Escape Before the Target
🧲Scalpers, take note 👀 : only scalp on the Long side. If you have a lot of money, you can go straight away; if not, you can join swing traders and carry out the robbery plan. Use trailing SL to safeguard your money 💰.
💰💵💴💸XAG/USD "The Silver" Metals Market Heist Plan (Day / Scalping Trade) is currently experiencing a bullishness🐂.., driven by several key factors.👇👇👇
📰🗞️Get & Read the Fundamental, Macro, COT Report, Quantitative Analysis, Sentimental Outlook, Intermarket Analysis, Future trend targets... go ahead to check 👉👉👉🔗🔗
⚠️Trading Alert : News Releases and Position Management 📰 🗞️ 🚫🚏
As a reminder, news releases can have a significant impact on market prices and volatility. To minimize potential losses and protect your running positions,
we recommend the following:
Avoid taking new trades during news releases
Use trailing stop-loss orders to protect your running positions and lock in profits
💖Supporting our robbery plan 💥Hit the Boost Button💥 will enable us to effortlessly make and steal money 💰💵. Boost the strength of our robbery team. Every day in this market make money with ease by using the Thief Trading Style.🏆💪🤝❤️🎉🚀
I'll see you soon with another heist plan, so stay tuned 🤑🐱👤🤗🤩
