XAG/USD - H1 – Wedge Breakout | Silver Bullish Reversal SetupSilver (XAG/USD) has formed a well-structured falling wedge on the H1 timeframe , a classic bullish reversal pattern. Price is now attempting a breakout from the upper trendline after strong reactions from the lower boundary. OANDA:XAGUSD
📊 Technical Overview
The falling wedge shows decreasing bearish momentum, often seen before a trend shift.
Multiple touches on both trendlines confirm the validity of the pattern.
Price reacted strongly from a key demand zone, indicating buyer interest at lower levels.
If the breakout holds, upside potential opens toward psychological levels and higher-timeframe resistance zones.
As long as price remains above the demand area, bullish continuation remains in focus.
✅ Support this analysis with a
LIKE 👍 | COMMENT 💬 | FOLLOW 🔔
It helps a lot & keeps the ideas coming!
⚠️ Disclaimer: This analysis is for educational purposes only and does not constitute financial advice. Forex trading involves high risk. Trade only with capital you can afford to lose and always do your own research.
Xagusdidea

Silver — False Breakdown Signals Potential Bottom.In my previous Silver analysis, I mentioned that although price had found support around the 73 zone, it was clearly pressing into that level and a breakdown was possible.
That breakdown did happen.
Price pushed below support and dropped toward 64, but what followed is very interesting — and potentially informative for what comes next.
🔎 What the Market Told Us
After the dip to 64:
- price reversed quickly
- reclaimed the 73 support
- and confirmed the move as a false break
False breaks matter because they often trap sellers and shift momentum.
To add to this, the new week opened in the Asian session with a break above the falling trendline, further suggesting that bearish pressure may be fading.
📈 What This Could Mean
These developments increase the probability that a local bottom may be in place, opening the door for a potential leg higher toward:
🎯 90 zone
That becomes the logical upside objective if momentum builds.
📌 Key Zone for Bulls
The area bulls should monitor closely is:
👉 72.50–75.00
This is where buying interest may offer the best structure.
⚠️ VERY IMPORTANT NOTES
Silver is not a forgiving market right now.
1️⃣ Volatility Reality
If Gold is volatile these days, Silver’s volatility is extreme.
Daily swings are enormous...
2️⃣ Stop-Loss Logic
- A technically correct stop sits below 70.
- So a buy around 75 implies roughly a 7% risk.
- That makes this type of trade viable only with:
👉 very low leverage (max. 1:2)
Anything larger becomes gambling.
3️⃣ Risk-Reward Matters
From a pure risk-to-reward perspective, this trade only makes sense if you are targeting:
🎯 90 USD
Without that upside objective, the math simply doesn’t justify the exposure.
✅ Conclusion
Silver may be forming a bottom, but this is still a high-volatility environment.
Good opportunity? Possibly.
Easy trade? Definitely not.
Size small.
Respect volatility.

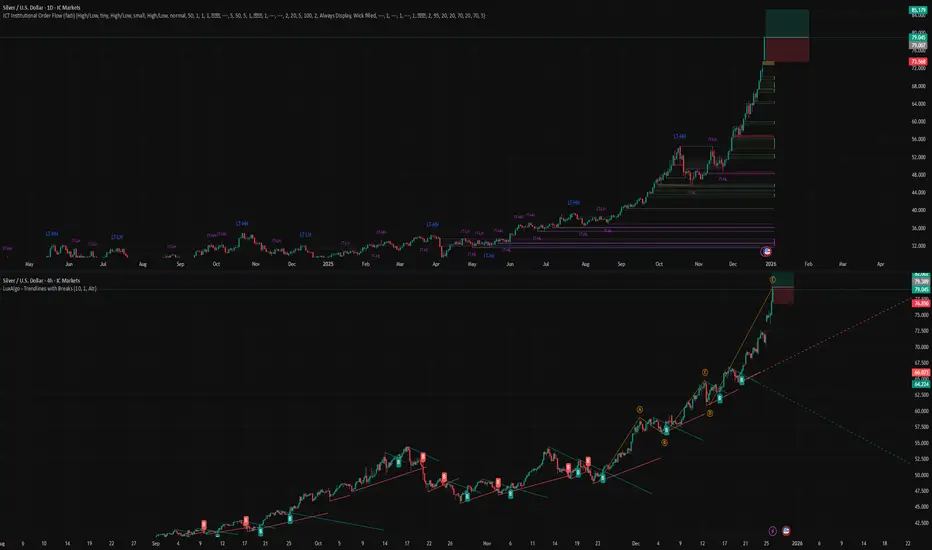
SILVER (XAGUSD) 4H — Smart Money Continuation Read Description.SILVER (XAGUSD) 4H
— Smart Money Continuation | BOS, Mitigation & Liquidity Roadmap
This Silver (XAGUSD) analysis is the result of deep structure reading, liquidity mapping and smart money execution logic — not random lines or assumptions.
From the left side of the chart, price respected multiple BOS (Break of Structure), confirming a strong bullish market condition. Each BOS was followed by continuation, showing that buyers were in full control and weak sellers were consistently removed from the market.
After forming a clear Higher Low (HL), price expanded aggressively and created a Higher High (HH).
This expansion left behind clean inefficiencies (BISI) and order blocks (OB) — areas where institutions executed large positions and price moved with intention.
Price then returned into the mitigation block, where previous imbalance and liquidity aligned perfectly.
This is not a coincidence — smart money often revisits these zones to rebalance inefficiency before continuing the primary trend.
The repeated SSS (Sell-Side Liquidity) markings show how liquidity was engineered and collected step by step.
Once sell-side liquidity was absorbed, price had no reason to stay low — resulting in strong continuation to the upside.
The roadmap on the chart highlights the logic clearly: • Liquidity is taken first
• Imbalance is revisited and mitigated
• Order blocks act as re-accumulation zones
• After rebalancing, price seeks higher external liquidity
This is not a signal and not financial advice.
It is a story of how price is delivered by smart money, written directly on the chart for those who know how to read it.
Markets don’t move randomly —
they move to fill orders, rebalance inefficiencies, and hunt liquidity.
🧠 Final Thought
If you stop chasing candles and start understanding why price pulls back,
you stop trading emotionally and start trading logically.
👉 Do you agree with this bullish continuation narrative on Silver, or do you see a different liquidity draw?
Drop your perspective in the comments and share this idea if it added value — let’s grow by learning together.

SilverXAGUSD
- Change of Characteristics
- Fair Value Gap
- Demand Zone
- Completed " 12345 " Impulsive Waves and " ABC " Corrective Waves
- Fibonacci Level - 78.60%

Silver - Here comes the bullrun top!☠️Silver ( OANDA:XAGUSD ) creates its final top now:
🔎Analysis summary:
Silver still remains totally bullish. But Silver also remains totally overextended and the metal is also approaching the final resistance trendline. With all of this short term weakness, this might be the final top on Silver. Just please wait for bearish confirmation.
📝Levels to watch:
$100
SwingTraderPhil
SwingTrading.Simplified. | Investing.Simplified. | #LONGTERMVISION

XAGUSD -WHO IS GOOD IN "TRIANGLES"? ?? COMMENT PLEASE 02-02-2026XAGUSD - G-Money's short version analysis based purely on technical analysis only, no nonsense or "BS". I do totally ignore any fundamental analysis, technical analysis only
I was always not so good with triangle, any ideas ??? Just wonder... 5m/15m/30m charts...
XAGUSD - still not in my technical analysis range...
Chart is itself explaining. Kept a "KISS" approach all the way ( "Keep It Simple, Stupid") & beginners friendly... ;)
I do hope that nobody ignoring SL ( Stop Loss) ! Without it, It is a fastest way to loose hard earned money...
;)
Trade safe & don't do "gambling". In the end it never pays, not worth it to risk loose all your $...
PS: above technical analysis is done for the community & educational purpose only! It is not a financial advice. Just share my very own insight to it.

Silver vs U.S. Dollar – Technical Breakdown Trade Setup🥈 SILVER (XAG/USD) "WHITE METAL vs GREENBACK" | Correction Play Blueprint 📉
Metals Market Opportunity Analysis | Day/Swing Trading Strategy
✅ LIVE MARKET DATA
Current Price: $85.05 USD per ounce
52-Week Range: $28.16 - $94.14 (Massive volatility spike ⚠️)
Recent High: $122.00 (January 29, 2026) - NEW ALL-TIME RECORD
Market Sentiment: STRONG BUY (Technical Indicators) / High Volatility Phase 🔥
RSI (14): 53.69 (Neutral territory)
MACD Status: Bearish Signal (-0.078)
Trading Status: Post-Parabolic Correction Mode
📊 TRADE PLAN OVERVIEW
Trade Direction: 🔴 BEARISH CORRECTION
After an astronomical 186%+ YTD gain and a parabolic push to $122 (new all-time high), silver is experiencing aggressive profit-taking. This creates a structural correction setup with defined risk zones.
Trade Type: Short-term Mean Reversion / Swing Trade Correction
Timeframe: 4H / Daily
Risk Level: ⚠️ Very High (Volatile environment)
📍 ENTRY STRATEGY
Primary Entry Zones:
Entry After Support Breakout: Any pullback & breakout confirmation below $84.03 - $79.86 support level
Aggressive Entry: Direct short entry after bearish candle confirmation below $82.50
Conservative Entry: Wait for retest of broken $86.27 resistance (now acting as supply)
Recommended Approach: Scale in gradually at 84.00 → 82.00 → 80.00 levels
Entry Signal Confirmation:
✓ Hourly close below key support
✓ MACD crossover to bearish territory
✓ Volume confirmation on downside move
✓ Structure invalidation (break of previous swing low)
🎯 PROFIT TARGETS (Ranked by Probability)
TP1 - CONSERVATIVE: $76.27 - $74.07
Rationale: 20-day moving average + Minor support cluster
Probability: HIGH | Risk/Reward: 1:1.5
Commentary: First logical landing zone after corrective bounce
TP2 - MODERATE: $70.00 - $68.50
Rationale: Major demand zone (previously strong base)
Probability: MEDIUM | Risk/Reward: 1:2.5
Commentary: Key psychological level + historical support
TP3 - EXTENDED: $60.00
Rationale: Major macro demand zone (50-60 USD band is old ATH support)
Probability: MEDIUM-LOW | Risk/Reward: 1:3.5+
Commentary: Longer-term corrective target IF momentum sustains
⚡ MAXIMUM RETRACEMENT ZONE:
$50-$55 USD Range = Old all-time high zone - Very strong macro support
$35-$40 USD Range = Last consolidation before parabolic breakout
🛑 STOP LOSS PLACEMENT (Critical Risk Management)
Hard Stop Loss: $90.90 - $92.00
Rationale: Weekly chart major resistance + Minor ascending channel upper boundary
Why Here: Break above confirms bullish continuation invalidates bearish thesis
Risk Tolerance: Tight stop = High probability trades
Extended Stop: $95.00+
For Aggressive Traders: Risk more for better entry validity
Warning: Market currently shows NO intention to rise above $94+ resistance
Additional Risk Zones to Monitor:
Invalidation Level: Hourly close above $86.27 = Abort position
Stop Movement: Trail stop 2-3% below recent swing highs as trade develops
🔥 The Thief OG Golden Rule: "Take profits when the market gives them. Don't be greedy. A live trader beats a broke legend." 💰
📈 TECHNICAL CONFLUENCE INDICATORS
Bearish Signals Active:
✓ MACD Negative Divergence (-0.078)
✓ Parabolic exhaustion after 186% YTD rally
✓ 30%+ single-day correction volatility
✓ Breakdown of ascending structure
✓ Profit-taking from institutional players (Chinese speculators exiting)
✓ 4H chart showing lower lows formation
Bullish Counter-Signals (Watch These):
⚠️ Moving averages still above price (support network strong)
⚠️ 50-Day SMA estimated at $86 (very close to current price)
⚠️ Long-term bullish trend remains INTACT on weekly
⚠️ Support cluster at $79.86 - $74.07 remains powerful
🌍 CORRELATED PAIRS TO MONITOR (Multi-Asset Confirmation)
Gold (XAU/USD) - 📊 WATCH CLOSELY
Current Status: Near $4,700-$4,800 (also at new highs)
Correlation: POSITIVE - Silver typically follows gold direction
Action: If gold breaks below $4,500, silver weakness intensifies
Key Level: $4,600 (major support) - If broken = Risk-off environment
USD Index (DXY) - 💵 INVERSE RELATIONSHIP
Current Status: Trading around 99.00-100.00 range
Correlation: NEGATIVE - Strong dollar = Weaker silver prices
Action: USD strength above 100.50 = Silver bearish continuation
Setup: Fed policy uncertainty = Swinging dollar/silver dynamics
Platinum (XPT/USD) - 🏆 SISTER METAL
Behavior: Similar corrective pattern forming
Entry Signals: Use platinum breakdowns to confirm silver weakness
Cross-Pair Setup: XAG/XPT ratio at extremes
Stock Market (S&P 500) - 📊 RISK SENTIMENT
Connection: Stock crashes = Flight to precious metals quality
Watch Level: S&P below 5,800 = Potential silver bounce
Setup: Market uncertainty = Volatility tailwinds for metal trades
Fed Funds Rate (FFR) - 🏦 MONETARY DRIVER
Current Level: 3.50% - 3.75%
2026 Outlook: Expected pause + potential 1-2 cuts
Impact: Lower rates = Silver positive / But timing uncertain
📋 FUNDAMENTAL & ECONOMIC FACTORS
What's Driving Silver RIGHT NOW:
🔴 BEARISH FACTORS (Supporting Our Short Setup)
Profit-Taking Capitulation (30% single-day plunge on Jan 30)
Parabolic exhaustion after $122 record high
Chinese speculators aggressively exiting positions
Momentum traders closing leveraged longs
Fed Policy Shift 📉
Kevin Warsh nominated as potential next Fed Chair (hawkish signal)
Initial market reaction: Risk-OFF for precious metals
Fed pausing rate cuts (3.50%-3.75% holding steady Jan 2026)
Reduced expectations for aggressive 2026 rate cuts
US Dollar Strength Expected
New Fed chair perception = Hawkish = Stronger USD
Silver priced in USD = Direct inverse relationship
Tariff uncertainties = Flight to currency stability
Geopolitical Risk Normalization
Initial Iran tensions easing (less safe-haven demand)
Greenland situation losing daily headlines
Risk premium compression likely
🟢 BULLISH FACTORS (Watch for Support)
Structural Supply Deficit 📦
Physical silver shortage continues
Industrial demand remains elevated (electronics, solar, 5G)
Mining output lagging demand for 8+ consecutive years
IMPACT: Any significant price drop = Buying interest appears
Debasement Trade Intact 💱
Government debt concerns unresolved
Currency devaluation risks persist
Real assets still attractive long-term
TIME FRAME: This is 6-12 month thesis (not immediate)
"Perfect Storm" Macro Setup 🌪️
Geopolitical uncertainties remain elevated
Economic growth/inflation balance unclear
Central bank coordination globally supportive
OPPORTUNITY: Corrections in this environment = Strong rebounds
Broken Support = Future Resistance
$118.00 → $107.50 → $101.15 (Fibonacci clusters)
These become strong resistance on any bounce
Limits upside on corrective rally
📅 ECONOMIC CALENDAR HIGHLIGHTS - February 2026
THIS MONTH'S KEY EVENTS:
Feb 5: Initial Jobless Claims (USA)
Feb 12: CPI Inflation Report (Core/Headline)
Feb 18: Federal Reserve Meeting Minutes Release
Feb 24: Durables Orders / Personal Income Data
Feb 26: PCE Inflation (Fed's preferred gauge)
IMPACT: Inflation data = KING for precious metals volatility
🔴 Hot CPI print = Potential reversal rally (bullish)
🟢 Soft CPI print = Supports continued correction (bearish)
FED TIMELINE ALERT: ⏰
May 15, 2026: Jerome Powell's term expires
New Chair Uncertainty: Market may reprice silver based on nomination announcement
Expected Cuts: Market pricing ~2 cuts; Fed projecting ~1 cut
Next Policy Decision: March 2026 FOMC meeting likely
💪 THIEF TRADER'S EDGE - Psychology & Wisdom
Motivational Trading Principles:
"A short in a parabolic move beats a long on the way down. Respect the market's direction, not your emotion." 🎯
"When everyone is buying at $122, the smart money exits. When everyone fears $70, that's when fortunes are built. Be contrarian." 💎
"Risk management separates professionals from gamblers. One bad trade = Years of losses. Protect your capital like it's sacred." 🛡️
"Silver dropped 30% in one day? That's a gift, not a disaster. This IS the correction traders dream about. Execute with discipline." ⚡
"Chart patterns don't care about your opinion. Price action is the only truth. Follow it, don't predict it." 📊
🎲 RISK ACKNOWLEDGMENT
THIS IS NOT ADVICE. REAL TALK:
Silver volatility is EXTREME right now (±4.95% daily average)
Leverage in precious metals = Fastest way to lose everything
Corrections can have counter-rallies (volatility whips)
A 50% retracement = Rally to $95+ is POSSIBLE before continuing lower
Your position sizing = Most important variable YOU control
WHAT COULD GO WRONG:
Fed hawkish pivot = Rapid USD strength = Silver crashes harder (risky for shorts)
Supply crisis news = Sudden squeeze higher
Geopolitical escalation = Flight-to-quality rally in silver despite technicals
Gap moves overnight = Stop losses getting blown through
✨ FINAL CHECKLIST BEFORE YOU TRADE
Do you have a PRE-PLANNED entry point?
Do you have a DEFINED stop loss with position size calculated?
Do you know your profit target AND profit-taking plan?
Are you NOT using leverage >2:1 (first 5 trades minimum)?
Have you backtested this pattern on 3+ prior corrections?
Is this trade size acceptable if you lose 100% (You can afford it)?
Are you trading your plan or your emotions?
If you answered NO to any = DO NOT TRADE. Wait for better setup. 🛑
🏆 THIEF OG FINAL MESSAGE
"The biggest winners in trading aren't the ones with the luckiest trades—they're the ones who know EXACTLY how much they can lose and still sleep at night. That's the game. Master your risk, and profits take care of themselves. Now go get those silver ounces! 🥈"
Made with 💪 Thief OG Energy | For Traders Who Know The Game 🎯🔥

XAG/USD - A QUICK UPDATE - 30-01-2026XAGUSD - G-Money's short version analysis based purely on technical analysis only, no nonsense or "BS". I do totally ignore any fundamental analysis, technical analysis only
XAGUSD - PATIENCE TIME...
1H DID HIT TP TARGET AND 15m was "excluded" and nicely "manipulated"
Who did enter this trade earlier congratulations! Who missed it... See you next time! ;)
Chart is itself explaining. Kept a "KISS" approach all the way ( "Keep It Simple, Stupid") & beginners friendly... ;)
I do hope that nobody ignoring SL ( Stop Loss) ! Without it, It is a fastest way to loose hard earned money...
;)
Trade safe & don't do "gambling". In the end it never pays, not worth it to risk loose all your $...
PS: above technical analysis is done for the community & educational purpose only! It is not a financial advice. Just share my very own insight to it.

Silver Strength (XAG/USD) – Safe-Haven Demand Fuels Upside📝 Description 🔍 Setup (Market Structure) FX:XAGUSD
XAG/USD continues to show strong bullish structure on the H1 timeframe.
Price has respected a well-defined demand zone with multiple retests and rejections, confirming strong buyer interest. Silver is trading above EMA and Ichimoku cloud support, signaling trend continuation rather than exhaustion.
The broader backdrop supports metals as safe-haven assets, keeping the upside bias intact.
📍 Support & Resistance
🟡 Key Demand / Support Zone: 85.00 – 87.00
🟢 1st Resistance: 98.00
🟢 2nd Resistance / Extension Target: 101.00
Trend strength remains valid above demand with higher-high structure intact
🌍 Fundamental Context
1.Rising geopolitical tensions and trade-related uncertainty
2.Investors rotating into safe-haven assets like Silver
3.Risk-off sentiment continues to support precious metals
#XAGUSD #Silver #PreciousMetals #SafeHaven #ForexTrading #TechnicalAnalysis #PriceAction #TradingView #Kabhi_TA_Trading
⚠️ Disclaimer
This analysis is for educational purposes only.
Markets are volatile — always manage risk properly and use a stop-loss.
💬 Support the Idea 👍 Like if you’re bullish on Silver
💬 Comment: Breakout continuation or pullback first? 🔁 Share with traders watching metals

Silver vs. U.S. Dollar: Comprehensive Bullish Retest Evaluation🔥 XAG/USD (Silver vs U.S. Dollar)
⚡ Metals Market Opportunity Blueprint | Day & Swing Trade
📌 Asset Overview
Instrument: XAG/USD — Silver vs U.S. Dollar
Market: Precious Metals
Trading Style: Day Trade / Swing Trade
Bias: Bullish Continuation 🟢
🧭 Trade Plan – Bullish Framework
✔ Multiple pullback retests = acceptance
✔ No aggressive breakout chasing — patience wins
Confirmation Logic:
Shallow pullbacks + higher lows
Momentum cooling without breakdown = continuation setup
🎯 Entry Strategy – Thief Layer Method 🧠
Execution Style: Any Price Entry via Layered Limits
This setup uses a Thief Layering Strategy — deploying multiple buy-limit orders instead of a single entry to manage volatility and reduce emotional execution.
Buy Limit Layers (Example):
90.000
92.000
94.000
👉 You may expand or compress layers based on your own risk profile and execution style.
🚨 Target Zone – High Voltage Area ⚠️
Target: 101.000
This zone acts like a High-Voltage Shock Fence Gate
✔ Historical selling pressure
✔ Overbought risk zone
✔ Liquidity trap potential
💡 Escape with profits before greed kicks in.
🛑 Stop Loss – Thief Risk Control
Protective SL: 89.000
⚠️ Capital protection always comes before profit hunting.
⚖️ Risk Disclaimer (OG Rule)
Dear Ladies & Gentlemen (Thief OGs),
This plan does not force you to use only my TP or SL.
Trade management is your responsibility — secure profits when the market pays you.
🌍 Live Fundamental & Economic Drivers (Monitor Actively)
Silver is highly sensitive to macro-economic shifts, especially USD-driven flows and global risk sentiment:
🔹 U.S. Dollar Strength / Weakness
Softer USD → Silver gains tailwind
Strong USD → Short-term pullbacks, not trend reversal
🔹 U.S. Interest Rate Expectations
Falling or stable rate outlook supports non-yielding assets like Silver
Hawkish tone increases volatility, not immediate bearishness
🔹 Inflation Expectations
Rising inflation keeps Silver attractive as a value hedge
Sticky inflation = structural demand support
🔹 Global Manufacturing & Industrial Demand
Silver demand remains tied to electronics, solar, and industrial usage
Expansion signals strengthen medium-term bullish bias
🔹 Upcoming High-Impact Events to Track
U.S. inflation data
Central bank policy signals
Employment & growth indicators
(Volatility expected — execution discipline required)
🔗 Related Pairs to Watch (Correlation Watchlist)
💵 TVC:DXY (U.S. Dollar Index)
Inverse relationship
Dollar weakness = Silver strength confirmation
OANDA:XAUUSD (Gold vs U.S. Dollar)
Silver often follows Gold’s directional bias
Gold strength adds confidence to Silver longs
📈 US Real Yields
Falling real yields support precious metals
Rising yields may cause pullbacks, not immediate reversals
📊 S&P 500 / Risk Sentiment
Risk-off flows often benefit precious metals
Sudden equity stress can accelerate Silver upside
🧠 Final Thought
This is not a breakout chase — it’s a controlled accumulation play using structure, patience, and layered execution.
📌 Trade smart. Scale wisely. Protect capital first.
🔥 If you see the structure, you’re already ahead of the crowd.

#SILVER(XAGUSD): Another Big Buy In Making, 2026 We Are Ready! **SMC|ICT Based Analysis On Silver (XAGUSD)**
Dear Traders,
We extend our best wishes for the upcoming New Year.
🔺Today, we will analyse Silver (XAGUSD). The month of December typically presents reduced market liquidity and volume due to numerous holidays. The market initiated with a positive liquidity gap at $83.50, subsequently experiencing a significant decline. The price descended to $70.44 and is currently trading at $71.51. This substantial sell-off indicates a high probability of further price depreciation. We anticipate the price to fall within the range of $68 to $66.
🔺Entering a position within our identified key levels may prove profitable, with take-profit targets established at the following key levels: the first at $75, the second at $78, and the swing key level at $85. These levels should be utilized as take-profit objectives. For stop-loss placement, we suggest setting it at $66, or at your discretion.
🔺We wish you a prosperous New Year and hope this year fulfils your aspirations. We sincerely appreciate your continued support throughout the years.
Team SetupsFX_

3 Scenarios for #Silver (1. Breakout 2. Retest 3. Breakdown)Setup
Bullish - Uptrend pullback
9th bullish month (overbought)
Rising trendline
Bullish momentum
Above 20/50/200 MAs
RSI bullish
Commentary
Price remains in a strong uptrend albeit heavily overbought. The natural upside target is $100 per oz but there is likely to be considerable volatility on the way there.
Strategy
Buy near former highs ~83.50
Buy bullish candle formation
No trade if up-trendline breaks

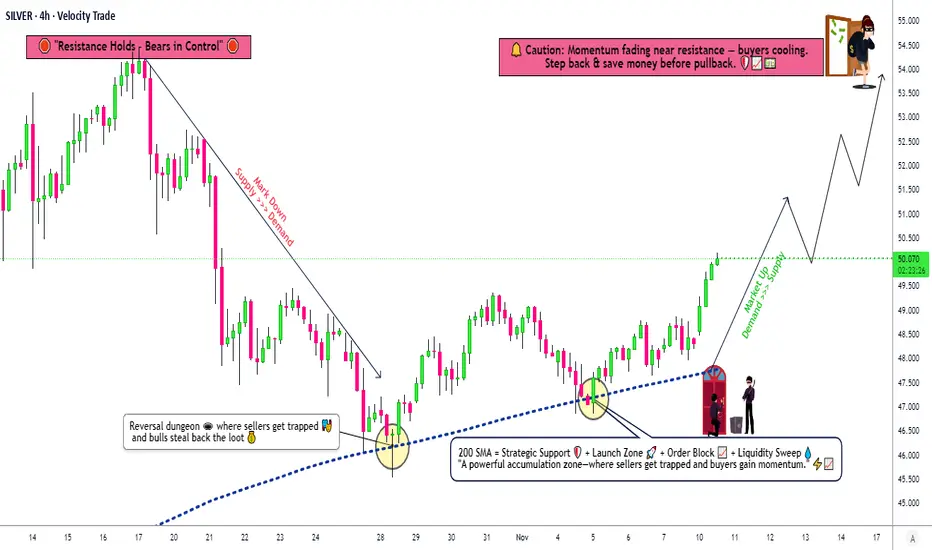
XAG/USD Key Zone Reaction – Are Bulls Ready to Take Control?🥈 XAGUSD: SILVER VS US DOLLAR 💰
Metals Market Opportunity Blueprint | Swing Trade Analysis
📊 MARKET STRUCTURE & SETUP
✅ Current Price Action: $48.34 | 52-Week Range: $28.16 - $54.50
✅ Technical Trend: Bullish Bias Confirmed
✅ Setup Type: Double Pullback Retest of 200 SMA
🎯 THE THIEF STRATEGY: LAYERED ENTRY APPROACH
This is NOT a single entry point strategy. We employ the THIEF LAYERING METHODOLOGY — multiple limit orders positioned at strategic support zones to maximize entry efficiency and reduce average entry price.
📍 ENTRY LAYERS (Buy Limit Orders):
Layer 1: $48.000 ⭐ (Immediate Support)
Layer 2: $48.500 ⭐ (Pullback Zone)
Layer 3: $49.000 ⭐ (Resistance Break)
Layer 4: $49.500 ⭐ (Extended Support)
💡 Pro Tip: You can increase/decrease layers based on your risk tolerance and position size. Accumulate, don't dump!
🛑 STOP LOSS MANAGEMENT
📌 Thief Original SL: $47.000
⚠️ This is MY suggested level based on technical structure
🔴 IMPORTANT: Dear Ladies & Gentlemen (Thief OG's) — Set YOUR OWN stop loss based on YOUR risk profile
💪 This is YOUR money, YOUR risk, YOUR decision
Adjust SL based on your strategy, account size, and risk/reward ratio
🚀 PROFIT TARGET STRATEGY
🎪 Target Zone: $54.000
📈 Technical Basis: 200 SMA acts as strong dynamic resistance
⚡ Market Structure: Overbought territory warning
🔔 Trap Alert: Potential sell-side liquidity trap at resistance
⚠️ Target Notes:
🔴 IMPORTANT: Dear Ladies & Gentlemen (Thief OG's) — Set YOUR OWN take profit target
📊 Don't just copy my TP blindly — analyze price action yourself
💼 You earn the profits, you manage the exit — YOUR choice, YOUR reward
Consider trailing stops or partial profit-taking strategy
🔗 CORRELATED PAIRS TO MONITOR (Key Dollar Pairs)
1️⃣ TVC:DXY (US Dollar Index)
Correlation: INVERSE ↔️ As DXY strengthens, XAG/USD weakens
Why Monitor: Strong dollar headwind for silver prices
Watch Level: DXY above 105.00 = bearish for silver
Strategy: If DXY rallies, reduce silver long positions
2️⃣ $XAU/USD (Gold vs Dollar)
Correlation: POSITIVE ✅ Silver follows gold's lead
Why Monitor: Gold is the "big brother" in precious metals
Watch Level: If gold breaks $2,100, silver likely follows
Strategy: Gold weakness = caution on silver longs
3️⃣ FX:EURUSD (Euro vs Dollar)
Correlation: INVERSE ↔️ Weak dollar = strong euro
Why Monitor: Dollar weakness supports precious metals
Watch Level: EURUSD above 1.1200 = bullish for silver
Strategy: Strong euro environment = tailwind for XAG
4️⃣ FX:USDJPY (Dollar vs Japanese Yen)
Correlation: INVERSE ↔️ Dollar weakness supports risk-on sentiment
Why Monitor: Risk appetite indicator (yen often "fear" currency)
Watch Level: USDJPY below 145.00 = risk-on (silver bullish)
Strategy: Lower USDJPY = better environment for commodities
5️⃣ SP:SPX / S&P 500 Index
Correlation: POSITIVE ✅ Risk-on markets support commodities
Why Monitor: Stock market rallies often lift precious metals
Watch Level: SPX new highs = bullish momentum for silver
Strategy: Market strength = broader bullish sentiment
📋 TRADE CHECKLIST BEFORE ENTRY
✅ Price action confirms double pullback on 200 SMA
✅ DXY showing weakness or neutral bias
✅ XAU/USD supporting bullish thesis
✅ No major macro events in next 4-6 hours
✅ Volume confirmation on breakout
✅ Risk/Reward ratio minimum 1:2
✅ Position size = % of account (YOUR decision)
⚡ KEY TRADING RULES
Layering ≠ Averaging Down Losers
Build positions at PRE-PLANNED levels only
Don't add to losing positions outside your strategy
Stop Loss is Sacred
NO moving stops to breakeven without reason
Protect capital first, chase profits second
Take Profits Strategically
Partial exits: Scale out at resistance zones
Don't go all-in, don't take all-out at once
Dollar Monitoring is Mandatory
Strong DXY = reconsider position
Weak DXY = stay long with conviction
Risk Management Over Everything
Your SL & TP = your rules
No trade is worth emotional decision-making
Strong Bullish Structure Developing in Silver🚀 XAG/USD (SILVER) Swing Blueprint | Bullish Structure Intact | Key Levels Mapped! ⚔️
🎯 Metals Market Opportunity: Silver (XAG/USD) Swing Trade Setup
📈 Direction: Bullish | Swing Trade
🏷 Asset: XAG/USD - Silver vs. U.S. Dollar
⚖️ Core Thesis: Silver is building a potential swing bullish structure, aiming for a significant resistance zone. This plan outlines the key framework.
📊 Trade Plan (Blueprint)
✅ Entry Zone: Consider entries on pullbacks or strength confirmation. (Any price level entry - discipline is key).
🛑 Stop Loss (Risk Management):
"This is thief SL @ 54" 💎
Dear Traders (The OG Crew), 👊
This is my protective level. YOU MUST adjust your SL based on YOUR OWN risk tolerance & strategy. I do not recommend using only my level. Manage your capital wisely.
🎯 Target Zone: @ 62 Area.
This aligns with a strong historical resistance + potential overbought/trap zone. 🪤 The strategy is to "escape with profits" as price approaches.
Note: This is my target. Take profits based on your own analysis and risk-reward goals.
🔍 Related Pairs & Market Correlations (Must-Watch) 🔗
Monitoring these pairs provides context for Silver's move:
🦅 TVC:DXY (U.S. Dollar Index):
Key Point: INVERSE correlation. A weaker TVC:DXY typically boosts commodities priced in USD, like Silver. Watch for DXY breakdowns for added Silver bullish confirmation.
🟡 XAU/USD (Gold):
Key Point: STRONG positive correlation. Gold is the leader. A strong, bullish Gold market often drags Silver higher (and vice-versa). Silver's moves can be more volatile ("Gold on steroids").
📈 US 10-Year Treasury Yields / TVC:TNX :
Key Point: General inverse relationship. Rising real yields can pressure non-yielding metals. Watch for yield pullbacks that may relieve pressure on Silver.
⛽️ Crude Oil ( BLACKBULL:WTI / ICMARKETS:XBRUSD ):
Key Point: Inflation/Commodity Sentiment Gauge. Rising oil can signal broader commodity strength and inflation fears, which can benefit Silver as a real asset.
📊 Copper ( CAPITALCOM:COPPER ) & AMEX:GDX (Gold Miners ETF):
Key Point: Industrial / Risk Sentiment. Copper confirms industrial demand outlook. AMEX:GDX strength confirms bullish precious metals sector momentum.
💎 Final Notes
This is a blueprint, not financial advice.
You are the captain of your own capital. 🧭
Always use proper position sizing.
Markets are dynamic—always monitor for structure breaks.
Let's get this bread... responsibly! 🥖
✅ Like & Follow if you find this detailed blueprint valuable! It helps the idea reach more traders. 💡
#SILVER #XAGUSD #TradingSetup #SwingTrading #Commodities #PreciousMetals #Forex #TradingView #DXY #GOLD #XAUUSD #Analysis
SilverXAGUSD
- Completed " 12345 " Impulsive Waves
- Change of Characteristics
- Fibonacci Level - 38.20% / 50.00%
- Break of Structure
- RSI - Divergence

Silver Buy Trading Opportunity SpottedH1 - Strong bullish move
No opposite signs
Until the two support zones hold I expect bullish continuation
👉 If you enjoy this analysis, please Like, Follow, and Support the profile! Your engagement motivates us to share more quality setups.

Silver - This metal is blowing up now!💣Silver ( OANDA:XAGUSD ) is rallying even higher:
🔎Analysis summary:
Just a couple of months ago, we witnessed another bullish break and retest on Silver. It was quite obvious that Silver will rally accordingly and just recently, we experienced another +150% rally. However, looking at the higher timeframe, Silver is still not done.
📝Levels to watch:
$100
SwingTraderPhil
SwingTrading.Simplified. | Investing.Simplified. | #LONGTERMVISION

SilverXAGUSD
- Completed " 12345 " Impulsive Waves and " ABC " corrective waves
- Break of Structure
- Consolidation Phase
- Bearish Channel as an corrective pattern in Short Time Frame
- Fair Value Gap

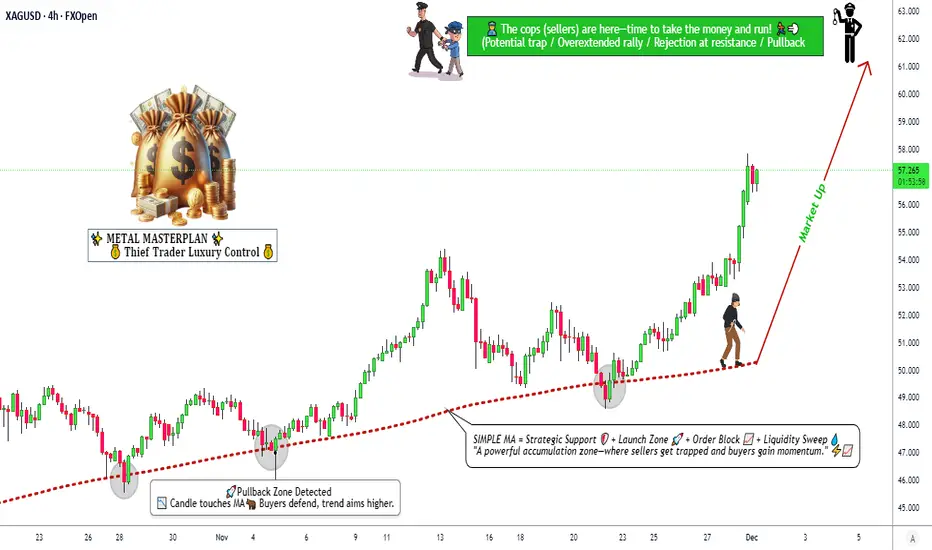
XAG/USD › Bullish Price Structure & Trade Planning📈 TITLE — SILVER SWING BREAKOUT 📊 XAG/USD “SILVER vs USD” 🥈
Market Blueprint | Bullish Thief Strategy | Layered Entries + Macro Signals
📝 DESCRIPTION
🔔 Asset: XAG/USD – Silver vs U.S. Dollar (Metals)
💡 Trade Bias: Bullish (Day / Swing)
🚀 Plan Summary:
Silver remains in a structural uptrend and is trading at elevated levels with strong industrial and safe-haven demand. Macro drivers include dovish Fed expectations, persistent supply deficits, and robust demand from solar, EV & tech sectors — all bullish fundamentals supporting higher prices.
📌 Entry Strategy (Thief Layering)
Thief layering strategy — place multiple buy limits to scale into strength with risk control:
🎯 Layer Buy Zones (example):
• 🟩 76.000
• 🟩 78.000
• 🟩 80.000
(You can increase/add layers based on volatility & personal risk tolerance.)
📌 Why layering?
This technique helps build position as price retests structural supports while capturing volatility swings.
🔥 Stop-Loss (Risk Control)
🛑 Thief Stop-Loss @ 74.000
👉 Adjust SL based on your risk profile — trade safe, manage risk first.
🎯 Target / Profit Zones
🏁 Target Area: ~87.000
Key resistance zone near overbought levels & potential reversal/top trap region — take partial profits. Let price action confirm continuation.
Targets are guidelines — manage according to your risk/reward.
📊 Correlated Pairs to Watch
Watch correlations with:
• XAU/USD (Gold) — safe-haven behavior often aligns with silver trends.
• USD Index (DXY) — stronger USD can cap metals; weaker USD fuels bullion upside.
• Copper / Base Metals — industrial demand context.
Correlation signals give context on trend strength vs macro flows.
📈 Macro & Fundamental Drivers (Latest)
Bullish Fundamentals:
🔹 Silver has seen a historic rally and recently touched near record highs, driven by supply constraints + industrial demand.
🔹 Structural supply deficits and growing tech/green energy demand support higher price floors.
🔹 Market pricing still reflects expectations of Fed rate cuts in 2026, pushing yield-less assets higher.
Risk / Volatility Factors:
⚠ Index rebalancing and technical selling could add short-term pressure.
⚠ Silver historically more volatile than gold → wider swings possible.
📅 Economic & News Catalysts
Keep an eye on these reports with London time relevance:
📌 US Federal Reserve rate decisions & press releases
📌 US CPI & employment (NFP) data
📌 ISM Manufacturing + global PMIs
📌 China industrial output & export policies
These data points shape USD direction, interest-rate expectations, and commodity flows.
💬 Risk Reminder (Thief OGs)
Dear traders, sizing SL/TP is YOUR decision — trade your plan. Profits are earned when disciplined. Live setups change — adapt.
📌 This is a guideline plan based on current structure, not financial advice.
SilverXAGUSD
- Demand Zone
- Completed " 12345 " Impulsive Waves
- Break of Structure
- Descending Triangle as an corrective pattern in Short Time Frame
- Fair Value Gap

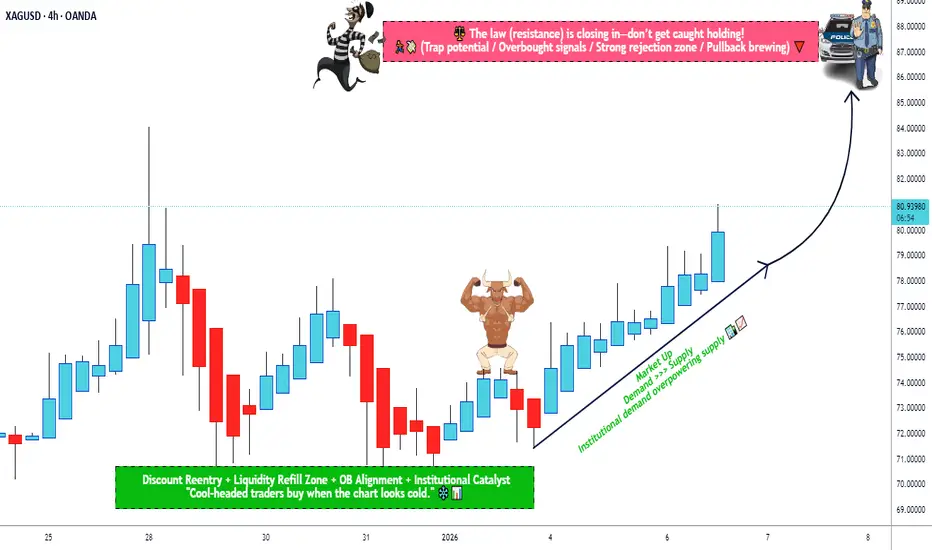
XAG/USD Bullish Structure Signals Upside Continuation!🔥 XAG/USD — SILVER vs U.S. DOLLAR
📊 Metals Market Opportunity Blueprint (Day / Swing Trade)
🧭 Market Bias
🟢 BULLISH PLAN CONFIRMED
Silver continues to show strength with bullish momentum supported by macro and metals-sector flows. Volatility expansion favors trend continuation traders.
🟢 Trade Execution Plan
📌 Entry:
✅ Buy at any price level
➡️ Suitable for scaling, cost-averaging, or momentum entries based on individual strategy.
🛑 Risk Management
🔻 Stop Loss: 73.000
⚠️ Dear Ladies & Gentlemen (Thief OG’s),
This SL is not mandatory. Adjust according to your own risk management & position sizing.
Trading involves risk — manage capital wisely.
🎯 Profit Objective
🎯 Target: 80.000
📍 Strong resistance zone detected
📍 Overbought conditions possible near highs
📍 Potential correction & liquidity trap expected
🚨 Kindly secure profits near resistance levels.
⚠️ TP level is guidance only — adapt exits based on market behavior and your strategy.
🔗 Related Markets to Watch (Correlation Focus)
💵 U.S. Dollar Index (DXY)
📉 Weakening USD = Bullish for Silver
📈 Strong USD = Headwind for XAG/USD
🟡 XAU/USD (Gold vs USD)
Silver often follows Gold’s directional bias
Gold strength usually confirms Silver upside momentum
📈 US10Y Treasury Yields
Falling yields → Supports precious metals
Rising yields → Pressure on non-yielding assets like Silver
🛢️ WTI Crude Oil (USOIL)
Inflation expectations linked to energy prices
Rising oil can indirectly support Silver as an inflation hedge
🌍 Fundamental & Economic Factors to Watch
🏦 Federal Reserve Policy
Rate cut expectations → Positive for Silver
Dovish tone weakens USD, boosting metals
📊 U.S. Inflation Data (CPI / PCE)
Higher inflation → Silver demand as a hedge
Cooling inflation may slow momentum temporarily
🏭 Industrial Demand Outlook
Silver has strong use in solar panels, EVs, electronics
Global manufacturing recovery supports long-term demand
🌐 Geopolitical & Risk Sentiment
Market uncertainty → Safe-haven inflows into metals
Risk-off environments favor Silver accumulation
🧠 Trader’s Note
📌 This is a market opportunity blueprint, not financial advice.
📌 Trade responsibly, manage risk, and adapt to live market conditions.

XAGUSD: Silver Awaits a New WaveXAGUSD: Silver Awaits a New Wave
XAGUSD Wave Overview (D1 and H4)
As a trader who has been practicing wave analysis for over ten years, I note that silver is currently forming an interesting structure, where the global picture and local movements are beginning to coalesce into a single scenario.
Chart D1: The global dynamics show the completion of an extended corrective formation. Silver is gradually breaking out of its sideways range, forming the basis for the next impulse. The wave structure indicates that the market is preparing for a phase change and may transition to a more directional movement.
Chart H4: The local pattern confirms the formation of key entry points. Here, the first signs of an impulse are visible, which could be the beginning of a larger wave. The internal structure appears to be the end of a correction and preparation for a move in the direction of the trend.
Main Scenario
After the completion of the corrective phase, a downward impulse sequence is expected to develop. This movement may be accompanied by increased seller activity and a gradual shift in priority to the downside.
Alternative Scenario
If the price holds above local peaks and forms a stable upward impulse structure, the priority will shift to continued growth. In this case, the correction will be considered incomplete, and silver could stage an additional rebound.
Trading Idea
Conservative approach: wait for confirmation of a breakout of key levels and enter with the trend.
Aggressive approach: use local impulses on H4 for earlier entries, but with tight stops.
In both cases, it is important to maintain strict risk management and adjust the plan as new impulses emerge.
Conclusion
Silver is at the transition point between a correction and a new impulse. The wave structure on D1 and H4 provides clear guidelines for action: watch for confirmation of the scenario and act with discipline.
SilverXAGUSD
- Bullish Channel as an corrective pattern in Long Time Frame
- HH - HL
- RSI - Divergence
- Break of Structure
- Change of Characteristics
