SilverXAGUSD
- Demand Zone
- Completed " 12345 " Impulsive Waves
- Break of Structure
- Descending Triangle as an corrective pattern in Short Time Frame
- Fair Value Gap
Xagusdshort

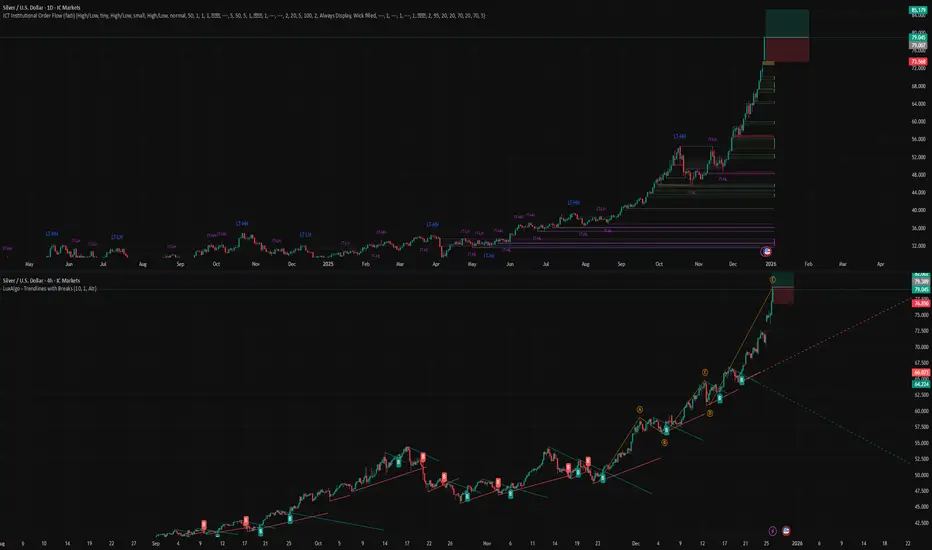
XAGUSD: Silver Awaits a New WaveXAGUSD: Silver Awaits a New Wave
XAGUSD Wave Overview (D1 and H4)
As a trader who has been practicing wave analysis for over ten years, I note that silver is currently forming an interesting structure, where the global picture and local movements are beginning to coalesce into a single scenario.
Chart D1: The global dynamics show the completion of an extended corrective formation. Silver is gradually breaking out of its sideways range, forming the basis for the next impulse. The wave structure indicates that the market is preparing for a phase change and may transition to a more directional movement.
Chart H4: The local pattern confirms the formation of key entry points. Here, the first signs of an impulse are visible, which could be the beginning of a larger wave. The internal structure appears to be the end of a correction and preparation for a move in the direction of the trend.
Main Scenario
After the completion of the corrective phase, a downward impulse sequence is expected to develop. This movement may be accompanied by increased seller activity and a gradual shift in priority to the downside.
Alternative Scenario
If the price holds above local peaks and forms a stable upward impulse structure, the priority will shift to continued growth. In this case, the correction will be considered incomplete, and silver could stage an additional rebound.
Trading Idea
Conservative approach: wait for confirmation of a breakout of key levels and enter with the trend.
Aggressive approach: use local impulses on H4 for earlier entries, but with tight stops.
In both cases, it is important to maintain strict risk management and adjust the plan as new impulses emerge.
Conclusion
Silver is at the transition point between a correction and a new impulse. The wave structure on D1 and H4 provides clear guidelines for action: watch for confirmation of the scenario and act with discipline.
SilverXAGUSD
- Bullish Channel as an corrective pattern in Long Time Frame
- HH - HL
- RSI - Divergence
- Break of Structure
- Change of Characteristics

SilverXAGUSD
- Completed " 12345 " Impulsive Waves
- Symmetrical Triangle as an corrective pattern in Long Time Frame
- Higher Highs
- RSI - Divergence
- Bullish Channel in Short Time Frame
Silver: pause in motionAfter its recent rally, XAGUSD has shifted into a calmer phase. The wave structure points to the formation of a corrective movement, where upward impulses are followed by pullbacks, creating a balance between buyers and sellers.
The chart shows that the price is holding within the mid-range, while attempts at growth face resistance. Downward fluctuations do not yet appear to be a full-fledged reversal, but rather reflect the market’s desire to adjust previous impulses.
The fundamental backdrop remains mixed: interest in safe-haven assets supports silver, while expectations of dovish U.S. policy and fluctuations in commodity demand create conditions for a temporary pause in growth.
As a result, XAGUSD is showing neutral movement with a corrective bias, where further development will depend on the market’s ability to stay within the current range and find new drivers.

Silver: corrective pause after growthSilver (XAGUSD) has entered a corrective phase after a confident rally. The chart shows that upward impulses have begun to lose strength, while the price is gradually shifting lower, forming a pullback structure.
The current dynamics suggest that the market is seeking balance after the previous rise. Corrective moves are becoming more pronounced, and consolidation near local resistance levels reflects buyer caution.
The fundamental backdrop also provides no clear support: interest in safe-haven assets remains, but dollar strength puts pressure on silver. As a result, the asset stays in a corrective zone, where the next direction will depend on the reaction to key levels.
Thus, XAGUSD is in a pullback phase, and the market’s next steps will determine whether the correction develops into a deeper decline or becomes preparation for a new impulse.

XAGUSD Short Setup — Rejection at Key Supply ZoneSilver (XAGUSD) has tapped into a higher-timeframe supply zone around the $58.50 – $58.80 area and showed clear signs of exhaustion. After sweeping the highs, price failed to continue upward and shifted into short-term bearish structure on the 15-minute chart.
📌 Entry: around $57.90 – $58.00
📌 Stop-loss: above the liquidity sweep / supply zone (~$58.70)
📌 Take-profit: toward $56.40 – $56.60 (previous demand + imbalance fill)
➕ Confluences
Liquidity grab above the previous high
Multiple rejection candles at supply
Loss of bullish momentum and break of structure (M15)
High risk-reward ratio on continuation to downside
⚠️ What invalidates the setup?
A decisive move above $58.70 with strong bullish volume would invalidate the short bias and open room for continuation toward $59.50+.

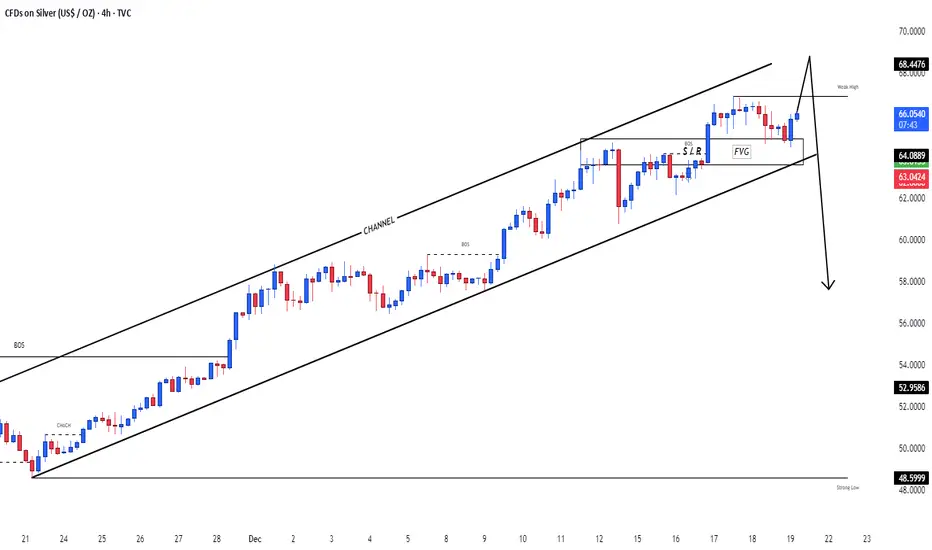
XAG/USD 2H: High-Probability Sell Entry at Drop-Base-Rally (BRD)📈 XAG/USD 2H: High-Probability Long Entry at Drop-Base-Rally (DBR) Demand Zone
📝 Market Context: Bullish Trend and Retracement
The overall trend for Silver (XAG/USD) is strongly bullish, driven by fundamental factors like tight physical supply and expectations of future US interest rate cuts. The chart shows price has been moving sharply higher, but has recently experienced a significant and necessary pullback from its high. This pullback is being treated as a correction to gather new demand before continuing the primary upward trend toward potential targets like $60 - $65 per ounce.
The current price action has approached a critical area that served as the launchpad for the prior bullish impulse.
🔑 Technical Focus: Unmitigated Demand and Entry Confirmation
The analysis highlights two key zones: a high-quality Demand Zone and the last area of consolidation before the final breakout.
1. Drop-Base-Rally (DBR) Demand Zone 🟢
Zone Location: The green shaded box, spanning approximately $54.00 to $54.50.
Significance : This area is identified as a fresh Demand Zone. It conforms to the Drop-Base-Rally (DBR) structure, where an initial drop was followed by a period of consolidation (the Base), before buyers aggressively took control, leading to the strong rally (the Rally). This zone is considered a Reversal Zone where institutional buy orders are expected to remain unmitigated.
Action Plan: This is the high-probability area to initiate a long (buy) position, anticipating a strong rebound.
2. Liquidity & Stop-Loss Target (Bottom Green Zone)
Zone Location: The lower green box, around $53.50 to $53.80.
Significance : This zone may represent the ultimate base of the prior move. The price of Silver is known for high volatility. Placing the Stop Loss (S/L) safely below this zone (e.g., below $53.50) is crucial to protect the trade from a potential "liquidity sweep" or deeper structural break, providing a healthy buffer.
📊 Trade Plan: Sell the Dip
Trade Direction: Short (SELL)
Entry Strategy: Wait for price to enter the DBR Demand Zone (around $54.00 - $54.50). Confirmation is highly recommended, such as monitoring for a clear bullish reversal pattern (like an engulfing candle or a double bottom) on a lower timeframe (e.g., 30M or 1H) before entry.
Stop Loss (S/L): Place S/L below the entire demand structure, for example, below $53.50.
Take Profit (T/P) 1: The first target is the level of the most recent high that initiated the current drop (a retest of the supply that caused the current pullback).
Take Profit (T/P) 2: A higher-level target is the prior swing high at $56.00, or pushing towards the psychological $60 per ounce level, which is a common projection based on current market dynamics.
⚠️ Risk and Fundamental Caveats
While the technical setup is strong, Silver is highly volatile. Traders must closely monitor upcoming US economic data, as stronger-than-expected US reports could delay expected Fed rate cuts and put temporary downward pressure on non-yielding assets like Silver.
Invalidation: A decisive close below the Stop Loss area (below $53.50) would invalidate this long trade idea, signaling a deeper correction or a structural shift.

XAGUSD H1 | Bearish Reaction off Key SupportMomentum: Bearish
Price is currently below the ichimoku cloud.
Sell entry: 50.14
- Pullback resistance
- 38.2% Fib retracement
- Fair Value Gap
Stop Loss: 50.882
- Swing high resistance
Take Profit: 48.795
- Overlap support
High Risk Investment Warning
Stratos Markets Limited (tradu.com/uk ), Stratos Europe Ltd (tradu.com/eu ):
CFDs are complex instruments and come with a high risk of losing money rapidly due to leverage. 70% of retail investor accounts lose money when trading CFDs with this provider. You should consider whether you understand how CFDs work and whether you can afford to take the high risk of losing your money.
Stratos Global LLC (tradu.com/en ): Losses can exceed deposits.
Please be advised that the information presented on TradingView is provided to Tradu (‘Company’, ‘we’) by a third-party provider (‘TFA Global Pte Ltd’). Please be reminded that you are solely responsible for the trading decisions on your account. Any information and/or content is intended entirely for research, educational and informational purposes only and does not constitute investment or consultation advice or investment strategy. The information is not tailored to the investment needs of any specific person and therefore does not involve a consideration of any of the investment objectives, financial situation or needs of any viewer that may receive it. Past performance is not a reliable indicator of future results. Actual results may differ materially from those anticipated in forward-looking or past performance statements. We assume no liability as to the accuracy or completeness of any of the information and/or content provided herein and the Company cannot be held responsible for any omission, mistake nor for any loss or damage including without limitation to any loss of profit which may arise from reliance on any information supplied by TFA Global Pte Ltd.

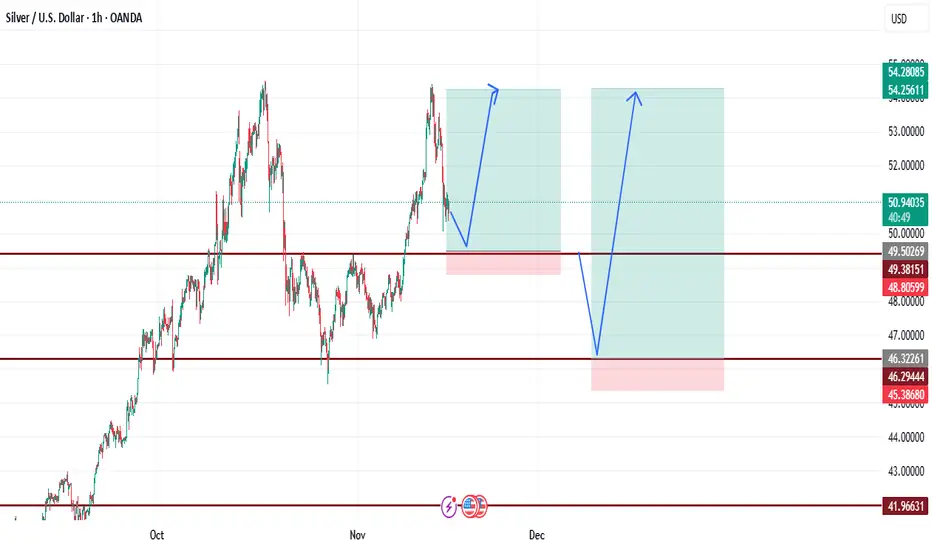
XAGUSD idea 11.11.2025I'm primarily looking at two scenarios here: a short could potentially be at sfp above high at a price of around 53.1 and a short that I would like is sfp below low at a price of around 46.7

SilverXAGUSD
- Break of Structure
- Ascending Trendline
- Bearish Channel as an corrective pattern in Short Time Frame
- Demand Zone
- Order Block
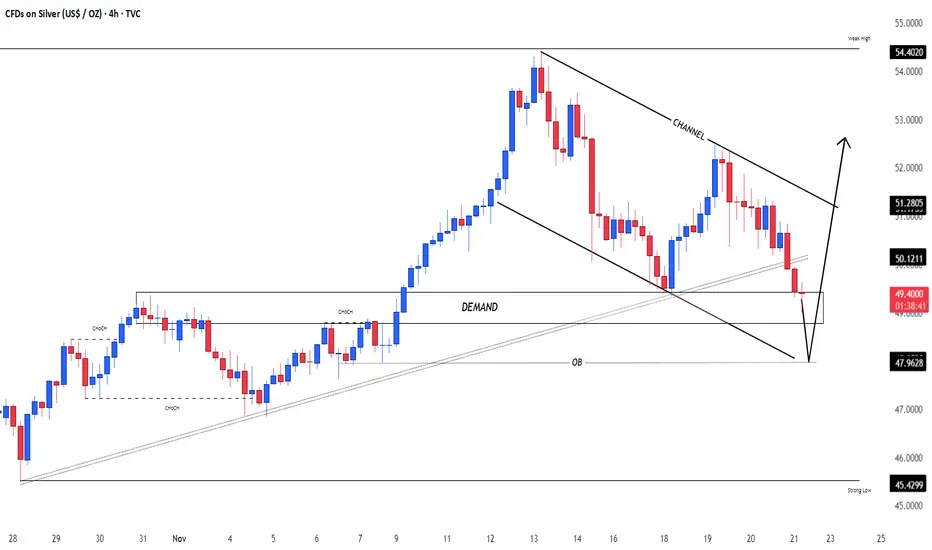
XAGUSD NEXT MOVE 1️⃣ Bullish Bounce Scenario (Most Likely)
If price holds at $49.50 (38.2% support):
✔ Buy Zone
🎯 Target 1: $51.30
🎯 Target 2: $53.75 (previous high)
🎯 Target 3: $55+ (Fibonacci extension)
This scenario aligns with trend continuation.
2️⃣ Bearish Correction Scenario
If price breaks below $49.50:
Price may drop to $47.90 (50% retracement)
Strongest reversal from $46.30 (61.8% Golden Ratio)
This level often creates a powerful upside movement.
🟢 Preferred Trading Zones
Buy Zone 1: $49.50
Stop Loss: $48.80
Targets: $51.30 → $52.80 → $53.70
Buy Zone 2 (Golden Ratio): $46.30
Stop Loss: $45.40
Targets: $49 → $51 → $53
SilverXAGUSD
- Completed " 123 " Impulsive Waves
- Fibonacci Level - 50.00% / 61.80%
- Break of Structure
- Double Top in Long Time Frame
- RSI - Divergence

From Gold to Silver — The Next Big Move on XAGUSD Following our previous series of Gold analyses, where that massive drop unfolded exactly as projected,
this time we’re turning our focus to Silver (XAGUSD) ⚡️
After completing a clear five-wave decline, Silver has been forming a corrective rally as wave (ii) —and it now seems to be in the final subwaves of this correction.
The market looks ready to kick off wave (iii) to the downside, which is often the most powerful and impulsive leg in the entire sequence! 🔥
📍The current zone is where we expect the correction to end and the main bearish trend to take control once again.
As always, patience and precision matter most here — the next move could define the market’s direction for the coming weeks.
--------------------------------------------------------------------------------------------
🚀 Who am I?
I'm Mahdi, a prop firm trader with 7+ years of experience in technical analysis, mainly focusing on Smart Money Concepts and Elliott Wave theory.
I specialize in delivering high-quality trading signals, market insights, and educational content tailored for serious traders and investors.
📊 My Tools: SMC, Elliott Wave, Fibonacci, Liquidity Grabs, Order Blocks
💼 Prop Challenge Passed: Yes | Funded Account: In Progress
🔗 Follow for consistent updates and trading insights.

#XAGUSD(SILVER):Is Bull Run Over? Major Correction On the Way? Dear Traders,
Silver has experienced a significant decline since the DXY began to recover. The price is likely to continue falling and we believe this may be the commencement of a major decline. We anticipate a smooth drop based on previous price reactions.
**Potential Entry Zone:**
- Enter when the price reaches the FVG area marked with a white box. The initial take profit can be set at $45 and the swing trade at $40.
**Support:**
- We would appreciate your support by liking and commenting on our ideas which will encourage us to post more in the future.
Team Setupsfx

SilverXAGUSD
- Completed " 12345 " Impulsive Waves and " AB " Corrective Wave
- Break of Structure
- Fibonacci Level - 61.80% / 78.60%
- Ascending Triangle as an corrective pattern in Short Time Frame
- Order Block

Silver - The catastrophic rejection!🆘Silver ( TVC:SILVER ) is just collapsing:
🔎Analysis summary:
At this exact moment, Silver is retesting the previous all time highs, which were already rejected about 45 years ago. Considering the extremely bearish rejection on the smaller timeframes, Silver simply fails to break out. This will lead to a devastating reversal.
📝Levels to watch:
$50
SwingTraderPhil
SwingTrading.Simplified. | Investing.Simplified. | #LONGTERMVISION

Market Insight: Silver’s Next Move Hinges on MA Breakout!🎯 XAG/USD: The Great Silver Heist - Bearish Breakout Setup! 💰
📊 ASSET OVERVIEW
Pair: XAG/USD (Silver vs U.S. Dollar)
Market: Precious Metals
Strategy Type: Swing/Day Trade
Bias: 🐻 BEARISH
🎭 THE HEIST PLAN (Trading Setup)
🔴 Entry Zone: The Breakout
Level: $49.50 (MA Breakout Zone)
Signal: Waiting for price to break below moving average support
Confirmation: Clean break with volume + momentum shift
🛑 Stop Loss: The Safety Vault
Level: $52.00
Purpose: Protection for potential pullback scenarios
Note: This SL accommodates a possible bounce before continuation down
⚠️ Risk Disclaimer: Fellow traders, this stop loss is MY risk tolerance. YOU decide your own risk parameters. Trade what YOU can afford to lose. Your money, your rules! 🎰
🎯 Target: The Escape Route
Primary Target: $47.00
Why This Level?
🚧 Strong resistance zone acting as support (role reversal)
📈 Overbought conditions on lower timeframes
Potential bull trap zone - perfect profit extraction point
⚠️ Profit Disclaimer: This is MY target based on MY analysis. YOU make your own profit decisions. Lock gains when YOUR strategy says so. Always secure the bag at YOUR comfort level! 💼
🔍 TECHNICAL ANALYSIS BREAKDOWN
Key Factors:
Moving Average Breakdown - Price rejecting MA as new resistance
Market Structure - Lower highs forming on H4/D1 timeframes
Resistance Cluster - Multiple confluences at $52 area
Volume Profile - Decreasing buy pressure
What I'm Watching:
📉 Sustained close below $49.50
📊 Volume confirmation on breakdown
🕒 Time alignment with USD strength cycles
💱 RELATED PAIRS TO MONITOR (Correlation Watch)
Metals Family:
XAU/USD (Gold) - Moves in tandem with silver ~70% correlation
GC1! (Gold Futures) - Leading indicator for precious metals sentiment
HG1! (Copper Futures) - Industrial metals correlation
USD Strength Plays:
TVC:DXY (Dollar Index) - Inverse correlation with metals
FX:EURUSD - Risk-on/risk-off sentiment gauge
FX:USDJPY - Safe haven flow indicator
Key Point: When DXY 📈 = Precious metals 📉 typically. Watch Fed policy signals and real yields for directional bias!
🎪 THE "THIEF STYLE" STRATEGY PHILOSOPHY
This setup follows the "steal profits when the market sleeps" approach:
🎯 Identify overextended moves
⏰ Wait for breakout confirmation
💨 Execute with precision
🏃 Escape before the reversal
It's all about timing, patience, and taking what the market gives!
Conduct your own research (DYOR)
Use proper risk management
Never risk more than you can afford to lose
Consider consulting a licensed financial advisor
💼 No Guarantees: No trading outcome is guaranteed. Markets are unpredictable. Trade responsibly!
📢 ENGAGEMENT FOOTER
✨ "If you find value in my analysis, a 👍 and 🚀 boost is much appreciated — it helps me share more setups with the community!"
🏷️ HASHTAGS
#XAGUSD #Silver #PreciousMetals #BearishSetup #SwingTrading #DayTrading #ForexTrading #MetalsTrading #TechnicalAnalysis #BreakoutStrategy #SilverTrading #USD #DXY #ForexSignals #TradingIdeas #ChartAnalysis #PriceAction #RiskManagement #ForexCommunity #TradingView #MarketAnalysis
🎬 End of Analysis | Trade Safe, Trade Smart! 🎬

POSSIBLE XAGUSD SHORT SETUPANALYSIS
Last week:
>FRD(first red day) on Fri last week closing below Thurs low facilitating a CISD
This week:
>Mon price closed as an inside day
>Tues price closed in breakout(CIB) making the second day of bearish orderflow.
>Wed price closed in breakout as well however the price action was more of a range hence perceived as reaccumulation(acc)
>Thur: anticipating a purge and revert off Wed high and continuation of the bearish trend

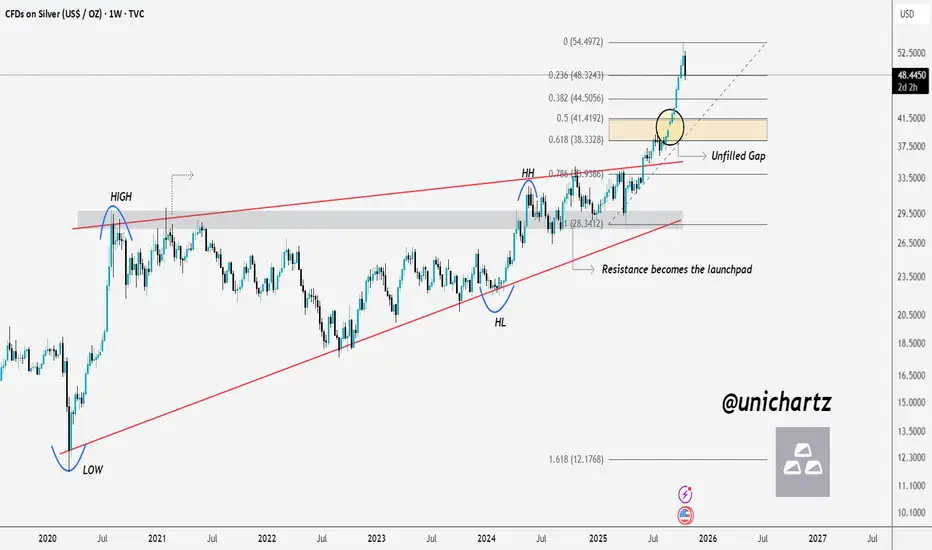
Correction Incoming – Silver Eyes Fib ZoneSILVER Weekly Analysis 🪙
At first, Silver faced strong rejection from the resistance zone, but once it finally broke out, the price came back to retest that same resistance — which then turned into a powerful launchpad, sending prices to new all-time highs.
Currently, the price is showing early signs of a correction. I’m expecting a possible retest of the Golden Fib Zone (0.5–0.618), where there’s also an unfilled gap near the 0.5 level. A move toward that area would make sense before the next major leg higher.
Resistance becomes the launchpad.
DYOR, NFA
Thanks for reading! Appreciate your support and engagement 🙏
XAGUSD GOOD SELL OPTIONWe have seen metals roaring upwards. However after recent Diplomatic and Geopolitical situations we can see slight pull back

Silver XAGUSD Overextended With Range-Bound Price Action🥈 XAGUSD (Silver) is overextended in my view 📈. Price has recently pushed into new highs 🔼 and is now moving sideways in a range 📊—often a sign that larger entities 💼 may be working their orders.
⚖️ This could be a form of distribution, as silver has moved into a zone of thin liquidity 🌊. To facilitate bigger positions, institutions may need to generate liquidity by keeping price sideways ⏸️ before the next move.
📉 My current bias is for a retracement back into equilibrium ⚖️ and towards an unresolved bullish imbalance 🔍 that remains below.
⚠️ This is for educational purposes only, not financial advice 📚

SILVER RELATIVE TO GOLD/SILVER RATIO - 3 possible deep correction.
target price : 20.50$/oz.
trade invalidation level : daily close above 33.00$/oz.
good luck.
