XAUUSD Long Opportunity Price is currently testing the Asian High as a support, looking to trade from $3648 to the $3656 level and potentially beyond depending how price reacts to the USD PPI release.
Confluences include 21/50 SMA region test and within the 45-55 region of the RSI with a Level of significance as a support level at $3548
Xauusd(w)

Gold Analysis – Correction Not Yet Over (IMO)Yesterday, after printing a new ATH at 3674, Gold sold off aggressively and overnight reached a low of 3620.
Now the key question: Is Gold done correcting?
👉 My answer: Not yet.
Here’s why:
1. The 550 pip drop from the top is barely scratching the surface compared to the 3500 pip rally in the last two weeks.
2. Yesterday’s daily candle is a bearish pin bar. While this pattern is weaker in strong uptrends, it can still trigger continuation.
3. Structurally, the market looks like it’s forming an ABC correction. The current rebound may be wave B, with wave C expected to target the 3570 zone.
4. Confluence supports act like magnets once corrections begin. The zone I’m watching aligns with the 23% Fibonacci retracement, which fits perfectly with the correction scenario.
📌 Trading Plan:
As long as 3675 holds, I remain bearish in the short term. The best strategy is to sell rallies against the ATH, targeting deeper retracement levels.
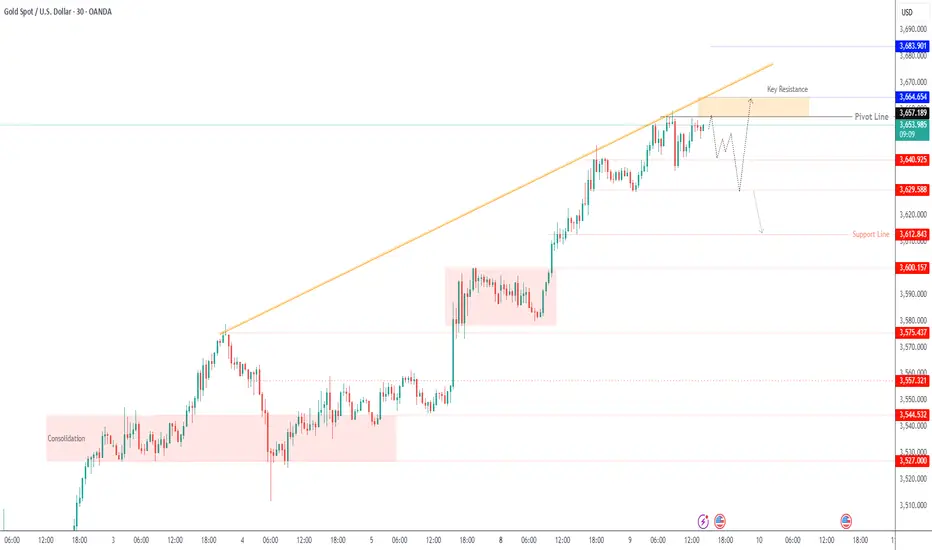
Gold : Neutral Between 3,640–3,657, Breakout to DecideGold – Overview
Gold hit a fresh record high at $3,659 on Tuesday, supported by weak U.S. jobs data and growing bets on Fed rate cuts. Traders now await key U.S. inflation releases – PPI on Wednesday and CPI on Thursday – which could drive the next major move.
📊 If inflation comes in hotter than expected, gold risks a sharp correction.
📊 If inflation is weaker, expectations for a 50 bps Fed rate cut could lift gold further.
Technical Outlook:
🔻 While below 3,657, price may correct toward 3,640. A 15M close below 3,640 would extend the decline to 3,629.
🔺 Stability above 3,657 on a 15M close would support further upside toward 3,665 → 3,683.
Key Levels:
Pivot: 3,657
Support: 3,640 – 3,629 – 3,612
Resistance: 3,665 – 3,683
previous idea:
XAUUSD Intraday Analysis – September 10, 2025 (H1 Chart)Gold has been in a strong bullish channel since late August, but the current rally is facing a heavy resistance zone at 3,665 – 3,675 USD/oz, where signs of a corrective move are emerging.
1. Technical Outlook
Trendline & Channel: Price has been respecting the ascending channel but is now testing resistance and showing weakness.
Fibonacci Retracement (from 3,395 → 3,675):
0.382 ~ 3,565
0.5 ~ 3,535
0.618 ~ 3,505
RSI (H1): Overbought (>70) and turning down, suggesting short-term correction.
Elliott Wave: A corrective ABC structure is in play. Wave A has started, with Wave C possibly targeting 3,545 – 3,505.
2. Key Levels
Resistance: 3,665 – 3,675
Short-term Support: 3,625 – 3,585
Major Support: 3,545 – 3,505 (confluence with Fibonacci 0.5 – 0.618)
3. Trading Strategies
Short-term Sell Setup:
Entry: 3,655 – 3,665 (resistance zone)
TP1: 3,585
TP2: 3,545 – 3,505
SL: 3,685
Medium-term Buy Setup (Buy Limit Strategy):
Entry: 3,545 – 3,505 (support & Fibo cluster)
TP: 3,625 – 3,665
SL: below 3,485
4. Conclusion
Gold is likely entering a corrective phase after testing the strong resistance zone. Traders may consider shorting near resistance and buying back at deeper support levels.
- Keep these resistance–support levels on your chart for today’s trading plan, and follow along for more updated strategies.

Gold 1H – Buy the Dip, Watch 3,687 Premium SupplyGold on the 1H timeframe is trading above 3,650 after a clean break of structure. Price has left demand footprints around 3,636 and deeper at 3,594, while resistance stands near 3,670 and premium supply sits at 3,687–3,689. This suggests a possible engineered retracement into discount zones before a push toward liquidity at 3,688+.
________________________________________
📌 Key Structure & Liquidity Zones (1H):
• 🔼 Buy Zone 3,636 – 3,634 (SL 3,630): Fresh demand block, aligned with bullish order flow.
• 🔼 Buy Zone 3,594 – 3,592 (SL 3,587): Deeper discount demand, strong structural base.
• 🔽 Sell Zone 3,687 – 3,689 (SL 3,694): Premium supply zone, potential liquidity sweep.
________________________________________
📊 Trading Ideas (Scenario-Based):
🔺 Buy Setup – Demand Block Reaction
• Entry: 3,636 – 3,634
• Stop Loss: 3,630
• Take Profits:
• TP1: 3,650
• TP2: 3,665
• TP3: 3,680+
👉 Expect retracement into discount demand before resuming bullish move.
🔺 Buy Setup – Deeper Demand Test
• Entry: 3,594 – 3,592
• Stop Loss: 3,587
• Take Profits:
• TP1: 3,610
• TP2: 3,625
• TP3: 3,640+
👉 Ideal for swing buyers looking for higher R:R at deeper liquidity sweep.
🔻 Sell Setup – Premium Rejection
• Entry: 3,687 – 3,689
• Stop Loss: 3,694
• Take Profits:
• TP1: 3,670
• TP2: 3,655
• TP3: 3,640
👉 Short-term liquidity grab at premium levels before rotating lower.
________________________________________
🔑 Strategy Note
Bias remains bullish, but smart money may engineer a sweep into 3,636 or even 3,594 demand before expansion. Cleaner setups are buying dips; sells at 3,687 are only scalp plays with tight risk.

Market Analysis: Gold Rockets to New HighMarket Analysis: Gold Rockets to New High
Gold price rallied to a new all-time high above $3,670.
Important Takeaways for Gold Price Analysis Today
- Gold price started a major increase from $3,500 against the US Dollar.
- A key bullish trend line is forming with support at $3,635 on the hourly chart of gold.
Gold Price Technical Analysis
On the hourly chart of Gold, the price formed a base above $3,500. The price remained in a bullish zone and started a strong increase above $3,550.
There was a decent move above the 50-hour simple moving average and $3,620. The bulls pushed the price above the $3,640 and $3,650 resistance levels. Finally, the price climbed to a new all-time high at $3,674 before there was a pullback.
The price dipped below the 23.6% Fib retracement level of the upward move from the $3,511 swing low to the $3,674 high, and the RSI declined below 50. Initial support on the downside is near $3,635 and the 50-hour simple moving average.
There is also a key bullish trend line forming with support at $3,635. The first major support is near the 50% Fib retracement at $3,592. If there is a downside break below $3,592, the price might decline further. In the stated case, the price might drop toward $3,575. Any more losses might push the price toward $3,510.
Immediate resistance is near $3,655. The next major hurdle for the bulls is $3,675. An upside break above $3,675 could send Gold price toward $3,688. Any more gains may perhaps set the pace for an increase toward $3,700.
This article represents the opinion of the Companies operating under the FXOpen brand only. It is not to be construed as an offer, solicitation, or recommendation with respect to products and services provided by the Companies operating under the FXOpen brand, nor is it to be considered financial advice.

Gold (XAUUSD) – 10 Sep | Watching M15 Supply for Short Setups🟡 Gold (XAUUSD) Analysis – 10 September
Market Overview
Gold had been in relentless bullish momentum with both H4 and M15 aligned to the upside. Yesterday, price made a fresh all-time high at 3674.650 , but sharp selling pressure emerged from that level.
This rejection caused a significant Change of Character (ChoCh) below the previous higher low at 3628.5 . Following this, the market also printed a Break of Structure (BoS) earlier today, confirming that the H4 pullback phase has now begun.
Current Market Scenario
H4: Shifted into a pullback phase after M15 ChoCh + BoS.
M15: In a downtrend, currently retracing after the structural break.
This alignment signals that our focus today will be on sell setups only .
Key POI for Today
🔹 3637–3640.8 → M15 supply zone at the LH level.
If price retraces into this zone and provides LTF confirmation , we will plan a short setup.
If this zone is not respected, we will step aside and reassess deeper supply areas.
Execution Plan
Wait for price to retest the 3637–3640.8 M15 supply zone .
Drop to M1 for confirmation (micro ChoCh / micro BoS).
If confirmation is present, execute a short setup with fixed risk.
If the zone fails, do not force trades — wait for price to reach deeper supply before re-engaging.
Execution is about patience — let the market come to your levels, not the other way around.
Bias for Today
📉 Bearish only. Short setups will be taken from supply zones once confirmation is present. Until then — no trades.
📘 Shared by @ChartIsMirror

DeGRAM | GOLD rebounded from the support area📊 Technical Analysis
● XAU/USD staged a bullish takeover at 3,636 support, reclaiming the mid-range and establishing a higher low.
● Price is now pressing 3,650, with projections showing a push toward 3,654 before testing the 3,668–3,672 resistance area.
💡 Fundamental Analysis
● Gold demand is underpinned by cautious sentiment ahead of US CPI, while weaker dollar flows and ongoing geopolitical tensions enhance safe-haven appeal.
✨ Summary
Bullish above 3,646; targets 3,654 → 3,668. Invalidation on a close below 3,636.
-------------------
Share your opinion in the comments and support the idea with a like. Thanks for your support!

XAUUSD Explodes: Strong Uptrend and Breakout OpportunityCurrently, XAUUSD is moving within a clear rising channel on the 2-hour chart. The bullish momentum of gold remains very strong, and we can see that the price is continuously breaking higher highs, pushing the trend upwards. However, it is important to note that the market is awaiting important news such as CPI and PPI from the US tonight and tomorrow.
These news releases could impact the USD, which in turn affects the price of gold. A CPI higher than expected could put pressure on gold, as the Fed may maintain a high interest rate policy, while weak PPI could help gold continue its upward trend.
However, technical analysis shows that the current bullish trend of gold is still showing no signs of weakening. There is strong support at the 3,620 level , confirmed by EMA 34 and EMA 89, indicating that the bullish trend remains stable. The nearest resistance zone is between 3,675 and 3,700 , where the price has faced difficulties breaking through before.
If the price breaks through this resistance level , we can expect a strong breakout towards higher levels.

EURUSD: London Session Bullish BiasOn the higher timeframe, I maintain a bullish outlook, with the BSL identified as the draw on liquidity. This serves as the main directional bias.
Shifting to the 1H timeframe, price action shows that Monday’s low was purged, which often signals liquidity grab. Following this purge, the market reacted bullishly, suggesting potential accumulation of buy-side pressure.
In addition, the formation of a +FVG (Fair Value Gap) adds another layer of confluence supporting the bullish scenario. This imbalance aligns with the expectation of further upward continuation.
With these factors combined, I consider the 50% retracement of the previous leg as the initial target for this move.
💌It is my honor to share your comments with me💌
🔎 DYOR
💡Wait for the update!

What kind of rebellion is there in human nature?Honestly, I'm afraid to say what numbers gold will face in the upward path that began in 2001!
I consider the price range drawn on the gold chart as a future price target, but we won't have much time to reach this price target! And the speed of events is moving in a direction that has ultimately led to an increase in rates!
Thanks
MJ.REZAEI

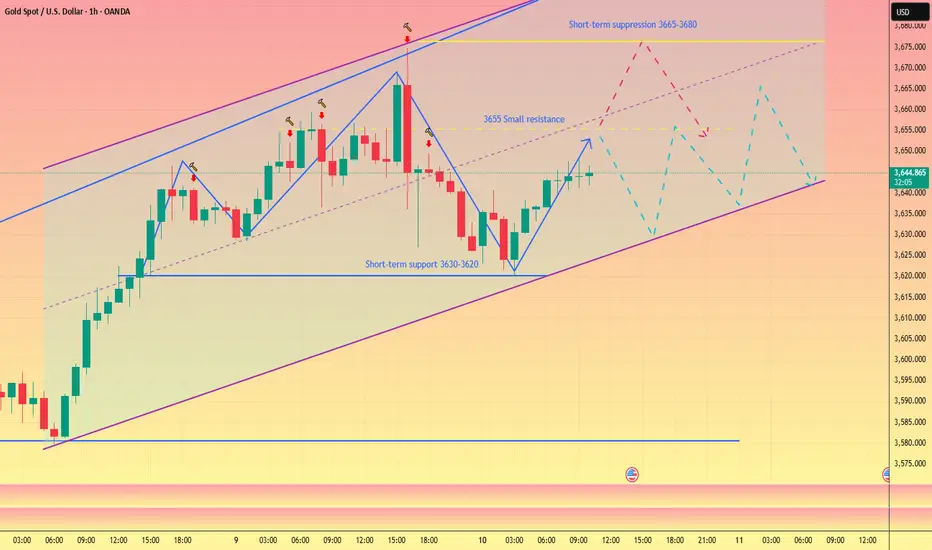
Pay attention to 3655,there will be callback if it doesn't break#XAUUSD OANDA:XAUUSD
Gold tested the support level of 3630-3620 and stabilized before rebounding again, which is consistent with my previous judgment that gold must experience a correction if it wants to rise again.📉
In the short term, the market focus is still on the basis points of the Federal Reserve's interest rate cut to be announced next week. 💻Therefore, before clear data is released, the market is unlikely to experience significant fluctuations.📊
Although gold is currently fluctuating sideways around 3645,⚖️ in the short term, we should pay attention to the hourly moving average, which tends to stick together and move upward. 🌈Therefore, if gold falls back again in the short term to test the support level of 3630-3620 below, we can still consider going long. 🚀
On the upside, the first thing to watch is whether gold can effectively break through 3655. If it can effectively break through, it is expected to continue to test the short-term resistance range of 3665-3680. 📈Conversely, a failure to break above 3655 could lead to consolidation within a range.🐻
GOLD: Bearish Continuation & Short Trade
GOLD
- Classic bearish setup
- Our team expects bearish continuation
SUGGESTED TRADE:
Swing Trade
Short GOLD
Entry Point - 3644.0
Stop Loss - 3652.1
Take Profit - 3630.1
Our Risk - 1%
Start protection of your profits from lower levels
Disclosure: I am part of Trade Nation's Influencer program and receive a monthly fee for using their TradingView charts in my analysis.
❤️ Please, support our work with like & comment! ❤️

XAU/USD Intraday Plan | Support & Resistance to WatchGold tested the $3,674 resistance yesterday before pulling back to the $3,620 area, where the 50MA provided dynamic support. Price is now trending around $3,646, attempting to recover from the pullback.
For bulls to regain control, we need a clean break above $3,658, which would open the path toward $3,674, followed by $3,690, and an extension to $3,706.
However, a rejection at $3,658 resistance could trigger a deeper pullback into lower support levels.
📌Key Levels to Watch:
Resistance:
$3,658
$3,674
$3,690
$3,706
Support:
$3,644
$3,630
$3,617
$3,594
$3,564
📌 Fundamental Focus – Sept 10
The fireworks start today with U.S. inflation data. Core PPI and PPI figures will be released this afternoon, kicking off a packed midweek that continues with CPI tomorrow and ends with Consumer Sentiment & Inflation Expectations on Friday.
⚠️ Expect volatility to pick up from today onward, with sharp moves likely around each release.

ANFIBO | I think XAUUSD on 09.10.2025 ???Trend is friend. Gold price today is still holding on the uptrend line and has not broken out yet. Today we only need to pay attention to the following important resistance and support zones:
>> SELL SCALP: 3700 - 3710, SL 3720, TP 3600 - 3570
>> BUY SCALP: 3620 - 3625, SL 3615, TP 3645 - 3700
>>> SWING BUY: 3560 - 3570, SL 3550, TP 3620 - 3675 - 3700 - OPEN
>>> SWING SELL: 3790 - 3801, SL 2820, TP 3700 - 3570 - 3450 - OPEN
Good luck guys!!!

Gold Potential Reversal Ahead - Gold Sell OpportunityGold is currently trading around 3647 after making a strong bullish move. Price has reached near a weak high zone and is showing signs of exhaustion, which indicates a possible retracement. The immediate resistance at 3659 has created a weak high. If Gold fails to sustain above this level, sellers are likely to step in, pushing price down toward the levels at 3620 – 3604. A confirmed rejection candle around the sell zone will act as the sell trigger, with 3578 as a deeper bearish target if momentum increases.
🔑 Key Levels to Watch:
- Resistance: 3687 – 3712
- Support: 3,628 - 3600
📌 Sell Zone & Sell Trigger:
- Sell Zone: 3670 – 3685 area
- Sell Trigger: A rejection candle or confirmation of failure to break above 3670 – 3685 zone.
Note
Please risk management in trading is a Key so use your money accordingly. If you like the idea then please like and boost. Thank you and Good Luck!

EURCHF buy setup loooooooooooooooooongHELLO SORRY, for interruption
We have minor downtrend which is broken and caused forming strong demand
this demand zone ,the price respected it and formed sweep then choch and engulfing candle
which indicate uptrend wave

GOLD M15 MAPPING / ZGMGold M15 Mapping Update Gold
If Gold Break The Resistance Then We Buy At 3650📈
If Gold Break The Support Then We Sell At 3603 📉
The Gold Have A Trendline With A Breakout We Will Sell At Reversal 3675 / 3687
Follow Us For More !

Gold Trading Strategy Essentials for Tuesday, September 9th:
I. Core Drivers and Risks (Fundamentals)
Bullient Factors Dominate:
Expectations of a Stronger Rate Cut: The US August non-farm payroll data fell far short of expectations, leaving the market with near-100% expectations for a 25 basis point rate cut by the Federal Reserve in September. A weaker US dollar and falling US Treasury yields continue to favor gold.
Strong Safe-Haven Demand: The escalating Russia-Ukraine conflict and heightened global geopolitical risks are boosting gold's safe-haven appeal.
Solid Structural Support: Continued gold purchases by global central banks (such as the People's Bank of China) provide long-term support for gold prices.
Potential Risk Points:
Data Risk: US CPI and PPI data will be released. If inflation data exceeds expectations and is strong, it could weaken expectations of a rate cut and weigh on gold prices.
Technical pullback: The price of gold has risen sharply this year, and the short-term technical indicator (RSI) has diverged, and there is pressure for a technical pullback.
Federal Reserve Signals: Be wary of volatility triggered by any hawkish signals in the outcome of the interest rate meeting or the policy statement.
II. Key Technical Levels (Spot Gold)
Current Price: 3645
Resistance: 3658 (Recent High) → 3700 (Psychological Barrier)
Support: 3620 (Initial Support) → 3600 (Key Psychological Level) → 3550.46 (Strong Support)
III. Trading Strategy and Risk Management
Overall Approach: The medium- to long-term bullish trend remains unchanged, but the market is currently at a critical resistance level. Avoid chasing highs. The primary strategy is to buy on dips after pullbacks, supplemented by using a very light position to capture short-term pullbacks.
Buy on Pullbacks
Entry Area: Expect a small long position when the 3600-3620 range stabilizes (for more cautious traders, wait for the 3550-3570 area).
Stop loss: Place it at $8-10 below the entry level (e.g., for a long order at $3,600, the stop loss is set at $3,590-3,592).
Target: First look at 3650 - 3658, after breaking through, you can hold and look up to 3680 - 3700.
Aggressive Short-Term Selling (Experienced Traders Only)
Entry Signal: A rapid price rise to 3658 or above, accompanied by clear resistance signals (such as a long upper shadow on the 15-minute/1-hour candlestick chart or a top divergence on the RSI).
Position: A small position.
Stop-loss: Must be set strictly $5 above the entry level (e.g., for a short position at 3660, stop-loss at 3665).
Target: Enter and exit quickly to capture 20$-30$pullback profits (such as around 3630).
Position Management: Risk exposure on a single trade must be strictly controlled within 1-2% of total capital.
Forced Stop-loss: A stop-loss must be set on all trades to prevent unexpected large losses.
10/9/68 : XAUUSD ( Europe / London Session )Using it from Europe Session until 7.00PM , I'll new analysis and update at 8.00PM
Resistance
3664-3669
3654-3659
3649
Support
3638
3628-3633
3617-3622

XAUUSD sell expectation Gold (XAUUSD) has shown signs of exhaustion after its recent bullish run, with price reacting strongly to multiple fair value gaps (FVG) and resistance zones. The 15-minute chart highlights unmitigated bearish FVGs aligning with higher timeframe supply areas, signaling a potential shift in order flow.
My bearish expectation is that gold will likely respect these supply zones and continue to trade lower toward key support around 3616 – 3580, where liquidity rests. The sell entry is based on the rejection from the 15m FVG, confirming bearish order flow and favoring downside continuation.
Risk management is essential here: stop-loss above the recent supply/FVG zone, while targeting the liquidity pools and imbalance fills below.

ANFIBO | I think XAUUSD on 09.09.2025 ???Currently, gold is moving within a clearly defined upward trend channel. Our strategy for today should focus on monitoring key resistance and support zones in order to identify potential entry points for both scalp trades and swing trades. The levels I consider noteworthy are as follows:
>> SELL SCALP: 3650 - 3660, SL 3670, TP 3600
>> BUY SCALP: 3598 - 3603, SL 3595, TP 3680 - 3690
>>> SWING BUY: 3560 - 3570, SL 3550, TP 3680 - 3690 - OPEN
>>> SWING SELL: 3790 - 3801, SL 2820, TP 3680 - 3570 - 3450 - OPEN
Have fun!!!

Gold - Buy or Sell this week??? (08-12/09)With the sustained accumulation over the past five months, gold has experienced a strong breakout from the $3,300 sideways range and reached a new all-time high around $3,600. The upward trend is clearly established. Therefore, we can consider buying and selling at the following price levels:
>>> SELL ZONE: 3684 - 3679
SL: 3689
TP: 3618 - 3596 - 3578 - 3565 - 3515
>>> BUY ZONE: 3560 - 3570
SL: 3550
TP: 3618 - 3678
Have a good day. Good luck buddies! :)
