XAU/USD – Rise to 3,400 Followed by a PullbackHello everyone, on the H1 chart, gold has resumed its upward movement after bouncing from the 3,375–3,380 USD support zone. However, the 3,400 USD area is acting as a strong resistance level and is unlikely to be broken immediately. It is highly probable that the price will test 3,400 before facing selling pressure, leading to a correction back towards the 3,375 USD zone to retest demand strength.
Xauusd(w)

Gold's Wild Ride: Is the Bearish Pressure Coming?Hello everyone, what do you think about OANDA:XAUUSD ?
Yesterday, gold experienced a significant move, briefly hitting 3,399 USD before pulling back slightly. It is currently fluctuating around 3,390 USD.
At the moment, gold is attracting attention from investors as a safe-haven asset, especially amid rising concerns about the independence of the US Federal Reserve (Fed), following recent criticism of Chairman Jerome Powell by President Trump.
From a technical standpoint, gold is forming a rising wedge, signaling a potential bearish reversal. As the price of gold nears the top of this pattern, the risk of a price decline becomes more apparent. If gold drops below 3,385 USD, a sharp pullback is likely, with the next target potentially at 3,375 USD or lower.
What do you think, will XAUUSD continue to drop? Feel free to share your thoughts in the comments below!
Wishing you successful and profitable trading!

Gold's Explosive SurgeHello everyone, let’s dive into how OANDA:XAUUSD is moving!
Yesterday, just as we expected , gold made an impressive surge. The precious metal rocketed upwards from the 3321 USD range, hitting 3378 USD, gaining more than 500 pips in a short time.
So, what’s behind this move? The answer lies in the speech by Fed Chair Jerome Powell.
His remarks at the Jackson Hole symposium sent shockwaves through the market. Powell emphasized that the Fed might pause or even reduce interest rates soon due to concerns about the negative impact on the economy.
This has weakened the USD, providing an opportunity for gold (XAUUSD) to rise sharply. As the USD loses value, gold becomes a safe-haven for investors, pushing prices higher.
From a technical perspective, gold has overcome its previous downtrend, successfully conquering the 3370 USD peak. A trend correction could occur, but given the favorable environment, the upward trend still holds dominance. Watch for the 3400 USD level, as that’s our next target.
Do you agree with my analysis? Drop your thoughts in the comments and don’t forget to like the post—I’d really appreciate it!
Good luck!
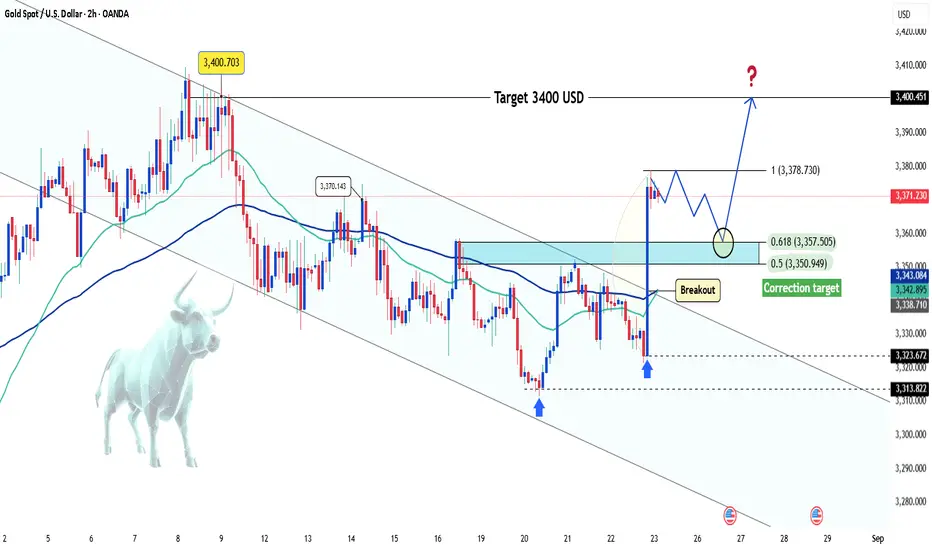
Hellena | GOLD (4H): LONG to resistance area of 3400 (Wave 3).I am updating my idea because I have a certain vision of the situation, like the diagonal “ABCDE”, in which the movement has already ended. It is quite remarkable that this scenario, like the previous one, envisages a continuation of the upward movement.
Therefore, I am considering a small correction to the 3300 area (wave “2”), followed by a continuation of the upward movement to the 3400 resistance area.
If the price reaches the target immediately, this does not contradict the idea. Therefore, I recommend considering only long positions or limit orders.
Manage your capital correctly and competently! Only enter trades based on reliable patterns!

Gold 27/08: Smart Money Targets 3405 or Sweeps 3355?Gold SMC Daily Plan – 27/08
Market Context (SMC View):
• Price consolidates around 3378, respecting the liquidity trendline with multiple BOS and ChoCH, showing smart money activity.
• Key resistance: 3393–3406 (supply & liquidity pool).
• Key support: 3352–3358 (demand zone) with OB near 3325.
• Expect a liquidity sweep either above 3405 or below 3355 before trend confirmation.
________________________________________
📊 Key Liquidity Zones & Entries
✅ Sell Zone: 3402–3406
o SL: 3410
o TP: 3390 → 3380 → 3360
✅ Buy Zone 1: 3352–3358
o SL: 3345
o TP: 3360 → 3375 → 3385 → 3395
✅ Buy Zone 2 (intraday pullback): 3376–3380
o SL: 3370
o TP: 3385 → 3395 → 3405
________________________________________
SMC Scenarios for 27/08
Scenario 1 – Liquidity Grab at Resistance:
• If price sweeps 3402–3406, watch for fake breakout signs.
o Short from zone with TP as above.
Scenario 2 – Buy on Dip (Demand Zone):
• If price retraces deeper to 3352–3358, wait for bullish reaction to buy.
• If price respects trend and holds 3376–3380, look for intraday longs.
________________________________________
SMC Notes:
• Focus on buying dips unless liquidity grab happens first at 3402–3406.
• Watch price action near trendline & OB at 3325 for high-probability reversals.

Elliott Wave Analysis XAUUSD – August 28, 2025
Momentum
• D1 timeframe: Momentum is still in a bearish reversal zone (overbought). Price is stalling but has not yet given a clear reversal confirmation → showing that bullish strength is weakening.
• H4 timeframe: Momentum is also turning bearish → from now until the US session, price is likely to continue sideways or decline further.
• H1 timeframe: Momentum is turning bullish → suggesting a short-term corrective rally or sideways movement.
Wave Structure
• D1 timeframe: At the moment, there are two possible wave counts (as mentioned in yesterday’s plan). Both scenarios point to the same outcome: after completing the correction, price will move higher.
o Key note: The final corrective structure is a triangle. Once this triangle completes, it typically signals a strong upward breakout, confirming the end of the corrective phase.
• H4 timeframe: Price is consolidating within a contracting triangle, leaving two possibilities:
1. Leading diagonal for wave 4 (abcde) → once completed, price could drop sharply towards the 0.618 Fibonacci retracement.
2. Ending triangle for wave d → a strong wave e decline is expected before the next rally begins. In this case, the signal to watch is price testing the lower boundary of the triangle.
• H1 timeframe: A leading diagonal is forming, while RSI shows bearish divergence at the top. This supports the sell scenario. However, since H1 momentum is currently bullish, we expect one more push higher into resistance at 3403, which will provide a potential short opportunity.
o Note: Today’s US Jobless Claims data could trigger a stop-hunt move upward before a strong sell-off. Ahead of the news, price may continue ranging between 3385 – 3387.
Trading Plan
• Since price has not dropped significantly yet, it is likely still within wave 5 of the triangle. The upper resistance at 3403 is an ideal sell zone.
• A safer option: wait for price to break below the triangle’s lower boundary and close beneath it → then look for a breakout sell setup.
• Target: 0.618 Fibonacci retracement at 3345.
Trade Setup
• Sell Zone: 3403 – 3405
• Stop Loss: 3413
• Take Profits:
o TP1: 3374

GOLD eases as it tests $3,400, eyes US GDP dataOANDA:XAUUSD was broadly steady after a slight decline during the Asian session on Thursday (August 28), currently trading around $3,385/ounce. Investors will focus on the US GDP data, which is expected to cause significant market movements.
The revised second-quarter real gross domestic product (GDP) figure is expected to come in at today (Thursday), with an expected annualized quarterly growth rate of 3.1%, up from the previous reading of 3.0%. The US Bureau of Economic Analysis (BEA) will release its second-quarter GDP data. The BEA said in its preliminary estimate that the US economy grew at an annualized rate of 3%. A downward revision to the GDP data could hurt the dollar and help strengthen gold prices, while an upward revision could have the opposite effect.
Market attention will remain focused on US political tensions and trade war-related news. Following the release of US Q2 GDP data, the trading week will conclude with the release of the personal consumption expenditure (PCE) price index on Friday. The PCE index is the Federal Reserve’s preferred inflation measure and could influence market sentiment regarding a September rate cut.
Technical Outlook Analysis OANDA:XAUUSD
Gold has not been able to break above $3,400 after two sessions of testing, and it is currently retreating slightly from this level with a possible short-term target of $3,371, the 0.236% Fibonacci retracement point, as this is the closest support level currently.
Although gold may fall in the short term, it has also achieved the initial conditions for a possible increase, namely the price action maintained above the EMA21 followed by the RSI maintaining above the 50 mark but the slope is not significant, indicating that the upward momentum is not too strong.
As mentioned to readers, gold is in a sideways accumulation trend, while achieving some of the above short-term bullish conditions. Once gold breaks through the $3,400 mark, it will have the conditions to open a new bullish cycle, with the target then being around $3,430 to $3,450.
During the day, the technical outlook is more inclined towards short-term bullishness, and the notable points will be listed as follows.
Support: $3,371 – $3,350
Resistance: $3,400 – $3,430 – $3,450
SELL XAUUSD PRICE 3430 - 3428⚡️
↠↠ Stop Loss 3434
→Take Profit 1 3322
↨
→Take Profit 2 3316
BUY XAUUSD PRICE 3350 - 3352⚡️
↠↠ Stop Loss 3346
→Take Profit 1 3358
↨
→Take Profit 2 3364

Beyond the Chart – GOLD Market Technical AnalysisOANDA:XAUUSD Short Setup
Price swept liquidity above recent highs and rejected with a Volume Climax (VC). Market structure shows a Break of Structure (BOS) to the downside, aligning with the bearish trend.
Targeting the imbalance (FVG) below at 3376.78 as price seeks efficiency. Volume profile confirms sellers taking control after the fakeout. 🔑

Gold (XAU/USD) 28 August 2025Gold continues to consolidate within a high-volatility environment, with price testing key liquidity pools and approaching unmitigated supply/demand levels. Today’s analysis blends Daily macro bias, 4H swing structure, and 1H execution refinement to identify the most reliable zones for institutional-grade entries.
🔵 Demand Zones (Buy Setups)
Primary Buy Zone: $3360 – $3370
This is today’s highest-probability demand area.
Daily: Bullish structure intact with higher-highs and higher-lows.
4H: Fresh bullish Order Block formed after a strong BOS (Break of Structure).
1H: Liquidity sweep below recent lows at 3372, providing a refined entry trigger.
Indicators: RSI recovery from oversold divergence; MACD showing momentum reversal.
Volume: Absorption at 3365 confirms buyer presence.
Execution Plan:
SL: 3350 (structure invalidation)
TP1: 3405
TP2: 3425
Secondary Buy Zone: $3325 – $3335
Daily: Nested demand block aligning with prior bullish BOS.
4H: Deep discount zone of previous swing.
1H: ICT displacement candle originated at 3330, unmitigated.
Execution Plan:
SL: 3310
TP1: 3365
TP2: 3400
🔴 Supply Zones (Sell Setups)
Primary Sell Zone: $3420 – $3430
This is the nearest high-probability supply area.
Daily: Strong resistance shelf; unmitigated supply.
4H: Bearish OB after displacement down from 3428.
1H: Liquidity pool resting above 3415 equal highs.
Indicators: Bearish RSI divergence; MACD momentum fading.
Execution Plan:
SL: 3440
TP1: 3390
TP2: 3365
Secondary Sell Zone: $3455 – $3465
Daily: Weekly supply nested in premium pricing.
4H: Swing-high liquidity at 3460 remains untested.
1H: Inefficient wick zone above equilibrium.
Indicators: RSI extreme overbought; ATR volatility ceiling.
Execution Plan:
SL: 3475
TP1: 3430
TP2: 3400
⭐ Executive Summary – Golden Zone
The Primary Buy Zone at $3360 – $3370 stands out as today’s Golden Zone:
Backed by 6 institutional confluences across Daily, 4H, and 1H.
Well-defined risk with SL at 3350.
Reward asymmetry toward TP1 at 3405 and TP2 at 3425.
This zone offers the cleanest risk-to-reward profile, aligning macro structure with intraday liquidity positioning.
⚖️ Final Note
As always, zones are execution frameworks, not blind signals. Wait for confirmation on 1H/15M displacement and liquidity sweeps before entering. Managing risk with precision is crucial given Gold’s current volatility and ATR expansion.

Gold (XAUUSD) Intraday Analysis – August 28, 2025On the H1 timeframe, gold has bounced strongly from the 3,315 – 3,320 support zone and is now retesting the key 3,390 – 3,400 resistance area, which has acted as a strong supply zone in previous sessions.
1. Trend Outlook
The market structure is showing higher highs and higher lows, indicating bullish momentum in the short term.
EMA20 is sloping upward, confirming alignment with the current trend.
RSI remains in the mid-zone, leaving room for continuation if a breakout occurs.
2. Key Technical Levels
Immediate resistance: 3,390 – 3,400
Extended resistance: 3,410 – 3,420 (Fib 161.8 of the recent swing)
Near-term support: 3,370 – 3,375
Major support: 3,345 – 3,350
3. Trading Scenarios
Scenario 1: Bullish breakout
A clean breakout above 3,400 with momentum may extend the rally towards 3,410 – 3,420. Stop-loss can be placed below 3,375.
Scenario 2: Technical pullback
If price fails to clear 3,390 – 3,400, a pullback towards 3,370 – 3,375 is likely before the next upside attempt. This area can provide a dip-buying opportunity.
Scenario 3: Bearish reversal
A break below 3,345 – 3,350 would invalidate the short-term bullish structure, opening the way back to 3,320.
4. Intraday Strategy
Primary bias: Buy the dip near 3,370 – 3,375 or enter on a confirmed breakout above 3,400.
Risk management: Maintain a minimum R:R of 1:2 and avoid chasing the price without confirmation.
- Gold is now testing a critical resistance zone. Traders should closely monitor price action at 3,390 – 3,400 to gauge the next decisive move. Follow for more trading strategies and remember to save these key levels for today’s session.

The probability of a 25 basis point rate cut is 87%.Investors have also bet on two declines in September and December. This limits the room for further declines in the USD, unless the Fed accelerates the pace of interest rate cuts in the rest of the year. However, this possibility is low as almost all Fed members are concerned about rising inflation again.
The decline of the euro also contributed to the USD's rise.
It can be seen that the USD's recovery is not strong enough to reverse the greenback's downward trend, but it has also negatively affected gold prices.
Gold is also under profit-taking pressure after the previous strong increases.
Precious metals are also less attractive when US stocks have positive developments. Stock markets around the world often have extremely active trading in September and October. The strong cash flow into this channel reduces the appeal of the gold market.

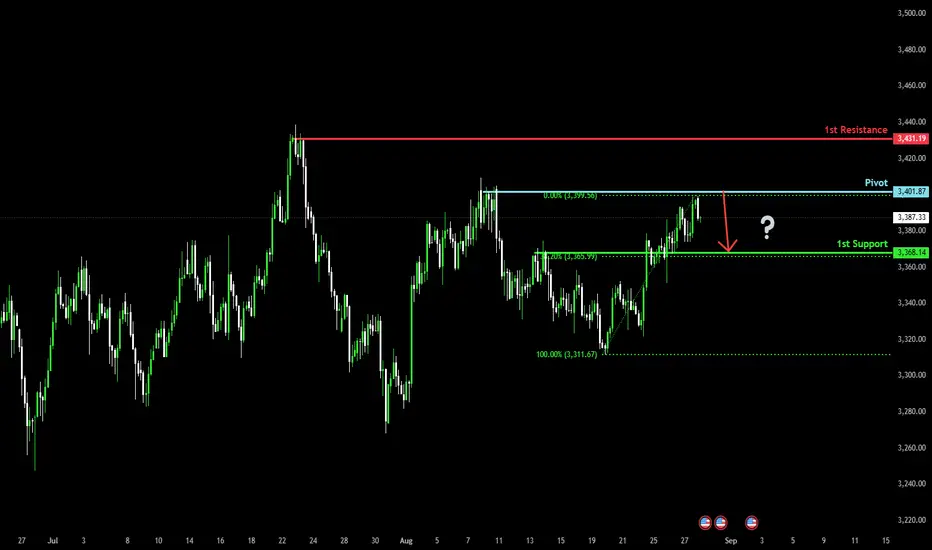
Could the Gold drop from here?The price has rejected off the pivot which is a swing high resistance and could drop to the 1st support.
Pivot: 3,41.87
1st Support: 3,368.14
1st Resistance: 3,431.19
Risk Warning:
Trading Forex and CFDs carries a high level of risk to your capital and you should only trade with money you can afford to lose. Trading Forex and CFDs may not be suitable for all investors, so please ensure that you fully understand the risks involved and seek independent advice if necessary.
Disclaimer:
The above opinions given constitute general market commentary, and do not constitute the opinion or advice of IC Markets or any form of personal or investment advice.
Any opinions, news, research, analyses, prices, other information, or links to third-party sites contained on this website are provided on an "as-is" basis, are intended only to be informative, is not an advice nor a recommendation, nor research, or a record of our trading prices, or an offer of, or solicitation for a transaction in any financial instrument and thus should not be treated as such. The information provided does not involve any specific investment objectives, financial situation and needs of any specific person who may receive it. Please be aware, that past performance is not a reliable indicator of future performance and/or results. Past Performance or Forward-looking scenarios based upon the reasonable beliefs of the third-party provider are not a guarantee of future performance. Actual results may differ materially from those anticipated in forward-looking or past performance statements. IC Markets makes no representation or warranty and assumes no liability as to the accuracy or completeness of the information provided, nor any loss arising from any investment based on a recommendation, forecast or any information supplied by any third-party.
Gold (XAUUSD) – Bullish Bias, Watching 3384–3386 ZoneGold (XAUUSD) Analysis – 28 August
Market Structure
H4 Trend: Bullish
M15 Trend: Bullish
➡️ Both timeframes are aligned, confirming an overall bullish bias.
Current Phase
M15 is in a pullback after recent bullish momentum.
Market preparing for potential continuation setups.
Key Zones
3384 – 3386 (First Buy Zone):
If respected, expect continuation toward 3395 – 3400.
3376 – 3378 (Deeper Demand Zone):
Strong institutional demand. If price dips here, this becomes the high-probability long entry zone.
Execution Plan
Wait for price action confirmation inside zones before entry.
If 3384 – 3386 fails, shift focus to 3376 – 3378.
Manage risk and follow structure.
Bias for Today
📈 Bullish – favoring long setups from demand zones.
📘 Shared by @ChartIsMirror

Bullish Setup for XAU/USDHello traders , the gold market is currently in a sensitive phase, still influenced by Fed Chair Jerome Powell’s remarks at Jackson Hole, signaling that monetary tightening could ease if the labor market weakens. This has pushed U.S. bond yields lower and weakened the dollar, allowing gold to remain elevated.
Adding to this , rising geopolitical tensions are fueling bullish momentum for gold, providing a solid foundation for recovery if global risks persist.
On the chart , gold is trading around $3,370, after bouncing strongly from the $3,321 support. This zone is becoming a “launchpad” for the next leg higher, especially as gold holds above key EMA levels.
The price structure outlines a bullish scenario with resistance targets:
$3,400 (psychological level – short-term take profit zone)
$3,433 (extended target – next strong resistance)
If the Fed maintains its dovish tone and the dollar stays weak , gold could sustain its upward momentum in the short term, opening the door to higher levels into September.

Safe-Haven Flows Boost GoldHello everyone, what are your thoughts on OANDA:XAUUSD ?
Yesterday, as expected, gold surged strongly and is now holding its bullish momentum, trading around $3,385 in Wednesday’s Asian session after bouncing from a low of $3,367 — a move of more than 200 pips.
Gold gained after the USD weakened following President Trump’s unexpected decision to dismiss Fed Governor Lisa Cook, prompting safe-haven flows into gold. At the same time, signals from Fed Chair Powell about a potential rate cut further support the bullish outlook, as gold typically benefits in a lower interest rate environment.
From a technical perspective, gold remains in an uptrend, with price holding above key EMAs and trendline support. Current pullbacks appear healthy, consolidating strength for the broader bullish structure. As long as this structure is intact, short-term upside momentum remains dominant.
The key levels to watch from a broader technical perspective are $3,400, and above that, $3,415 comes back into play.
Looking ahead, the market will closely watch the U.S. PCE inflation report on August 29, a key gauge for the Fed’s policy direction. Expectations of a policy shift could weigh further on the USD and provide additional support for gold. Meanwhile, rising geopolitical risks worldwide continue to position gold as a leading safe-haven asset.
Follow me for more updates! Don’t forget to like this post and share your thoughts in the comments.
Good luck!

Gold Futures | ADX Heating Up – Continuation or Trap at MH?Price has pushed away from the untested H4 FVG, showing strong bullish pressure. With ADX > 25 on the 15m and close to crossing on 1H/4H, momentum is shifting into trend mode.
My watch:
Break + retest of yesterday’s high and MH level for continuation longs.
Only looking for shorts if liquidity sweeps above MH and we see strong rejection.
Question is: do we run higher with ADX confirmation, or is this just a trap before a deeper pullback?

Quick US 30 Scalp on Correction & Gold MELTRed day for the Markets.
Took chance of some corrections.

Gold XAUUSD market analysis Gold #xauusd technical analysis. Price is bouncing off trend lines as support and resistance. Price is at resistance levels and should continue to drop down to support levels at the 3380 area. If you are forex trading gold #xauusd the short is short term goal. If you are trading futures we are still in a bull market overall direction is up. We will see the market retrace here back to our support trend lines.

Gold - This pattern just repeats!🚑Gold ( TVC:GOLD ) shifts bearish soon:
🔎Analysis summary:
With the previous 10 year bullish cycle, Gold perfectly followed market structure. With this 10 year cycle, Gold is still perfectly respecting market structure. Overall, it becomes more and more likely that Gold creates a top formation with a bearish correction following soon.
📝Levels to watch:
$3,500
SwingTraderPhil
SwingTrading.Simplified. | Investing.Simplified. | #LONGTERMVISION

GOLD → Bullish trend. Pullback before growthFX:XAUUSD continues to gradually storm the 3375-3405 area, paving its way to strong resistance at 3410. The fundamental background is relatively positive, with a bullish trend.
Gold has retreated slightly from its two-week peak ($3400), but retains its growth potential against the backdrop of two key factors: Pressure on Fed Chair Lisa Cook is undermining confidence in the dollar and strengthening demand for defensive assets. New tariffs on China and India are reviving fears about global growth, which is beneficial for safe havens.
But there are also restraining factors: A strong dollar could limit gold's growth. It is also worth paying attention to Friday's US inflation data (PCE), which will determine the further trend. Soft data will reinforce expectations of a Fed rate cut and push gold higher.
Resistance levels: 3386.5, 3393.5
Support levels: 3373.7, 3369.6
Movements up to 3410 may be zigzagging due to the fairly heavy zone of 3375 - 3410 (this can be seen in the volume profile). Focus on local but strong support: 3373 - 3369, the market may test this area before storming resistance 3386 - 3393 for growth to 3405 - 3410.
Best regards, R. Linda!

Gold is in the Bearish Direction after Retesting ResistanceHello Traders
In This Chart GOLD HOURLY Forex Forecast By FOREX PLANET
today Gold analysis 👆
🟢This Chart includes_ (GOLD market update)
🟢What is The Next Opportunity on GOLD Market
🟢how to Enter to the Valid Entry With Assurance Profit
This CHART is For Trader's that Want to Improve Their Technical Analysis Skills and Their Trading By Understanding How To Analyze The Market Using Multiple Timeframes and Understanding The Bigger Picture on the Charts

Excellent profits delivered XAUUSD As I mentioned in Today’s commentary session:
•i took buy trades at 3375-3376 and I'm expecting market will test 3400 benchmark
if H4-H1 candles flips above 3385-3390 then 3410 then 3420 will be my milestone for intraday.
My strategy was buy the dips from 3375–3378
Very happy with the profits so far I bought GOLD 3375 -3378 –
Always follow your setup & your path with patience and discipline.
My 1st targets 3400 is achieved alhumdulillah.
All I say thanks to those who followed & trust me and made profits.

27/08/25 Gold Swing LevelsSet your alerts. Watch the 5 mins (1 min if price spiking)
27/08/25 levels are marked
Always, price action determines trade.
Trade parameters
Entry on 5 min chart
Sl: 20-40pips
TP: 2-4x SL
