Gold Plan – Captain Vincent ( 27/08 )XAU/USD – Trump strengthens power at the FED, gold ranging around Storm Breaker
1. News Waves 🌍
Trump: “We will soon hold the majority at the FED. Miran may be moved to another position with a longer term.”
Trump: “I already have a candidate in mind to replace FED Governor L. Cook.”
U.S. Senate: preparing hearings next week for Trump’s FED nominee, S. Miran.
👉 This signals Trump is consolidating power at the FED. Markets fear the FED could lose independence → USD volatility rises, gold benefits from safe-haven flows.
2. Technical Outlook ⚙️
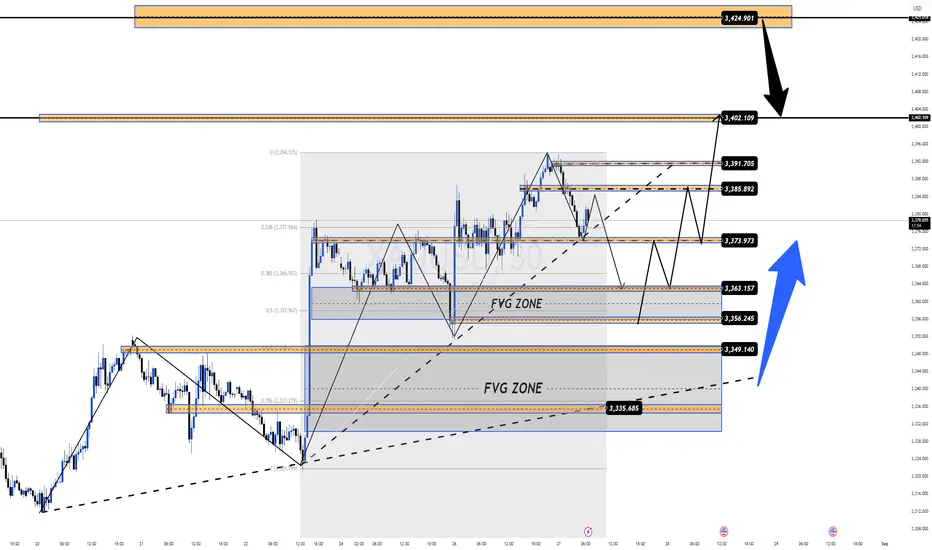
Gold is approaching Storm Breaker 🌊 (3400 – 3402) , overlapping with resistance 3392 – 3406 → high chance of profit-taking sell pressure.
On H1, multiple unfilled FVGs remain around 3355 and 3330, suggesting gold may retrace to test these support zones before deciding direction.
Intraday trend: range-bound movement → Sell at resistance, short-term Buy at supports.
3. Captain Vincent’s Map – Key Levels 🪙
Resistance (Storm Breaker 🌊): 3406 – 3400 – 3392
Supports:
3372 ( Minor Shield 🛡️ )
3355 ( Quick Boarding 🚤 – Buy Scalp Zone )
3344 ( Intermediate Shield 🛡️ )
3330 ( Golden Harbor 🏝️ – Main Buy Zone )
4. Trade Scenarios 📌
🔻 SELL at Storm Breaker 🌊 (priority setup)
Entry: 3400 – 3402
SL: 3408
TP: 3395 → 3393 → 3389 → 3386 → 33xx
🚤 BUY Scalp – Quick Boarding
Entry: 3353 – 3355
SL: 3345
TP: 3358 → 3361 → 3363 → 33xx
🏝️ BUY at Golden Harbor (major support)
Entry: 3330 – 3332
SL: 3325
TP: 3335 → 3338 → 3341 → 33xx
5. Captain’s Note ⚓
“Today gold stands before the Storm Breaker 🌊 , but below lie multiple shields of support. Smart traders may take a quick ride at Quick Boarding 🚤 , or patiently wait for Golden Harbor 🏝️ to anchor safely.”
Xauusd(w)

GOLD falls nearly $20, as Dollar recovers and market quietSummary: OANDA:XAUUSD fell sharply in Asian trading on Wednesday (August 27), after rising sharply in the previous session. Prices are currently trading around $3,374/oz, down nearly $20 on the day.
OANDA:XAUUSD is retreating from a two-week high near $3,400/oz after hitting that high on Wednesday morning. However, concerns about the Federal Reserve's autonomy and the latest U.S. tariff threats could ease the downward pressure on gold.
The US Dollar TVC:DXY rebounded on Wednesday, putting pressure on gold prices. However, the dollar's gains appeared to be limited by concerns about the Federal Reserve and tariffs.
OANDA:XAUUSD may be buying lower as investors look to buy on dips. Gold prices had earlier surged to a two-week high on Tuesday as US President Donald Trump announced the firing of Federal Reserve Governor Tim Cook, shaking investor confidence in the Fed's independence and boosting demand for safe havens.
Additionally, Bloomberg reported on Tuesday that U.S. President Trump has threatened to impose new tariffs and export restrictions on advanced technologies and semiconductors in retaliation for other countries imposing digital services taxes on U.S. tech companies. Trump’s recent trade brinkmanship has reignited tariff uncertainty among U.S. trading partners. Earlier this month, shortly after concluding negotiations with dozens of partners on tariffs targeting specific countries, Trump announced new tariffs on a range of imported products. Last week, he said he would impose new tariffs on imported furniture.
Technical Outlook Analysis OANDA:XAUUSD
Gold has yet to reach its upside target at the $3,400 base level, but has come under some pressure as it approaches this level and has declined in early trading today. Spot gold is currently trading at $3,376, close to the 0.236% Fibonacci retracement level. After breaking above the 0.236% Fibonacci retracement level, this Fibonacci level now acts as the closest technical support, below which gold could retest the 21-day EMA at around $3,350.
As mentioned to readers throughout the past publications, the overall trend of gold is still in a sideways accumulation phase. This is shown by the fact that RSI is hovering around 50, showing that the market sentiment is still hesitant in terms of momentum. When gold has enough conditions for a long-term trend, I will update readers quickly, but currently in the short term, gold has some technical factors supporting the possibility of price increases, with support at Fibonacci 0.236% and EMA21 and RSI above 50.
However, short-term open positions should still be prioritized during this period of sideways accumulation, along with the notable points that will be listed as follows.
Support: 3,371 – 3,350 USD
Resistance: 3,400 – 3,430 USD
SELL XAUUSD PRICE 3430 - 3428⚡️
↠↠ Stop Loss 3434
→Take Profit 1 3322
↨
→Take Profit 2 3316
BUY XAUUSD PRICE 3350 - 3352⚡️
↠↠ Stop Loss 3346
→Take Profit 1 3358
↨
→Take Profit 2 3364

Gold Approaching Key Resistance | Sell-on-Rise Opportunity AheadGold (XAUUSD) is expected to face strong resistance between 3485 and 3492 — a prime zone where fresh sellers could step in and trigger a downside move. We're eyeing profit opportunities with a sell-on-rise setup.
🔻 Short Trade Setup – Fading the Strength
Entry: Sell at 3386
Add on Strength: 3392
Targets: See chart for marked zones
Invalidation: Daily close above 3402
📉 Risk-Reward Outlook
This setup presents a favorable risk-reward ratio, especially for short-term traders aiming to capitalize on a potential rejection at resistance. As always, keep your risk tight and position sizing disciplined.
Gold has had its run — now the odds may favor the contrarian. Keep an eye on momentum and price action at the resistance zone.
👍 If this idea aligns with your view, give it a like and drop your thoughts in the comments — let’s exchange ideas and insights!
🔔 Follow us for more actionable trade setups.
Happy Trading,
– The InvestPro Team

XAUUSD📈 XAUUSD – 1H Timeframe
🟢 Long Call/ Bullish Candle
🔹 Gold is forming HH & HL (Higher Highs & Higher Lows) on the 1H chart → Uptrend structure intact.
🔹 Fib Retracement Setup → Perfect dip-buy opportunity from CMP (Current Market Price).
💡 Plan:
👉 Buy from CMP 🎯
👉 Book partial profits on resistance levels 🪙
👉 SL below Fib retracement 🔒
🌍 Weekly Fundamental Drivers:
1️⃣ Fed remains cautious on rate cuts, supporting safe-haven demand 🏦
2️⃣ Geopolitical uncertainty & central bank gold buying continue to give long-term bullish momentum 🌐
⚠️ Risk Management: Stay disciplined — let structure + fundamentals guide your trade.

DeGRAM | GOLD formed the ascending wedge📊 Technical Analysis
● XAU/USD is retreating from 3,386 resistance after forming a rising wedge, a bearish continuation pattern pointing to potential downside.
● A break below 3,374 exposes 3,351 support, with bearish momentum reinforced by the rejection at 3,402 and the wedge breakdown scenario.
💡 Fundamental Analysis
● US Treasury yields climbed after stronger-than-expected durable goods orders, boosting the dollar and capping gold demand in the near term.
✨ Summary
Bearish below 3,386; targets 3,374 → 3,351. Invalidation above 3,386.
-------------------
Share your opinion in the comments and support the idea with a like. Thanks for your support!

"Gold 08/27/2025: Will It Correct Deeply or Continue to Surge?"Market Overview
Gold surged on August 26, 2025: Spot gold up 0.5% to $3,382.19/oz (highest since August 11), futures up 0.5% to $3,433/oz.
Driver: President Trump's firing of Fed Governor Lisa Cook over mortgage fraud allegations creates uncertainty, boosting gold as a safe-haven. Bob Haberkorn (RJO Futures): “The Fed is the main driver of gold's price action.”
Fundamental Factors
Fed: Chair Powell signals 0.25% rate cut in September 2025 (87% probability, CME FedWatch).
Economic Data: US durable goods orders down 2.8% (July), better than forecast. Await GDP (Aug 28) & PCE (Aug 29).
Gold Appeal: Attractive in low rates and economic uncertainty.
Technical Analysis
Gold hit Order Block (OB) at 339x, retraced to 337x. Bullish above 337x; break below with bad news triggers Bearish.
Key Levels:
Support: 337x, 3353-3357
Resistance: 339x, 3400-3402
Trading Plan (ICT)
BUY Setups
Scalp Buy:
Entry: 3370-3368
SL: 3365
TP: 3378 / 3388 / 3394
Zone Buy:
Entry: 3357-3353
SL: 3346
TP: 3364 / 3373 / 3381 / 3394 / 3402
SELL Setups
Scalp Sell:
Entry: 3387-3389
SL: 3393
TP: 3379 / 3369
Zone Sell:
Entry: 3400-3402
SL: 3410
TP: 3394 / 3384 / 3371 / 3362 / 3350

XAU/USD Intraday Plan | Support & Resistance to WatchGold briefly broke above the $3,386 resistance, but failed to hold and has since pulled back, now trading around $3,376. The rejection highlights $3,386 as a key barrier, while price remains supported above the $3,363 level with the 50MA (pink) still trending upward.
If buyers can reclaim and sustain above $3,386, the next upside targets are $3,406 and $3,422. On the downside, a break below $3,363 would expose the $3,347–$3,328 support zone, with further weakness opening the door toward the Secondary Support Zone ($3,304–$3,281).
📌Key Levels to Watch
Resistance:
$3,386
$3,406
$3,422
Support:
$3,363
$3,347
$3,328
$3,304
$3,281

GOLD (XAUUSD): Important Breakout
Gold went up strongly yesterday, breaking a key daily
horizontal resistance cluster.
We see its retest at the moment.
With a great chance, the price will continue rising from that.
Next resistance will be 3400.
❤️Please, support my work with like, thank you!❤️
I am part of Trade Nation's Influencer program and receive a monthly fee for using their TradingView charts in my analysis.

FOMO Buying Still Strong, Waiting for a Clean Pullback to BUY MMFLOW TRADING PLAN XAUUSD
Gold continues to hold its bullish momentum in the Asian session today, testing the 9x zone before pulling back towards the 7x level. Buyers remain in control, driven by strong FOMO sentiment as the USD shows signs of weakness.
👉 MMF’s outlook:
We remain bullish long-term – looking for cleaner pullbacks to secure safer BUY entries and hold positions towards higher targets.
🔎 Short-Term Outlook (1–2 days)
If price breaks the 337x structure, we may see a quick drop towards 335x – 334x liquidity zones before resuming the upside and potentially heading into NEW ATH territory.
Watch key support and resistance zones closely to identify high-probability entries.
📌 Key Levels to Watch
Support: 3363 – 3356 – 3349 – 3335
Resistance: 3385 – 3391 – 3402 – 3425
🎯 Today’s Trading Plan
🔵 BUY Scalp
Entry: 3356 – 3354
SL: 3350
TP: 3360 – 3365 – 3370 – 3375 – 3380 – 3390 – 3400 – ???
🔵 BUY Zone (Swing/Position)
Entry: 3336 – 3334
SL: 3330
TP: 3340 – 3345 – 3350 – 3360 – 3370 – 3380 – 3400 – ????
🔴 SELL Scalp
Entry: 3385 – 3387
SL: 3390
TP: 3380 – 3375 – 3370 – 3365 – 3360 – 3350
🔴 SELL Zone
Entry: 3401 – 3403
SL: 3407
TP: 3396 – 3390 – 3380 – 3370
📌 Summary:
Gold remains in a strong uptrend, but the best opportunities may come from waiting for deeper pullbacks to BUY. Traders can either scalp within today’s ranges or aim for long-term positions from the lower buy zones.
GOLD H4 | earish Reversal Setup at Swing High ResistanceBased on the H4 chart analysis, we could see the price rise to the sell entry at 3,400.60, which is a swing high resistance and could reverse from this level to the downside.
Stop loss is at 3,431.26, which is a swing high resistance that aligns with the 127.2% Fibonacci extension.
Take profit is at 3,350.21, which is a pullback support that lines up with the 50% FIbonacci retracment.
High Risk Investment Warning
Trading Forex/CFDs on margin carries a high level of risk and may not be suitable for all investors. Leverage can work against you.
Stratos Markets Limited (tradu.com ):
CFDs are complex instruments and come with a high risk of losing money rapidly due to leverage. 65% of retail investor accounts lose money when trading CFDs with this provider. You should consider whether you understand how CFDs work and whether you can afford to take the high risk of losing your money.
Stratos Europe Ltd (tradu.com ):
CFDs are complex instruments and come with a high risk of losing money rapidly due to leverage. 66% of retail investor accounts lose money when trading CFDs with this provider. You should consider whether you understand how CFDs work and whether you can afford to take the high risk of losing your money.
Stratos Global LLC (tradu.com ):
Losses can exceed deposits.
Please be advised that the information presented on TradingView is provided to Tradu (‘Company’, ‘we’) by a third-party provider (‘TFA Global Pte Ltd’). Please be reminded that you are solely responsible for the trading decisions on your account. There is a very high degree of risk involved in trading. Any information and/or content is intended entirely for research, educational and informational purposes only and does not constitute investment or consultation advice or investment strategy. The information is not tailored to the investment needs of any specific person and therefore does not involve a consideration of any of the investment objectives, financial situation or needs of any viewer that may receive it. Kindly also note that past performance is not a reliable indicator of future results. Actual results may differ materially from those anticipated in forward-looking or past performance statements. We assume no liability as to the accuracy or completeness of any of the information and/or content provided herein and the Company cannot be held responsible for any omission, mistake nor for any loss or damage including without limitation to any loss of profit which may arise from reliance on any information supplied by TFA Global Pte Ltd.
The speaker(s) is neither an employee, agent nor representative of Tradu and is therefore acting independently. The opinions given are their own, constitute general market commentary, and do not constitute the opinion or advice of Tradu or any form of personal or investment advice. Tradu neither endorses nor guarantees offerings of third-party speakers, nor is Tradu responsible for the content, veracity or opinions of third-party speakers, presenters or participants.

World gold prices skyrocketed and reached a two-week highGold prices surged to a two-week high on safe-haven demand after US President Donald Trump announced he had fired a Federal Reserve (FED) governor.
On Monday evening, President Trump announced the dismissal of Fed Governor Lisa Cook following allegations of falsifying mortgage documents, citing “good cause” for her removal.
For her part, Lisa Cook argued that Trump did not have the authority to fire her, and that she would not resign, while her lawyer said she would take “all necessary actions to stop” Trump’s actions.
Gold benefited from safe-haven flows. Many Asian and European markets fell, US Treasury yields rose slightly, the USD Index weakened. US stock indexes traded around flat at mid-session.

27/8/68 : XAUUSD ( Europe / London Session )Using it from Europe Session until 7.00PM , I'll new analysis and update at 8.00PM
Resistance
3395-3400
3385-3390
3380
Support
3370
3359-3365
3349-3354

XAUUSD IDEAS AND OUTLOOK FOR NEXT WEEK Xauusd Has Succsesfully rejection from higer timeframe at h4 and daily trendline and divergence at h1 timeframe

The market is exploding. Can it break through?Gold is currently forming a converging triangle, and a major rally is imminent. The monthly line has been fluctuating for 4 trading months. The August monthly line is about to end, and the daily line is converging into a large triangle. Whether it breaks upward or downward, there will be a considerable unilateral market trend.
After the sharp rise on Tuesday, the price closed higher on the daily chart, and the overall bullish trend remains strong; however, the current market is also approaching the key resistance area. Resistance was encountered near 3393 in early Asian trading. Watch for potential corrections and gains before a breakout. The 3365-3370 area below is crucial. If gold remains above this level, bullish momentum remains. A break below could signal the end of the bull market.
Key Positions:
Resistance Levels: 3395, 3400, 3410.
Support Levels: 3370, 3365, 3360.
Trading Strategy:
Long around 3365, stop loss at 3355, profit range 3380-3390-3400.
Short around 3400, stop loss at 3410, profit range 3370-3360.

Will gold continue to accumulate or is it ready to surge higher?Powell hints at a 0.25% rate cut in September (86% probability per CME FedWatch)!
Gold rises in a low-interest-rate environment, but PCE data on August 29 (projected core inflation at 2.9%) could shift the game.
Gold just swept the FVG and is back in range—BUY or SELL?
📈 Technical Analysis:
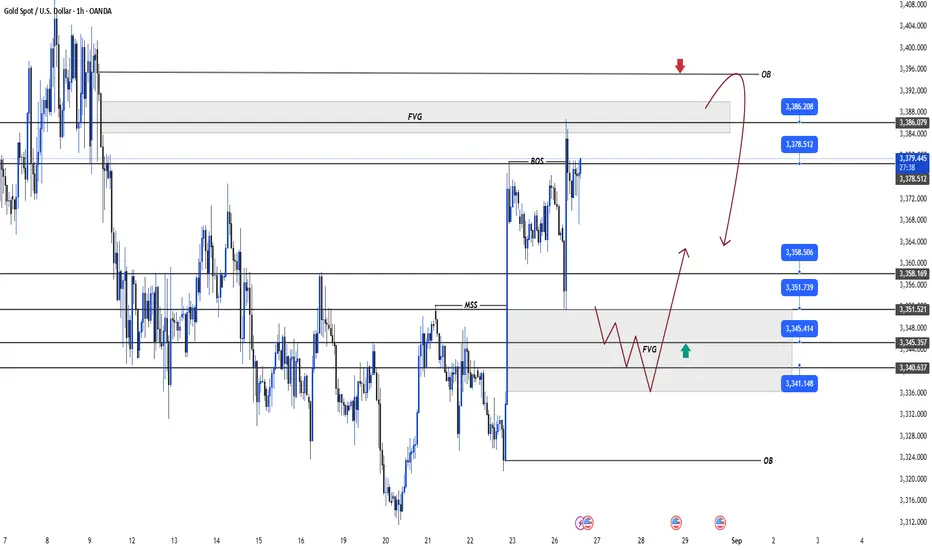
After a long accumulation phase, gold dropped sharply to 336x, then rallied quickly, breaking the 3378 support. The FVG sweep signals Smart Money manipulation!
Currently, prioritize BUY, but optimize entries at key FVG zones.
💡 Key Price Levels:
Resistance: 3379, 3386, 3395
Support: 3358, 3351, 3345, 3341
🔥 Trading Strategies:
BUY Scalp: 3358-3356,
SL 3353
TP 3364-3374-3385
BUY Zone: 3345-3343,
SL: 3335
TP: 3358-3368-3386-3394
SELL Zone: 3394-3396,
SL: 3400
TP: 3386-3378-3369-3358
#GoldTrading #TradingView #XAUUSD #ForexSignals #FedRateCut #PCEData #DailyPlan
Elliott Wave Analysis – XAUUSD 27/08/2025
Momentum
• D1 timeframe: Momentum is showing reversal signals, as mentioned in yesterday’s plan. Currently, D1 is in the overbought zone, suggesting that bullish momentum has weakened and the market needs at least one corrective move to regain strength.
• H4 timeframe: Momentum is turning bearish. We need to wait for the current candle to close for confirmation, but there is a high probability that today’s main trend will be bearish.
• H1 timeframe: Momentum is in the oversold zone and preparing to turn up. If price rises into the overbought zone, then reverses bearish without breaking above 3394, there is a strong chance of a long-term decline – creating a sell opportunity.
________________________________________
Wave Structure
• D1 timeframe: With current reversal signals, there are two possible scenarios:
1. Triangle abcde – as shown in previous plans.
2. Combination correction (WXY) – where wave W is a zigzag, wave X is a double zigzag, and wave Y is a triangle (as on the chart). In this case, price may decline back toward 3311.
👉 Both scenarios are valid, with no clear dominance, so continued observation is required.
• H4 timeframe: A diagonal ending triangle is forming, combined with H4 momentum turning bearish. Although we need confirmation from the current H4 close, it is clear that bullish momentum is weakening → we should look for sell opportunities in line with H4 momentum.
• H1 timeframe: According to yesterday’s plan, we expected wave 3. However, several factors suggest otherwise:
o Price corrected deeply toward 3350.
o The rebound lacked strong momentum.
o An ending diagonal triangle appeared (not typical in wave 3, as it reflects very weak buying pressure).
o RSI shows bearish divergence, further confirming weakening bullish momentum.
Altogether, these point to a likely strong and sharp decline once the pattern completes.
📌 Ideal target zone: 3387 – 3390. If the current drop is wave A or wave 1, then the rebound of wave B or wave 2 should unfold within this zone.
________________________________________
Trading Plan
• Sell Zone: 3387 – 3390
• Stop Loss: 3397
• Take Profit:
o TP1: 3371
o TP2: 3350
o TP3: 3330

Gold (XAUUSD) Intraday Analysis – August 27, 2025On the H1 chart, gold continues to hold a bullish structure after bouncing strongly from the key support zone at 3315 – 3320. Price is currently moving inside a short-term ascending channel, showing minor pullbacks but still maintaining upward momentum.
Technical Outlook:
Trendline & Price Action: After retesting the August 26 low, price created a strong rally, confirming a higher low → short-term uptrend is still valid.
EMA (20 – 50): Price trades above both EMAs, showing buyers remain in control. Watch for pullbacks toward EMA20 for potential re-entries.
RSI H1: Holding above 50 with no clear bearish divergence → bullish momentum remains intact.
Fibonacci: The last retracement held between 0.618 – 0.786 Fib levels before bouncing, signaling strong demand.
Key Levels:
Near-term support: 3372 – 3375 (channel bottom + EMA20).
Strong support: 3355 and 3320 (previous low & demand zone).
Immediate resistance: 3395 – 3400.
Major resistance: 3415 – 3420 (upside target if channel breaks).
Trading Strategy:
Primary Bias: Buy on dips within the ascending channel
Entry zone: wait for retest around 3372 – 3375 or deeper at 3355.
Stop Loss: below 3350.
TP1: 3395 – 3400.
TP2: 3415 – 3420.
Risk scenario: If price breaks below 3350, expect a deeper test toward 3320, shifting the structure into a broader sideways range.
Conclusion:
Gold maintains a short-term bullish outlook as long as the 3350 – 3355 zone holds. Intraday traders should favor long setups on pullbacks, keeping a close eye on resistance around 3400 – 3420 for profit-taking.
- Save these key levels for reference and follow for more strategies in the next sessions.

BTCUSD POSSSIBLE BUY SETUP STRUCTURE CHANGEClear Breakout of structure waiting for retracement, and there are other things to look at, like support and imbalance
1-BOS
2-FIB 78%
3-S&P
4-IMBALANCE
5-DEMAND ZONE

Gold Holds Firm at $3,375 – Bullish Trend in FocusHello everyone, what are your thoughts on the current OANDA:XAUUSD trend?
After a slight dip at the start of yesterday’s session, gold quickly recovered and is now stable around $3,375/oz. The main driver behind this rebound comes from growing expectations that the Fed will cut rates in September, while ongoing political tensions in the US continue to weigh on the dollar, reinforcing gold’s role as a safe-haven asset.
From a technical perspective, the bullish trend remains intact as the market continues to form a series of Break of Structure (BOS), reflecting steady buying pressure. This suggests the most reasonable scenario is to maintain a trend-following strategy, favouring long positions with the next targets being supply zones and key resistance levels ahead.
Do you think gold has enough strength to break through and conquer higher resistance levels this week?
Feel free to share your views in the comments — let’s discuss together!

GOLD Local Short!
HI,Traders !
#GOLD is going up now
But will soon hit a horizontal
Resistance of 3394.70 from
Where we will be expecting a
Local pullback and we will
Be expecting a local move down !
Comment and subscribe to help us grow !

Unlocking Gold’s $3,600 Rally Before the Crowd /Best Entry Point1️⃣ General Overview
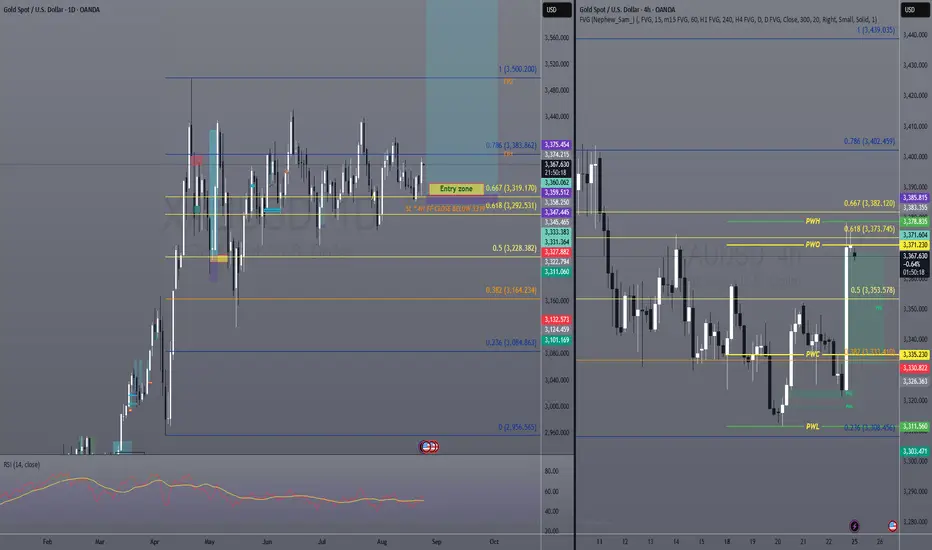
Gold remains in a corrective phase. Unless we see a clear 4H close above 372, bearish corrective pressure will stay stronger. However, certain zones may trigger bullish reactions if respected.
2️⃣ Key Levels
353 → First potential reversal area.
364 – 373 → Upside targets if 353 closes above this price on the 4H timeframe.
378 → Breakout level; above it price opens the way to higher targets.
382 – 392 – 402 → Next resistance levels if price closes above 378 on 4H timeframe.
335 → Strongest potential weekly buy zone if tested.
329 – 335 (ideal 35–29 range) → Ideal buy zone, though less likely to be visited this week.
3️⃣ Trade Scenarios & Setups
🔹Bullish Setup:
4H close above 353 → look for a move toward 364 → 373 → swing/open target.
4H close above 378 → momentum extends to 382 → 392 → 402.
Above 402 → new analysis will be required.
🔺 Bearish Setup:
4H close below 353 → decline toward 335 (strong weekly buy zone).
An extended drop into the 35–29 range = an ideal buy setup, but the probability is low.
GOLD Bullish Breakout!
HI,Traders !
#GOLD made a bullish
Breakout of the falling resistance
And the breakout is confirmed
So we are bullish biased
And we will be expecting
A further bullish move up !
Comment and subscribe to help us grow !

GC Midweek Outlook – Daily Imbalance Tested, H4 FVG Still in PlaPrice has now completed the move into the Daily FVG (~3425–3443) that I highlighted earlier this week. This is the critical mid-week decision point.
Bearish Case: If price rejects here, downside rotation into the untouched H4 FVG (3377–3396) remains possible before any larger move higher.
Bullish Case: If buyers defend the H1 imbalance and hold above 3412, continuation toward the Monthly High (3451) is on the table.
ADX remains under 25, suggesting no strong trending conditions yet — market is still liquidity-driven.
I’ll be watching the Daily FVG reaction and how price handles the H1 imbalance as key intraday signals.
