EUR/USD Breakout Incoming? COT & Sentiment Point to 1.1850COT Report (09/09/2025)
EUR (Euro FX CME): Non-Commercials increased longs (+2,389) and reduced shorts (-3,696) → bullish bias.
USD (US Dollar Index): Non-Commercials remain net short (24,750 vs 19,192 longs). Slightly bearish bias on the dollar.
👉 The combination suggests a favorable context for Euro strength against USD.
📊 Seasonality
September is historically flat or slightly negative for EUR/USD, but over the last 5 years seasonality shows a recovery in the second half of the month.
👉 This reinforces the idea that downside risk is limited and that pullbacks may offer long opportunities.
🧠 Sentiment
Retail traders: 74% short, only 26% long.
Classic contrarian signal: retail is short, which supports a long bias.
📉P rice Action & Technicals (H1/D1/W1)
Price is moving inside a daily ascending channel (uptrend in progress).
Key resistance: 1.1800 – 1.1850 (weekly supply cluster).
Main support: 1.1650 – 1.1600 (daily demand zone, RSI reacted).
Daily RSI above 50 → positive momentum, not overbought.
✅ Operational Summary
EUR/USD shows a favorable context (fundamentals + COT + sentiment) supporting the upside.
Technical structure favors a test of 1.1850 resistance.
Best strategy: look for long entries on pullbacks or breakouts, with invalidation below 1.1650.
Xauusd(w)

New US visa policy urged gold to reach another record high againGold prices surged following the announcement of a new H-1B visa policy, which includes a tenfold fee increase, sparking concerns over a further weakening of the labor market. Concurrently, the recent decline in the US dollar index, driven by mounting expectations of a Fed rate cut, has increased the appeal of non-yielding assets, lending further support to gold.
From a technical perspective, XAUUSD has surpassed the 3700 resistance level and is now advancing towards the next resistance at 3800. The expansion of the EMAs (21,78) indicates strong bullish momentum.
Should XAUUSD break above the 3800 level, it could proceed to test the subsequent resistance at 3900. Conversely, a reversal could see XAUUSD retest the 3700 support level.
By Van Ha Trinh - Financial Market Strategist at Enxess

GOLD Trading Opportunity! SELL!
My dear followers,
I analysed this chart on GOLD and concluded the following:
The market is trading on 3754.1 pivot level.
Bias - Bearish
Technical Indicators: Both Super Trend & Pivot HL indicate a highly probable Bearish continuation.
Target - 3743.6
Safe Stop Loss - 3760.9
About Used Indicators:
A super-trend indicator is plotted on either above or below the closing price to signal a buy or sell. The indicator changes color, based on whether or not you should be buying. If the super-trend indicator moves below the closing price, the indicator turns green, and it signals an entry point or points to buy.
Disclosure: I am part of Trade Nation's Influencer program and receive a monthly fee for using their TradingView charts in my analysis.
———————————
WISH YOU ALL LUCK

ANFIBO | XAUUSD - next ATH ??? [09.23.2025]Sorry guys, I'm very busy today so I can't share my views in detail. I will share my trading plan first, then update the details later ;)
Here's my OANDA:XAUUSD plan today:
>>> BUY ZONES:
ENTRY: 3715 - 3720
SL: 3710
TP: 3740 - 3760 - 3770 - 3800
>>> SELL ZONES:
ENTRY: 3800 - 3795
SL: 3805
TP: 3760 - 3730
GOODLUCK GUYS!!!

XAU/USD Intraday Plan | Support & Resistance to WatchGold continues its strong rally, now trading around $3,755 after breaking out of the ascending channel. To sustain momentum, we need to see a confirmed hold above $3,753, which would open the way toward higher resistance levels.
Failure to confirm this breakout could trigger a temporary pullback into lower support zones, with a potential retest of the 50MA if bears take short-term control. The higher price extends, the greater the risk of sharp swings and volatility spikes.
📌 Key Levels to Watch
Resistance:
$3,768
$3,782
Support:
$3,753
$3,728
$3,712 (MA50 retest zone)
🔎 Fundamental Focus – Tue, Sep 23
Key drivers today: US PMIs, Trump remarks + Richmond Index, and the main event — Powell speech.
Gold’s rally is extended, so expect headline-driven swings and possible volatility spikes around these releases.

GOLD IS HIT ZONE BUY ABOVE 3730 ☄️ Gold Market Outlook 09/ 17 (Based on SMC) ☄️
Main Trend
🔤After multiple CHoCH and BOS confirmations, price has shifted into a clear bullish structure.
🔤Consecutive BOS around 3700 – 3740 confirm strong buying pressure.
🔤Multiple FVG zones formed below → market may retrace to fill these imbalances before continuing higher.
Trading Plan
🔼Scenario 1: Buy continuation (Priority)
Condition: Price holds above 3730 and shows bullish reaction (bullish engulfing or minor BOS on M5/M15).
Entry: 3730 – 3735 (nearest FVG).
🔼Scenario 2: Buy on deeper retracement
If price breaks below 3730 → wait for price to reach 3710 – 3720 or deeper 3685 – 3695.
Entry: Look for CHoCH/BOS confirmation at these zones.
🔽Scenario 3: Short-term Sell (counter-trend)
Only consider if a clear bearish CHoCH forms on M15/H1 at 3745 – 3755.
Entry: 3745 – 3750.
➡️Overall structure remains bullish with multiple BOS confirmations. FVG and demand zones below act like magnets, likely pulling price down before continuation. Best to trade with the trend → Buy at FVG/Demand zones, only consider counter-trend Sell with clear bearish signals.

GENERAL CONTEXT I SEP/23/2025🔎 GENERAL CONTEXT
- Gold continues to maintain a strong uptrend, reflected by the Higher High – Higher Low structure.
- Price just touched the H1 VaH zone ~3757 and showed a small reaction → indicating short-term selling pressure.
- However, multiple key support levels lie below (3739 – 3720), allowing potential recovery.
- The 3775–3780 zone is considered an extended target if the bullish trend continues.
📍 TRADING SCENARIOS
🟢 Scenario 1 – BUY at 3739 (H1 Support)
🔺 Conditions:
Price pulls back to 3739
Bullish reversal signals appear (Pin Bar / Engulfing M15–H1)
Volume holds steady
🔹 Reason:
Nearest support after VaH
Structure remains bullish → priority on trend-following buys
🎯 TP: 3757 → 3775
🛑 SL: below 3732
🟡 Scenario 2 – BUY at 3720 (H1 POC zone)
🔺 Conditions:
Price retests 3720 POC
Strong absorption and bullish candles appear
🔹 Reason:
POC is often a key volume balance zone → buyers likely to react
Confluence with H1 uptrend line
🎯 TP: 3750 → 3765
🛑 SL: below 3712
🔴 Scenario 3 – SELL reaction at 3757–3760 (H1 VaH zone)
🔺 Conditions:
Price retests 3757–3760
Strong rejection (Bearish Pin Bar / Engulfing)
🔹 Reason:
VaH often acts as a profit-taking zone and potential buyer trap
If breakout fails → likely short-term pullback
🎯 TP: 3740 → 3720
🛑 SL: above 3765
⚠️ Scenario 4 – BUY breakout above 3760
🔺 Conditions:
H1 candle closes above 3760
Pullback holds above 3757
🔹 Reason:
Successful breakout of VaH zone → uptrend expansion
May trigger new buying momentum supported by news / market flows
🎯 TP: 3775 → 3785
🛑 SL: below 3750
📌 SUMMARY
- Main trend remains bullish → priority on BUY setups at 3739–3720 supports.
- SELL only if strong rejection signals appear at 3757–3760.
- Zone 3775–3780 is the short-term extended target.
- Manage risk strictly as price is at new highs → high volatility risk.

Gold Facing Rejection, Possible Pullback Toward Support ZoneGold is currently trading around 3,750 after a strong upward move but is now showing signs of rejection at the recent high. The chart suggests a potential pullback, with price expected to retrace toward the highlighted support zone near 3,700–3,710. If bearish momentum continues, the target lies in this demand area, where buyers may look for a fresh opportunity.

GOLD (XAUUSD): Updated Support & Resistance Analysis
Here is my latest structure analysis for Gold.
Resistance 1: 3798 - 3802 area
Resistance 2: 3848 - 3852 area
Support 1: 3690 - 3707 area
Support 2: 3613 - 3643 area
Support 3: 3560 - 3580 area
Support 4: 3511 - 3532 area
Consider these structures for pullback/breakout trading.
❤️Please, support my work with like, thank you!❤️
I am part of Trade Nation's Influencer program and receive a monthly fee for using their TradingView charts in my analysis.

Liquidity Hunt & Bullish Continuation Setup | MMFLOW TRADING📊 Market Context
Gold continues to show impressive bullish momentum, supported by global safe-haven flows amid geopolitical risks and a softer USD backdrop. After breaking through multiple resistance zones, price action is now consolidating near 3760, preparing for the next liquidity sweep. The market narrative is clear: institutional flows and ETF demand are driving momentum, but sharp pullbacks remain possible as liquidity zones above and below get tested.
🔎 Technical Analysis (H1/H4/2H)
Price recently touched 3760, confirming bullish structure.
Short-term support: 3725, acting as CP retest zone.
Stronger support: 3689–3690, overlapping with OBS + FVG low zone.
Resistance targets: 3788 (first liquidity pool) and 3805–3830 (large liquidity area).
Structure remains bullish, but a pullback into demand zones before another leg higher is likely.
🔑 Key Levels
Resistance / Sell Zones: 3760 ➡️ 3788 ➡️ 3805–3830
Support / Buy Zones: 3725 ➡️ 3689–3690
📈 Scenarios & Trading Plan
✅ BUY ZONE 1 (Shallow Pullback): 3725
SL: 3716
TP: 3760 ➡️ 3788 ➡️ 3805 …
✅ BUY ZONE 2 (Deep Liquidity Retest): 3689–3690
SL: 3680
TP: 3725 ➡️ 3760 ➡️ 3788 ➡️ 3830 …
✅ SELL SCALP (Liquidity Trap): Around 3805, only if rejection patterns confirm
SL: 3810
TP: 3775 ➡️ 3760 ➡️ 3740 …
⚠️ Risk Management Notes
Expect liquidity sweeps both above 3788 and below 3725 – don’t chase price mid-range.
Pullbacks are opportunities; stay patient and wait for confirmations.
News-related spikes (Fed or geopolitical) may cause abnormal volatility.
✅ Summary
Gold remains in a clear bullish trend, with 3788–3805 as the next upside magnet. Plan: buy dips at 3725 and 3689–3690, while monitoring for short-term sell traps near 3788–3805. Patience and disciplined execution will be key as liquidity hunts unfold.
📢 Follow MMFLOW TRADING for real-time updates, liquidity-based strategies, and BIGWIN setups on gold!

GOLD only BullishIn my last gold post, I had updated a few psychological levels; today's trade is based on the simple breakout level of those psychological levels.
i have also marked how perfectly these levels are working.
Thank you for following me and showing support, hope you guys are learning from my post.

EURUSD POSSIBLE SELL SETUP💡 EURUSD 2H Outlook – Bearish Setup in Play
After a strong bounce from demand, price is now retesting the supply zone around 1.1820 – 1.1840. Structure shows a possible distribution phase forming here, with sellers waiting to step back in.
🔽 Bearish Scenario
If rejection confirms, price could drop toward the demand zone at 1.1720 – 1.1740.
A clean break below 1.1720 would open deeper downside continuation.
🔼 Bullish Scenario
Buyers would need a strong breakout above 1.1840 supply to invalidate this bearish outlook and push toward higher levels.
⚔️ Key Levels to Watch
Resistance: 1.1820 | 1.1840
Support: 1.1760 | 1.1720
📊 Current structure favors short setups from supply, with confirmation entries being the safest.
✅ If this analysis adds value, don’t forget to boost & follow for more updates across Forex, Crypto, and Indices.
💼 If you need account management (personal or funded), I provide professional trading strategies designed for consistency and growth.

23/9/68 : XAUUSD ( Europe / London Session )Using it from Europe Session until 7.00PM , I'll new analysis and update at 8.00PM
Resistance
3767-3772
3757-3762
3751
Support
3740
3729-3735
3719-3724

XAU/USD – Technical Analysis H1 (September 23, 2025)Gold is currently trading around 3,745 USD/oz after a strong upward move from the support zone of 3,640 – 3,650 USD/oz. Below are the key levels and trading strategies:
1. Trend and Price Action
Price has broken out of the bearish channel drawn from September 17–19, confirming a strong upward move.
After the breakout, gold has formed a minor pullback but maintains the bullish trend, indicating continued buying pressure.
The H1 chart shows a classic flag breakout pattern, with a sharp upward momentum following the channel breakout.
2. Key Support and Resistance Levels
Support: 3,730 USD and 3,710 USD – these levels coincide with previous lows and the breakout zone.
Near-term Resistance: 3,760 – 3,770 USD, where short-term profit-taking may appear.
Long-term Resistance: 3,790 – 3,800 USD, the previous monthly high; monitor price reactions at this level.
3. Technical Indicators Reference
EMA 20/50 H1: EMA 20 is above EMA 50, confirming the short-term bullish trend.
RSI H1: Around 70 – indicating overbought conditions, but no divergence is visible; the bullish momentum is still strong.
Fibonacci: Applied from the swing low at 3,640 USD to the high at 3,760 USD; 38.2% (≈3,700) and 50% (≈3,700 – 3,710) levels act as strong support during pullbacks.
4. Suggested Trading Strategies
Buy on pullback: Watch for retracements to 3,730 – 3,740 USD. Place stop-loss below 3,720 USD.
Take profit: 3,760 – 3,770 USD for short-term targets; if price breaks 3,770 USD, extend target to 3,790 – 3,800 USD.
Trend continuation: If price dips to 3,710 – 3,720 USD but holds, consider holding long positions following the main trend.
Conclusion:
Gold is in a strong bullish phase, with buying pressure dominating. The safest approach is to buy on retracements while managing risk via stop-losses. Keep monitoring H1 charts for new bullish swings and adjust Fibonacci levels if the price breaks key resistance.

STEVEN XAUUSD – Buy Scenario Following the TrendTechnical Analysis
Gold continues to maintain a strong upward trend after breaking out of the previous accumulation zone. Currently, the price has tested the 3,742–3,744 area and is showing signs of pausing for a short-term correction.
The EMA200 H1 (3,662) is still sloping upwards, confirming that the main upward trend remains intact.
Fibonacci Retracement for the most recent rise:
The 0.786 level (3,738) coincides with the Volume Profile area – this is the first support for a short-term buy scenario.
The 0.618 level (3,707) aligns with the old resistance now turned support – a strong confluence, suitable for finding the main Buy point.
The RSI (14) is around 63–65, not yet in the overbought zone, indicating there is still room for growth.
Trading Scenario
Prioritize Buy following the trend
Entry 1: 3,738–3,740
SL: 3,730
TP: 3,750 – 3,760
Entry 2: 3,707–3,710
SL: 3,695
TP: 3,738 – 3,760 – 3,780
Price Levels to Watch
3,742–3,744: short-term resistance, may cause adjustments.
3,738–3,740: nearby support, suitable for quick Buy.
3,707–3,710: strong support, important Buy zone.
3,780–3,785: extended resistance, target of the upward trend.
This is a reference scenario, not an investment recommendation. Stay tuned for earlier analyses and scenarios in upcoming sessions.

Elliott Wave Analysis XAUUSD – September 23, 2025
Momentum
• D1: Momentum is in an uptrend, currently on the 3rd bullish candle of the cycle. This suggests we may see at least 2 more bullish daily candles from now.
• H4: Momentum has turned bearish, indicating the possibility of a corrective decline within today’s H4 structure.
• H1: Momentum has already turned bearish and is approaching oversold territory. This shows the current decline is weakening, and a short-term rebound is likely. However, if momentum turns back up and enters the overbought zone but fails to break the previous high, another bearish leg may follow.
________________________________________
Wave Structure
• D1: After completing wave 4 (yellow), price broke the previous high, confirming the continuation of the uptrend. Wave 5 (yellow) targets are projected at 3789.019 and 3887.117.
• H4: Wave 3 (yellow) has completed, followed by a corrective structure in a flat WXY pattern. Currently, price is rising steeply, suggesting wave 5 (yellow) is underway. With H4 momentum turning bearish, this pullback could correspond to wave 4 within the ongoing wave 5 (yellow).
• H1: Wave 3 (black) has formed with a complete 5-wave sequence (blue). Price is now in wave 4 (black), which could develop as a Zigzag, Flat, or Triangle correction.
Wave 4 (black) target zones:
1. 3729.447
2. 3709.732
3. 3696.422
Once H4 momentum turns bullish from the oversold region, the nearest level among these zones is the most likely end of wave 4.
________________________________________
Trading Plan
Buy limit strategy at support zones:
• Buy Zone 1: 3730 – 3727
o SL: 3719
o TP: 3760
• Buy Zone 2: 3710 – 3707
o SL: 3696
o TP: 3729
If price extends lower, additional buy opportunities can be considered around 3696 or deeper levels marked on the chart.
________________________________________
👉 The primary trend remains bullish, with wave 5 (yellow) in progress. The plan is to wait for wave 4 (black) to complete and then enter Buy positions in alignment with the larger uptrend.

Gold remains strong. 3800?In Tuesday's Asian session, gold hit around 3758 before retreating and currently fluctuating around 3743. While gold continues to hit new highs, the bullish trend remains. Monday's analysis suggests that after breaking through the resistance level of 3745, the upward trend will reach 3760, a level it has successfully reached.
The current market environment is characterized by geopolitical instability, rising risk aversion for gold, and the impact of the Federal Reserve's interest rate cuts. Therefore, gold is unlikely to experience a significant decline in the short term. Therefore, based on the strength of the trend, it is expected to rise to a high of 3780 in the short term. Further upward movement will only reach the 3800 level.
From a technical perspective, the Bollinger Bands on both the daily and 4-hour charts show strong unilateral strength, with continued upward breakthroughs and minimal corrections. In short-term trading, observe the changes in small cycles. The support point below the hourly line is around 3735. If the adjustment is too strong, it can be seen around 3710 below. In the short term, it is recommended to go long when it falls back to the 3735-3710 range.

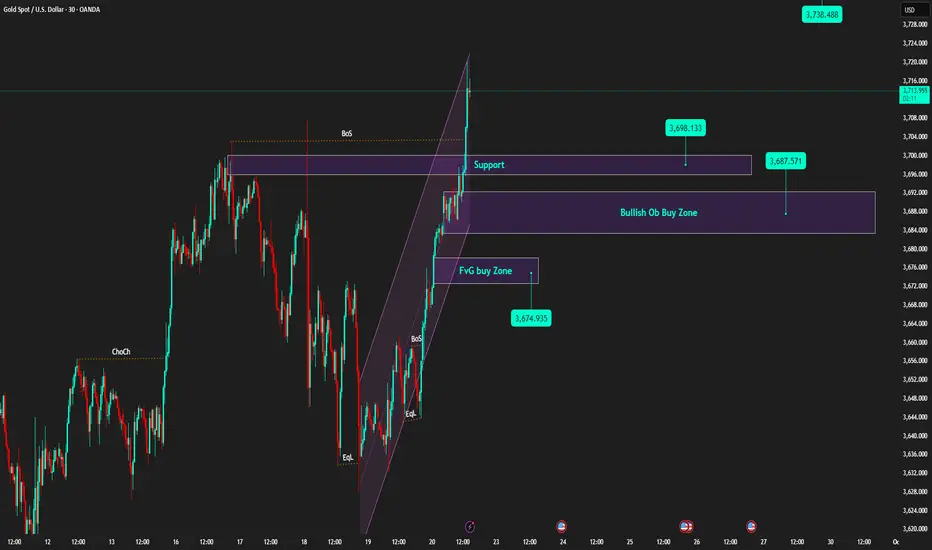
Weekly Candle High | Buy on Pullbacks to Support🟡 XAU/USD – 09/22 | Captain Vincent ⚓
🔎 Captain’s Log – Quick Overview
Last week, gold closed around 3,685, paving the way for further advances and the creation of a new ATH.
After the FED cut 25bps, Powell's 'brake' comments tempered the rise, but the overall trend remains bullish.
This morning, prices surged to 3,697.xx, currently adjusting slightly around 3,692 – 3,690 → a sensible strategy: wait for a pullback to continue Buying.
⏩ Captain’s Summary: The gold voyage still heads North, Buying remains the main choice, but wait for a pullback to board.
📈 Captain’s Chart – Technical Analysis
Golden Harbor (Support / Buy Zone):
Thin support: ~3,698 (recently broken old range peak).
OB Dock: 3,687 – 3,690.
FVG Dock: 3,672 – 3,676 (liquidity check on deep adjustments).
Storm Breaker (Resistance / Sell Zone):
3,714 – 3,720 (supply cluster / old ATH – likely to react).
Price Structure:
Continuous BoS series, price breaks out of short-term rising channel and creates higher highs → bullish remains the main trend.
🎯 Captain’s Map – Trading Plan (before US session)
✅ Buy (trend priority)
Buy Zone 1
Entry: 3,698 – 3,701
SL: 3,688
TP: 3,706 – 3,714 – 3,720+
Buy Zone 2 (OB)
Entry: 3,687 – 3,690
SL: 3,680
TP: 3,698 – 3,706 – 3,714 – 3,72x
Buy Zone 3 (FVG)
Entry: 3,672 – 3,676
SL: 3,664
TP: 3,687 – 3,706 – 3,714
⚡ Sell (only scalp when overbought)
Sell Zone (ATH test)
Entry: 3,740 – 3,738
SL: 3,750
TP: 3,730 – 3,720 – 3,695
Captain’s Note ⚓
“The new week opens with a high-closing candle, the gold ship continues its bullish course. Golden Harbor 🏝️ (3,690 – 3,672) is a safe anchorage for the crew to watch for Buys. Storm Breaker 🌊 (3,714 – 3,720) is a wave peak prone to gusts, suitable for Quick Boarding 🚤 short-term scalps. Before the US session, the sea might be choppy – hold the wheel tight and manage volume wisely.”
XAUUSD – Wolfe Waves Forming on H4 ChartHello Trader,
On the H4 chart, gold is forming a fairly classic Wolfe Waves pattern. The fifth wave has completed, and the price is entering the critical resistance zone of 3760 – 3770, which is also a potential Sell Zone. With the current structure, the preferred scenario is a short-term downward correction before the main trend resumes.
Technical Analysis
The price has touched the 2.618 Fibonacci Extension and reacted downward, indicating profit-taking pressure.
The MACD still shows strong previous buying momentum, but the histogram is starting to weaken, aligning with the potential for a corrective wave.
Area 3760 – 3770: a critical resistance zone, coinciding with the fifth wave of the Wolfe Waves.
Trading Scenario
Sell Order According to Wolfe Waves
Entry: 3760 – 3770
SL: 3782 (above resistance zone)
TP: 3710 -3660 -3610 – 3620 (key level Wolfe target)
Sell when price confirms below the trendline
Entry 3727-3730
sl 3735
tp 3715-3700-3686-3665
Short-term Buy Scalping
Entry: 3705 – 3708
SL: 3700
TP: 3720-3730 – 3745- 3766
Note: This is just a short-term retracement strategy, counter to the correction, so risk management is crucial.
Conclusion
Short-term: Prioritize observing reversal signals at 3760 – 3770 for a Sell.
Medium-term: Wait for Buy opportunities around 3564 – 3574 to align with the main trend.
The market is entering a distribution and correction phase, so patiently waiting for candle confirmations at key areas will be key to optimizing entry.
This is the Wolfe Waves scenario I propose for gold during this period. Feel free to refer and adjust according to your own strategy.
Follow me for the fastest updates when the price structure changes.

Gold: Will the Rally Continue or Is a Correction Ahead?Hello everyone,
Today gold staged a modest rebound, currently trading at $3,684.97/oz, up $16.63 (+0.45%) from the previous session. This is a notable sign after the metal experienced a prior correction.
The main driver comes from continued safe-haven demand as global economic uncertainty persists. Fair Value Gaps (FVG) formed during the recent rally are also acting as support, while the increase in trading volume highlights strong participation from large investors.
From a technical perspective, if gold holds above the $3,640 support area, the bullish trend is likely to be reinforced, with immediate targets at $3,700 and a further extension towards $3,750. Moreover, the Ichimoku cloud continues to support the upward bias as the price remains above it.
What do you think? Will gold push through $3,700–$3,750, or could it slip back into correction? Share your view below!

XAUUSD: A New Launchpad from the 3,700 ZoneHello traders, the gold market is entering an intense phase as U.S. economic data signals a slowdown. The Flash Manufacturing PMI (51.8 vs. 53.0 prior) and Flash Services PMI (53.8 vs. 54.5 prior) both declined, weakening the USD and providing momentum for gold, the ultimate safe-haven asset.
On the chart, XAUUSD continues to move within a steady ascending channel, with the 3,700 zone acting as a key support level. If this level holds, gold could push higher toward the 3,750 target, which stands as both a technical resistance and a strong psychological barrier.
However, the spotlight remains on Fed Chair Powell’s upcoming remarks. A dovish tone could fuel a breakout for gold, while a hawkish stance may trigger a short-term pullback before resuming the broader uptrend.
Bottom line: Gold has the advantage, and the big question is – does XAUUSD have enough momentum to conquer 3,750 and ignite a powerful new rally?

XAUUSD Breakout and Bullish Momentum👋Hello everyone, what do you think about OANDA:XAUUSD ?
Gold has just completed a Rounding Bottom pattern and successfully broken out of the resistance zone around 3,700 USD, turning it into a new support. Strong bullish momentum has emerged, and I expect the next push to target the 3,740 – 3,750 USD area. Short-term pullbacks are likely to serve only as stepping stones for buyers to strengthen their position and drive prices higher.
Do you agree with this outlook?💬 Share your thoughts below!
Wishing you successful trades!

Gold Futures — Extended After Bullish Surge, Watching 4 PullbackYesterday’s move pushed gold aggressively higher with almost no retrace, leaving a string of unfilled imbalances below. Price is now pressing into 3780 levels, just shy of the psychological 3800 handle.
Key Scenarios:
Bullish Continuation: If Asia/London hold above 3767, a squeeze into 3800–3810 is possible before any meaningful pullback.
Retracement Setup: A break under 3767 could trigger a retrace into 3743 → 3719 zone, aligning with prior resistance turned support.
Bigger Picture: Major 4H FVG remains untested below (around 3650–3660), which could act as a downside magnet later in the week.
Patience is key after such a vertical move — waiting to see if Tuesday gives us either continuation or that first retrace.
