GOLD ROUTE MAP UPDATEHey Everyone,
Quick follow up update on our 1H chart idea:
After completing both our Bullish target at 3352 and Bearish target at 3327, we now have a lock below 3327 which opened the swing range down towards 3304. We did get the drop, but not the full test of 3304 before price turned back up.
Right now, we are seeing a break back above 3327 and heading towards a retest of 3352 once again. This is in line with our ongoing plan to buy dips, but we must also keep in mind that the swing range remains open. This means any swings can still clear the gap left in that 3304 region before moving higher.
So, while we continue to buy dips, we need to be mindful that open swing ranges can extend moves in either direction.
We will keep the above in mind when taking buys from dips. Our updated levels and weighted levels will allow us to track the movement down and then catch bounces up.
We will continue to buy dips using our support levels taking 20 to 40 pips. As stated before each of our level structures give 20 to 40 pip bounces, which is enough for a nice entry and exit. If you back test the levels we shared every week for the past 24 months, you can see how effectively they were used to trade with or against short/mid term swings and trends.
The swing range give bigger bounces then our weighted levels that's the difference between weighted levels and swing ranges.
BULLISH TARGET
3352 - DONE
EMA5 CROSS AND LOCK ABOVE 3352 WILL OPEN THE FOLLOWING BULLISH TARGETS
3374
EMA5 CROSS AND LOCK ABOVE 3374 WILL OPEN THE FOLLOWING BULLISH TARGET
3398
EMA5 CROSS AND LOCK ABOVE 3398 WILL OPEN THE FOLLOWING BULLISH TARGET
3422
BEARISH TARGETS
3327 - DONE
EMA5 CROSS AND LOCK BELOW 3327 WILL OPEN THE SWING RANGE
3304
3281
As always, we will keep you all updated with regular updates throughout the week and how we manage the active ideas and setups. Thank you all for your likes, comments and follows, we really appreciate it!
Mr Gold
GoldViewFX
Xauusd(w)

Gold Trade the range until it breaks Short Setup Here is a quick video on the current range and what I see going into Friday with the Fed speaking .
I have given some key levels and reaction zones for what could be a volatile reaction in the gold price .
Tools used Fibonacci, Time price opportunity charts , Anchored vwap and bars pattern .
Any questions then please leave in the comments section below the chart

Gold (XAU/USD) Analysis – 1H ChartGold is currently trading around 3,341 USD and has shown a sharp intraday recovery from recent lows. The key resistance to watch is at 3,366 USD.
A rejection from this level could trigger a pullback toward 3,328 USD and potentially lower.
A confirmed breakout above 3,366 USD, however, could open the way for further bullish momentum in the short term.
For now, price action remains range-bound, and confirmation from either side is needed before a clear trend develops.

Gold Break Strong After Liquidity Sweep Next Target Before FOMCXAUUSD Update | Gold Breaks Strong After Liquidity Sweep – Next Target Before FOMC
Gold has made a powerful bullish comeback, exactly as anticipated in the MMFLOW Trading Plan. After clearing liquidity below, price quickly reversed and is now showing strong buying pressure. This move was no surprise, as the current market structure clearly supports a bullish breakout – and today we may even see price break above the H1 downtrend line ahead of the FOMC statement.
📈 Active Buy Entries from Plan:
✅ Buy 3314 → Now +340 PIPS
✅ Buy 3318 (DCA) → Now +300 PIPS
✅ Buy 3325 (DCA) → Now +230 PIPS
👉 For now, traders should stick with the bullish momentum. Short positions should only be considered if there is confirmed sell volume.
🔑 Key Trading Levels:
📍 3370 – Major level to watch for potential SELL setups.
Market reaction around this zone will be crucial, especially before FOMC, which is expected to bring high volatility.
⚡️ Trading Tip: Follow the trend, respect KeyLevels, and manage risk carefully. With FOMC around the corner, the market could deliver explosive opportunities.
✨ Once again – KeyLevels = Profits ✅

GOLD What Next? SELL!
My dear followers,
This is my opinion on the GOLD next move:
The asset is approaching an important pivot point 3346.3
Bias - Bearish
Safe Stop Loss - 3351.6
Technical Indicators: Supper Trend generates a clear short signal while Pivot Point HL is currently determining the overall Bearish trend of the market.
Goal - 3336.2
About Used Indicators:
For more efficient signals, super-trend is used in combination with other indicators like Pivot Points.
Disclosure: I am part of Trade Nation's Influencer program and receive a monthly fee for using their TradingView charts in my analysis.
———————————
WISH YOU ALL LUCK

XAUUSD Daily Plan | Gold Awaits FOMC – Liquidity Hunt in ActionXAUUSD Daily Plan | Gold Awaits FOMC – Liquidity Hunt in Action
Gold continued to move lower into liquidity during the late US session yesterday and reacted strongly at the BUY ZONE 3314 – 3316 (MMFLOW Entry), already giving more than +70 pips profit so far ✅.
On the M5 – M15 short-term structure, Gold is showing a mild recovery. However, for buyers to take control, price must break the resistance at 3320 – 3322 with strong volume. A confirmed breakout here can trigger further upside momentum and retest higher KeyLevels.
📈 Upside Targets (Intraday): 333x and 334x – these levels may act as Take-Profit zones for longs or potential SELL opportunities in line with the corrective channel on M30 – H1.
🔔 Fundamental Focus – FOMC Meeting Ahead
Today, the FOMC meeting will be the key event during the US session. Traders are waiting for clues about the Fed’s rate decision. Any dovish signals about a possible rate cut in September could be the catalyst for a strong Gold rally, breaking the current bearish channel.
👉 During the Asia – Europe sessions, intraday bias remains bullish towards 333x – 334x, where we will also watch for selling opportunities.
⚠️ During the US session, expect high volatility with FOMC, so manage risk carefully.
📉 Technical Trading Plan
🔹 BUY Scalp Setup
Entry: 3311 – 3309
SL: 3305
TP: 3315 → 3320 → 3325 → 3330 → 3340 → 3350 → 3360+
🔹 BUY Zone (FOMC Plan)
Entry: 3290 – 3288
SL: 3282
TP: 3295 → 3330 → 3335 → 3340 → 3350 → 3360 → 3370+
🔸 SELL Scalp Setup
Entry: 3342 – 3344
SL: 3348
TP: 3338 → 3332 → 3328 → 3324 → 3320
🔸 SELL Zone (FOMC Plan)
Entry: 3360 – 3362
SL: 3368
TP: 3355 → 3350 → 3345 → 3340 → 3330
⚠️ Trading Notes
FOMC will bring high-impact volatility – stay alert.
Stick to TP/SL discipline and risk management to protect capital.
Remember: KeyLevels = Profits ✅

XAUUSD Safe-Haven Flows Could Trigger Bullish Move in GoldI’m currently analyzing XAUUSD (Gold) 🪙✨, which appears to be significantly oversold 📉 and now trading into a prior bullish imbalance zone ⚖️ — an area where price could begin to rebalance. This level is particularly important, as it has acted as a key reaction point multiple times in the past 📊. With gold being overextended and signs of weakness emerging in the stock markets 📉📉, my view is that capital could rotate into safe-haven assets 🛡️, potentially fueling a gold rally 🚀. I’ll be watching for a bullish break of structure 🔍 as a signal to enter long. (Not financial advice.)

XAUUSD: Possible Bearish Point Of ViewGold in 4 Hours Time Frame has not moved significantly, currently we have not got ample volume to decide a clear trend. However, with the data that we have we can predict a possible ab=cd pattern where A to B is completed and we are yet to see c to d pattern.
If you like our work then please consider liking and commenting below.
Team Setupsfx

GOLD Technical Outlook: Bearish Below 3343, Eyeing 3332 → 3320Gold Futures Overview
Gold futures edged slightly higher but remain trapped in a tight consolidation range. The market is caught between conflicting macro signals — real yields, dollar strength, and uncertainty around the Fed’s next steps — while geopolitical risks continue to provide medium-term support.
Inflation remains the key risk factor: if it proves persistent, the Fed may be forced to maintain higher rates for longer, limiting gold’s upside.
🔹 Technical Outlook
In the short term, momentum is bearish as long as price trades below 3343, targeting 3332. A sustained break beneath this level would extend losses toward 3320 and 3313.
On the flip side, a confirmed 1H close above 3346 would shift momentum, opening the way toward 3355–3365, with potential extension to 3375.
Support: 3332, 3320, 3313
Resistance: 3355, 3365, 3375

XAUUSD – Waiting for the Market to Show Its Hand1. Yesterday’s Setup
In my yesterday’s analysis, I mentioned that while I am bullish overall, I could not ignore the pressure Gold was putting on the 3330 support. I also noted that for bulls to regain control, a break above 3345 was needed.
The market reacted with textbook precision: price rallied exactly to 3345 before breaking down through 3330, reaching a low of 3311. Currently, we see a normal rebound, but inside a bearish short-term structure.
________________________________________
2. The Key Question
Is this just a continuation of the downtrend, or a trap before the real bullish move?
________________________________________
3. Why I’m Not Convinced by the Bears
• The recent drop doesn’t look impulsive—it’s overlapped and choppy, more like a stepway accumulation phase.
• The pattern is contained inside a falling wedge, a structure that usually favors upside breaks.
• Bears had their chance yesterday, but the follow-through looks weak.
________________________________________
4. Trading Plan
At this moment, I’m out of the market, waiting for confirmation.
• Buy zone: around 3300–3305 for a potential re-entry long.
• Bullish confirmation: if price climbs back above yesterday’s high (3345), it would negate the breakdown and confirm a false break.
• With price now at 3322, I prefer to stay patient, watching how it reacts at the key levels.
________________________________________
5. Final Note 🚀
Gold is now right in the middle of my interest range. For me, it’s not about predicting—it’s about waiting for the market to reveal the next high-probability setup.
Disclosure: I am part of TradeNation's Influencer program and receive a monthly fee for using their TradingView charts in my analyses and educational articles.

Gold fluctuates and waits for news,rebound continues to be shortThe current gold daily line shows that the big negative line is weak, but we need to pay attention to the effectiveness of the 3310-3300 first-line support. As long as the price remains above this range, bulls still have a chance to gain momentum for a rebound. Conversely, a break below the 3300 mark could trigger a shift in bullish sentiment, potentially even leading to a test of the previous low of 3280.
The market momentum was relatively weak at the start of this week, with significant resistance at the highs near 3330-3340. Only by breaking through this short-term resistance range can bulls achieve temporary stability. In the short-term trend, the support zone around 3300 needs special attention. At the 4-hour level, the gold price has begun to fall below the previous terraced support band. We need to pay attention to whether there will be a slight rebound and then a downward trend.
Overall, gold is in a wide range of fluctuations in the short term. The current short position is relatively strong. Today's operation is mainly based on rebound shorting. If it touches 3330-3340 for the first time in the European and American markets, you can consider shorting, and the target is 3310-3300.

20/8/68 : XAUUSD ( US. Session )Using it from Europe Session until 7.00PM , I'll new analysis and update at 8.00PM
Resistance
3352-3358
3342-3347
3337
Support
3327
3316-3321
3306-3311

Gold Trading Strategy XAUUSD 20/8/2025Gold Trading Strategy XAUUSD 20/8/2025: Gold falls to lowest level since early this month, continues to be under pressure from potential talks, watching the FED minutes.
Fundamental news: Spot gold prices fell sharply, hitting their lowest intraday level since August 1. Gold prices fell as US President Donald Trump, Ukrainian President Zelensky and European leaders discussed potential talks with Russia. Safe-haven demand eased as security speculation in Kiev sparked optimism that the war could end.
Technical analysis: Gold prices broke out of a bullish pattern and formed a bearish channel on the H1 timeframe. Currently, the MA lines combined with the liquidity zone are the resistance zones of gold prices. However, gold prices can recover strongly when approaching the support area of 3300, the fluctuation range of gold prices today will be 3300 - 3350.
Important price zones today: 3335 - 3340, 3350 - 3355 and 3300 - 3305.
Today's trading trend: SELL.
Recommended orders:
Plan 1: SELL XAUUSD zone 3338 - 3340
SL 3343
TP 3335 - 3325 - 3315 - 3300.
Plan 2: SELL XAUUSD zone 3350 - 3352
SL 3355
TP 3347 - 3337 - 3327 - 3300.
Plan 3: BUY XAUUSD zone 3300 - 3302
SL 3297
TP 3305 - 3315 - 3335 - 3350.
Wish you a safe, successful and profitable trading day.🥰🥰🥰🥰🥰

Gold Trading Strategy XAUUSD 20/8/2025Gold Trading Strategy XAUUSD 20/8/2025:
Gold falls to lowest level since early this month, continues to be under pressure from potential talks, watching the FED minutes.
Fundamental news: Spot gold prices fell sharply, hitting their lowest intraday level since August 1. Gold prices fell as US President Donald Trump, Ukrainian President Zelensky and European leaders discussed potential talks with Russia. Safe-haven demand eased as security speculation in Kiev sparked optimism that the war could end.
Technical analysis: Gold prices broke out of a bullish pattern and formed a bearish channel on the H1 timeframe. Currently, the MA lines combined with the liquidity zone are the resistance zones of gold prices. However, gold prices can recover strongly when approaching the support area of 3300, the fluctuation range of gold prices today will be 3300 - 3350.
Important price zones today: 3335 - 3340, 3350 - 3355 and 3300 - 3305.
Today's trading trend: SELL.
Recommended orders:
Plan 1: SELL XAUUSD zone 3338 - 3340
SL 3343
TP 3335 - 3325 - 3315 - 3300.
Plan 2: SELL XAUUSD zone 3350 - 3352
SL 3355
TP 3347 - 3337 - 3327 - 3300.
Plan 3: BUY XAUUSD zone 3300 - 3302
SL 3297
TP 3305 - 3315 - 3335 - 3350.
Wish you a safe, successful and profitable trading day.🥰🥰🥰🥰🥰

Gold Trading Strategy XAUUSD 20/8/2025Gold Trading Strategy XAUUSD 20/8/2025: Gold falls to lowest level since early this month, continues to be under pressure from potential talks, watching the FED minutes.
Fundamental news: Spot gold prices fell sharply, hitting their lowest intraday level since August 1. Gold prices fell as US President Donald Trump, Ukrainian President Zelensky and European leaders discussed potential talks with Russia. Safe-haven demand eased as security speculation in Kiev sparked optimism that the war could end.
Technical analysis: Gold prices broke out of a bullish pattern and formed a bearish channel on the H1 timeframe. Currently, the MA lines combined with the liquidity zone are the resistance zones of gold prices. However, gold prices can recover strongly when approaching the support area of 3300, the fluctuation range of gold prices today will be 3300 - 3350.
Important price zones today: 3335 - 3340, 3350 - 3355 and 3300 - 3305.
Today's trading trend: SELL.
Recommended orders:
Plan 1: SELL XAUUSD zone 3338 - 3340
SL 3343
TP 3335 - 3325 - 3315 - 3300.
Plan 2: SELL XAUUSD zone 3350 - 3352
SL 3355
TP 3347 - 3337 - 3327 - 3300.
Plan 3: BUY XAUUSD zone 3300 - 3302
SL 3297
TP 3305 - 3315 - 3335 - 3350.
Wish you a safe, successful and profitable trading day.🥰🥰🥰🥰🥰

XAUUSD:Continue shorting at high levels to profit.Gold prices did not significantly break through their upper limits yesterday. The London market began its downward trend. New York markets extended their decline after opening, hitting a low of 3326. The meeting is almost over, but there has been no progress. The market has digested the expected gold price trend and is currently rebounding. However, if further news is released, gold prices may fall further. Consider selling between 3345 and 3340.

XAUUSD: Market Analysis and Strategy for August 20Gold Support and Resistance Update:
Daily Chart Resistance: 3358, Support: 3300
4-Hour Chart Resistance: 3345, Support: 3310
1-Hour Chart Resistance: 3327, Support: 3318.
The 4-Hour MACD is currently forming a low-level death cross with high volume, and the STO indicator indicates oversold conditions, indicating that gold prices are consolidating at low levels. A short-term rebound will not exceed the resistance level of the middle line and the moving average. Keep an eye on the resistance level of 3332-3341. However, the moving average resistance level will shift downwards over time. Currently, focus on the MA10 resistance level at 3327. On the daily chart, yesterday's decline continued the market's downward trend. On the 1-Hour Chart, prices are trading below the MA60/MA120 daily moving averages. The MACD is trading below the zero axis, indicating strong downward momentum and increasing bearish strength. The RSI is trading below the middle axis, and the KDJ pattern favors a continued decline, indicating a bearish short-term trend. During the NY session, focus on resistance at 3330/3345 and support at 3300/3292. My personal recommendation: sell on rallies!
SELL: near 3327
SELL: near 3343
BUY: near 3300

XAUUSD Analysis todayHello traders, this is a complete multiple timeframe analysis of this pair. We see could find significant trading opportunities as per analysis upon price action confirmation we may take this trade. Smash the like button if you find value in this analysis and drop a comment if you have any questions or let me know which pair to cover in my next analysis.

The dividing line 3330-3340 is not broken and rebounds to short#XAUUSD
After repeated fluctuations in the white session last night, gold fell below 3320 in the NY session and closed with weak fluctuations. 📊This morning, gold hit a low near 3311,📉 which aligns with our short-term outlook.✅
Judging from the monthly chart, the decline of gold in recent weeks has not been smooth, and each time it has been accompanied by a relatively strong rebound. 📈Today, there is a rebound near the 3311 line below. This point deserves our attention.👀 Previously, NFP achieved a big rise after breaking through here.🚀 At the same time, this point is also the area of the daily 100-day moving average.🐂
The first time it hits this point, it is bound to usher in a bullish resistance, and this is indeed the case.⚖️ Once it falls below this point, the next step will be the 3300 integer mark, 🥅and it may even hit the previous low, which is also the lower track of the daily line around 3280.↘️
Although the current market is relatively strong in short-term selling, we should not be overly bearish in the short term.↘️ After all, the impact of the news has not completely dissipated. The Federal Reserve will also release the meeting minutes in the evening NY session, 📰so we still need to be vigilant that the bulls may counterattack at any time.📈
In the short term, pay attention to the upper 3330-3340 bull-bear dividing line. If you encounter resistance and pressure in this range, you can consider shorting in batches with light positions, looking towards 3315-3300, and defending 3345. If the rebound effectively breaks through 3345, gold may fluctuate again.📊
🚀 SELL 3330-3340
🚀 TP 3315-3300

Latest Gold Price Update – Will the Downtrend Continue?Hello everyone, what do you think about OANDA:XAUUSD ? Will it go up or down?
As per our strategy from yesterday , gold has dropped sharply, currently trading around 3,315 USD, and down more than 300 pips from the previous session.
Gold continues to trade within a narrow range as traders await the next catalyst to drive price action, with the upcoming speech by Fed Chairman Jerome Powell being seen as a potential factor. Additionally, the recent recovery of the TVC:DXY index has also put some pressure on the strength of this precious metal.
From a technical perspective, gold has lost the 3,330 USD support level and remains capped below the descending trendline. The price is moving downward following the Dow Theory wave pattern. If favorable, the first profit-taking target (at the 1.618 level) at the round 3,300 USD mark may be pushed lower by the bears.
What do you think? How will gold move? Keep a close eye on the market to spot opportunities, and remember that trading with the trend is always a good strategy.
Good luck!

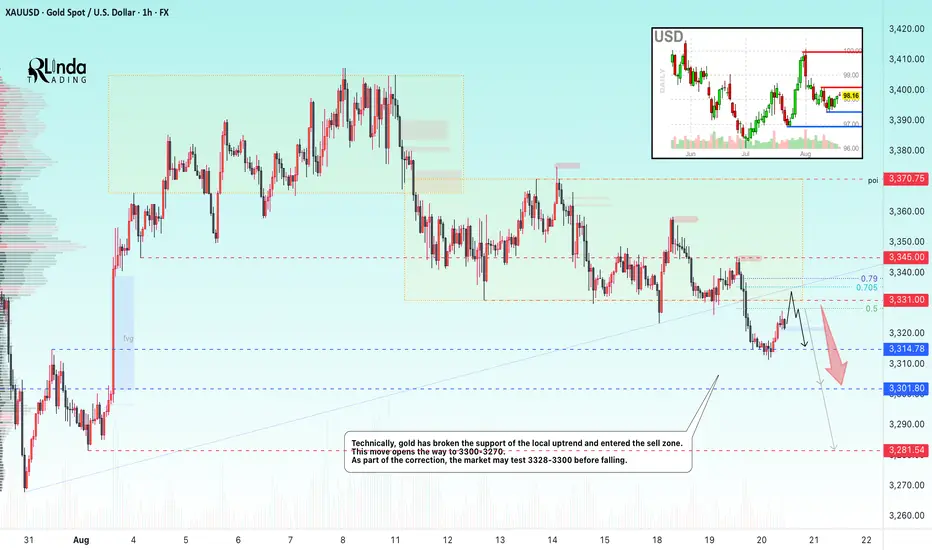
GOLD → Correction and retest of a previously broken level...FX:XAUUSD breaks through the support of the local consolidation “symmetrical triangle” and falls to a minimum of 3311...
Gold remained at a three-week low of around $3,300 in Asian trading on Wednesday as markets awaited the Fed minutes and Powell's speech in Jackson Hole. The dollar is strengthening on expectations that the Fed chair will reject the idea of aggressive rate cuts despite weak labor market and inflation data. The probability of a rate cut in September is estimated at 85%. Strong housing market data and news about negotiations on Ukraine provided additional support to the dollar. Powell's comments on Friday remain the key factor for gold, while current movements are mainly technical in nature.
Resistance levels: 3328, 3331, 3345
Support levels: 3314, 3300, 3328
Technically, a correction is forming after a bearish rally. As part of the correction, the price may test the zone of interest, which is represented by local resistance levels. Distribution could bring the price to 3300-3270.
Best regards, R. Linda!
Gold, silver and stock prices plummetThe simultaneous plunge in precious metals and tech stocks underscored the growing risk-off sentiment as investors adjust their positions ahead of key economic data and the Federal Reserve’s policy guidance. The sell-off in gold, often seen as a safe-haven asset, underscored concerns about the economic outlook and inflation. The reason was clearly cautious ahead of the Fed’s annual Jackson Hole meeting tomorrow, where investors are eagerly awaiting clues on the future direction of interest rates.
“In recent weeks, some U.S. economic data has surprised on the downside. While stronger-than-expected producer price index (PPI) numbers have reminded markets that inflationary pressures may still be looming from Donald Trump’s tariff policies. That data has temporarily tempered expectations for a series of rapid and aggressive rate cuts, but markets are still pricing in a 25 basis point cut at the September FOMC, although the path beyond that remains uncertain.”
