GOLD (XAU/USD) BULLISH CONTINUATION SETUP AFTER RETESTChart Overview
Timeframe: 1H (Hourly)
Current Price: Around $4,338
Trend: Strong bullish trend within a rising channel
Structure: Price broke slightly above the channel top and is now retesting the resistance level as potential new support
🔍 Detailed Analysis
1. Trend Structure
Gold has been moving in a strong upward channel, showing consistent higher highs and higher lows.
The breakout above the resistance channel suggests bullish continuation, but a short-term pullback or retest is expected before another leg up.
2. Key Levels
Resistance Level: Around $4,350 – $4,370, now acting as support.
Entry Zone: Around $4,313 – $4,338 (highlighted region).
Stop Loss: Below $4,274 – $4,268 zone to protect against false breakouts.
Target Point: Around $4,509 – $4,513, which aligns with the projected move from the breakout zone.
💹 Trade Plan (Bullish Setup)
Entry: Wait for price to test and hold above $4,313 (confirmation candle or bullish rejection).
Stop Loss: $4,274 – $4,268 (below recent swing low).
Take Profit: $4,509 – $4,513.
Risk/Reward Ratio: Roughly 1:4, which is excellent for a continuation trade.
⚠️ Market Sentiment Notes
If gold fails to hold above $4,313, the move could turn into a deeper correction toward $4,250 – $4,200.
Watch for strong bullish candles near the entry zone for confirmation.
The setup remains bullish-biased, but patience for a clean entry is key.
✅ Summary:
Bias: Bullish
Setup Type: Pullback continuation
Buy Zone: $4,313 – $4,338
Target: $4,509 – $4,513
Stop: $4,268
Xauusd(w)

XAUUSD Analysis todayHello traders, this is a complete multiple timeframe analysis of this pair. We see could find significant trading opportunities as per analysis upon price action confirmation we may take this trade. Smash the like button if you find value in this analysis and drop a comment if you have any questions or let me know which pair to cover in my next analysis.

DeGRAM | GOLD held the support line📊 Technical Analysis
● XAU/USD continues to respect the ascending support line, confirming an active short-term uptrend. Price rebounded from 4,308 support, forming a higher low structure that suggests momentum preservation.
● Immediate resistance lies at 4,376, where a breakout could extend the bullish leg if the current consolidation near 4,330 holds.
💡 Fundamental Analysis
● Gold remains supported by softer U.S. inflation expectations and rising geopolitical risk, keeping investor demand intact.
✨ Summary
● Long bias above 4,308; objectives 4,376–4,380. Trendline strength and supportive fundamentals signal continued short-term upside.
-------------------
Share your opinion in the comments and support the idea with a like. Thanks for your support!

NZD/CHF Setup – 94% of Retail Long While Institutions Sell Hard🔹 COT (Commitment of Traders)
New Zealand Dollar (NZD):
Non-commercial longs: 12,295 (+3,044)
Non-commercial shorts: 33,415 (+6,160)
→ Institutions increased exposure on both sides, but short positions rose more aggressively, maintaining a net short stance and signaling structural weakness in the NZD.
Swiss Franc (CHF):
Non-commercial longs: 8,227 (+1,992)
Non-commercial shorts: 31,245 (−1,030)
→ A solid reduction in shorts and rise in longs, indicating a renewed bullish interest in the Swiss franc.
📊 Combined Interpretation:
Institutional flow clearly favors CHF strength and NZD weakness, confirming a bearish bias on NZD/CHF.
🔹 FX Sentiment (Retail Positioning)
94% long / 6% short
📌 Retail traders are heavily long, a strong contrarian bearish signal.
This imbalance highlights the risk of further downside, perfectly aligned with the institutional view.
🔹 Seasonality
NZD: October shows mildly positive performance over 5–10 years, but weakness across 15–20 years → a short-term neutral-to-bullish but uncertain context.
CHF: October is historically positive across all time horizons (5–20 years), with average gains between +0.5% and +1.2%, confirming a seasonal bullish bias for CHF.
📌 Seasonal Conclusion: Seasonality supports a bearish outlook for NZD/CHF, consistent with both the COT and retail sentiment data.
🔹 Price Action
The pair continues to trade within a well-defined descending channel.
Clear bearish breakout from the 0.4660–0.4700 supply zone, followed by a strong daily close lower.
Currently retracing toward 0.4620–0.4640, an area where fresh selling pressure may emerge.
RSI remains neutral with no bullish divergence, confirming sustained downside momentum.
Key supports: 0.4550 (TP1), 0.4500 (TP2).
Resistance: 0.4660 (invalidation above 0.4680).
🎯 Base Scenario: A short-term correction toward 0.4630–0.4640 followed by renewed bearish continuation toward 0.4500.
❌ Invalidation: Daily close above 0.4680.

GOLD Set To Grow! BUY!
My dear subscribers,
GOLD looks like it will make a good move, and here are the details:
The market is trading on 4307.6 pivot level.
Bias - Bullish
My Stop Loss - 4291.5
Technical Indicators: Both Super Trend & Pivot HL indicate a highly probable Bullish continuation.
Target - 4335.3
About Used Indicators:
The average true range (ATR) plays an important role in 'Supertrend' as the indicator uses ATR to calculate its value. The ATR indicator signals the degree of price volatility.
Disclosure: I am part of Trade Nation's Influencer program and receive a monthly fee for using their TradingView charts in my analysis.
———————————
WISH YOU ALL LUCK

Gold's Historic Rally: Why It HappenedGold approaches $4,500 per ounce for the first time in history. Up more than 50% in less than a year. Everyone's asking the same question: Is this a historic breakout, or the setup for a massive crash?
The answer requires looking at three things: what brought us here, where we are technically, and what could go wrong.
PART 1: THE MACRO STORY
Gold doesn't just rally because people are "scared." It rallies because of structural shifts in how the world's largest institutions view money, risk, and trust.
Central Banks Are Buying Gold at Record Pace
Here's a number that should get your attention: Central banks bought 1,045 tons of gold in 2024. That's the second-highest annual total on record.
In 2025, the buying hasn't slowed down. Poland alone has accumulated 67 tons year-to-date. Turkey, India, Kazakhstan, and others are following suit.
But here's what's really happening: This isn't about inflation hedging. If it were, Western central banks (US, Europe) would be buying too. They're not. Instead, emerging market central banks are diversifying away from the dollar.
Why? Because they watched what happened in 2022 when the US froze Russian reserves. When you hold dollar-denominated assets, they can be weaponized. Gold can't be sanctioned. Gold can't be frozen.
Central banks don't panic sell on a 5% dip. When they buy, they hold. This creates a structural price floor. Every pullback gets accumulated.
What this means: Central bank buying is the foundation of this rally, not a temporary catalyst.
The Federal Reserve is Cutting Interest Rates
According to the CME FedWatch Tool, there is a level of certainty that the Fed would cut rates in October 2025, with markets pricing in another cut in December this year.
When interest rates fall, something important happens to gold: its "opportunity cost" decreases.
Here's the simple version: Gold pays no interest. So when bonds also pay almost nothing (after inflation), holding gold looks pretty reasonable. But when real yields are high, bonds look better and gold looks worse.
Right now, the market is pricing in lower real yields ahead. That's bullish for gold. If the Fed doesn't cut as much as the market expects, that changes everything.
What this means: Rate cuts fuel the rally.
Geopolitical Instability & Currency Debasement
Global tensions remain elevated: Middle East instability, US-China friction, and the ongoing Russia-Ukraine conflict. But that's not the real driver here.
The real driver is the loss of faith in government money.
Gold is at an all-time high, not just in US dollars. It's also hitting all-time highs in euros, yen, and yuan. This isn't a dollar story. This is a global reassessment of what "money" actually means.
Meanwhile, the US national debt is over $35 trillion. Debt-to-GDP is at World War II levels. Other countries (Japan, Europe) are in similar situations, printing money and running massive deficits.
When governments print excessively, investors need a hedge. Gold can't be printed.
What this means: As long as deficits remain high and geopolitical chaos persists, gold has structural demand that goes beyond cycles.
The Bottom Line
Three powerful forces are all pushing in the same direction:
Central banks structurally accumulating gold (de-dollarization)
The Fed cutting rates (lower real yields = gold support)
Global monetary instability (currency debasement = safe-haven bid)
This combination hasn't existed in most traders' lifetimes. That's why this rally feels different. And why it's lasted this long.

It is not a reversal callback correction to continue to buyGold gapped up at the opening, touched 4379 and then plunged nearly $100 before rebounding quickly. The fluctuations in the Asian session alone are so drastic. In addition, today is Friday and there is a risk of market closure, so intraday trading needs to be more cautious.
From the news perspective, the expectation of a Fed rate cut provides liquidity support, Sino-US trade tensions and geopolitical risks stimulate safe-haven demand, and the weakening of the US dollar and economic uncertainty amplify the appeal of gold. Many investors continue to increase their holdings of safe-haven assets in a complex macroeconomic context, providing solid and strong support for the rise of gold.
Although short-term prices fluctuate frequently, they have not fallen below the daily MA5 and MA10 moving averages. Therefore, it should not be regarded as a trend reversal, but a market shakeout. Therefore, we maintain a trading strategy that is mainly bullish and supplemented by short selling.
From a fundamental perspective, multiple rebound attempts failed to break through, making the upper 4380-4400 range a short-term resistance range. The short-term trend has the tendency to form an M top, so I will give several long trading opportunities during the day.
First of all, we should pay attention to the first support formed by 4315-4305 below, which is also the 61.8% retracement position of gold. If it repeatedly circles this position in the short term without breaking, we can try to go long on gold. For the second chance, I would give the support level of 4290-4280 below, which is near the trend suppression and the 50% dividing line, as well as the 4H MA10 moving average. I think we can try to go long on gold again within this range. The last chance I would give is around 4200, the starting point of this round of rise. Even if gold retaliates and falls, we can still maintain good trading opportunities.
During the day, we can go long on gold in batches according to the strength of gold's retracement.
OANDA:XAUUSD
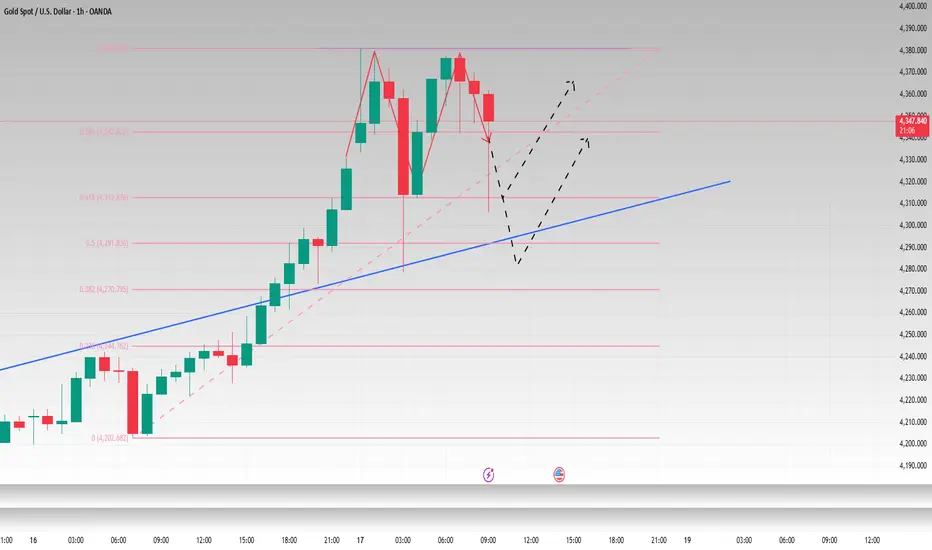
ElDoradoFx PREMIUM – GOLD ANALYSIS (17/10/2025, US SESSION)Prepared by: ElDoradoFx Premium 2.0 Analyst Team
⸻
🧭 Market Overview
Gold has entered a corrective phase after failing to break and sustain above 4,379, the current weekly high. During the London session, price fell sharply to 4,305–4,313, testing the ascending trendline support and the Fibonacci Golden Zone from the latest bullish swing.
The daily chart remains bullish in structure, but intraday momentum has shifted bearish short-term, suggesting a potential retest deeper into support before a continuation to the upside.
⸻
📊 Technical Breakdown
1️⃣ Daily Chart (D1)
• Structure: Uptrend intact — higher highs & higher lows.
• RSI: 85.0 → Overbought, signaling possible cooling phase.
• Support Zone: 4,290–4,273 (near 38.2% retracement).
• Bias: Medium-term bullish; short-term correction.
2️⃣ 1-Hour Chart (H1)
• Price broke minor structure at 4,336 and tapped the lower channel.
• Currently consolidating around 4,313, forming potential base support.
• 50EMA flattening; momentum slowing.
• Bias: Neutral to bearish short-term until 4,336 is reclaimed.
3️⃣ 15M–5M Chart
• MACD bearish, histogram red — short-term selling pressure.
• RSI rebounding from oversold (33) — early signs of intraday support reaction.
• Liquidity below 4,300 remains uncollected — could attract a final sweep before reversal.
⸻
📐 FIBONACCI ANALYSIS (Last Swing: 4,273 → 4,379)
Level Price Confluence
38.2% 4,336 EMA50 / previous structure
50.0% 4,326 Key mid-range
61.8% 4,318 Trendline & intraday liquidity
📊 Fibonacci Golden Zone → 4,318–4,336
This remains the key reaction zone for re-entry confirmation or next leg down if broken.
⸻
🎯 HIGH-PROBABILITY TRADE SCENARIOS
✅ BUY SETUP (Primary Bias – After Confirmation)
• Break & Retest: Above 4,336, confirming buyers reclaim control.
• Retest Zone: 4,330–4,336
• Targets:
• TP1 → 4,350
• TP2 → 4,363
• TP3 → 4,379
• Stop-Loss: Below 4,318
(Re-entry within Golden Zone only if we see bullish engulfing / strong volume candle.)
⸻
⚠️ SELL SETUP (Active Short-Term Bias)
• Break & Retest: Below 4,305, confirming downside continuation.
• Retest Zone: 4,305–4,313
• Targets:
• TP1 → 4,290
• TP2 → 4,273
• TP3 → 4,250
• Stop-Loss: Above 4,336
(This would confirm Golden Zone break and shift momentum bearish toward 4,273.)
⸻
🚀 BREAKOUT BUY (Aggressive)
• Trigger: Break & retest above 4,379 (previous high).
• Retest Zone: 4,372–4,379
• Targets: 4,395 → 4,410 → 4,428
• Stop-Loss: Below 4,355
⸻
🕐 FUNDAMENTAL WATCH
• DXY: Hovering around 104.90 — slight rebound causing gold weakness.
• Bond Yields: Stable; no risk-off catalyst for new gold strength yet.
• Upcoming US Data: Michigan Consumer Sentiment — could add volatility later.
• Institutional Flow: Still net-long on gold, suggesting corrections are accumulation phases.
⸻
⚙️ KEY TECHNICAL LEVELS
Type Levels
Resistance 4,336 / 4,363 / 4,379
Support 4,318 / 4,305 / 4,273
Trendline Support 4,305 (critical for maintaining bullish structure)
⸻
🧾 Analyst Summary
Gold remains bullish overall, but short-term momentum has shifted bearish following repeated rejections from 4,379.
Current retracement into 4,318–4,305 is a critical decision zone — if this holds, expect recovery toward 4,350–4,379.
However, a clean break below 4,305 confirms a deeper pullback toward 4,273–4,250 before the next major wave higher.
⸻
📈 Bias: Bullish above 4,318 – Watch for re-entry confirmation.
📉 Alternative Bias: Bearish below 4,305 – Short toward 4,273.

GOLD / XAUUSD – DAILY PLAN (Oct 17, 2025)🧭 MARKET CONTEXT
Main timeframe: M30 / H1
Current structure remains bullish, forming clear HH – HL sequences.
After a strong rally, price is now in a retracement phase toward a nearby demand zone aligned with the ascending trendline.
No sign of structure break yet (no BOS below the previous HL).
📈 PRIMARY SCENARIO (BUY SETUP)
➤ Entry Zone 1:
BUY GOLD 4280 – 4278
Stop Loss: 4275
Target 1: 4335
Target 2: 4350 (new HH)
Reason: This is a Bullish Order Block (OB) and BOS retest zone, aligned with the rising trendline.
Expecting a strong bullish reaction (rejection candle or engulfing bar) before triggering the buy limit.
➤ Entry Zone 2 (CP Setup – Confirmation Point)
BUY 4247 – 4245
Stop Loss: 4239
Target: 4300 / 4330 / 4350
Reason: This is the final demand zone near the main trendline, confluence of prior BOS + SSS (Structure Shift Support).
If price breaks below 4280 without reaction, patiently wait for confirmation around CP zone.
⚠️ ALTERNATIVE SCENARIO (STRUCTURE FAILURE)
If price closes below 4235 on M30, the bullish structure is invalidated.
→ The buy plan is canceled — wait for a pullback sell setup from 4280–4300 resistance.
If the buy stop loss is hit at 4239, monitor 4200 zone as the next H4 demand area.

DeGRAM | GOLD formed a bullish takeover📊 Technical Analysis
● XAU/USD shows a bullish takeover after rebounding from the support line near 4,219, confirming buyers’ control in the short-term structure.
● Price is now trading within an ascending channel, aiming toward the 4,240–4,250 resistance area, with intraday pullbacks likely forming higher lows.
💡 Fundamental Analysis
● Gold gains support from softer U.S. yields and cautious Fed remarks, improving sentiment for safe-haven assets.
✨ Summary
● Long bias above 4,219; objectives 4,240–4,250. Strong bullish candle and favorable macro backdrop confirm short-term upward momentum.
-------------------
Share your opinion in the comments and support the idea with a like. Thanks for your support!

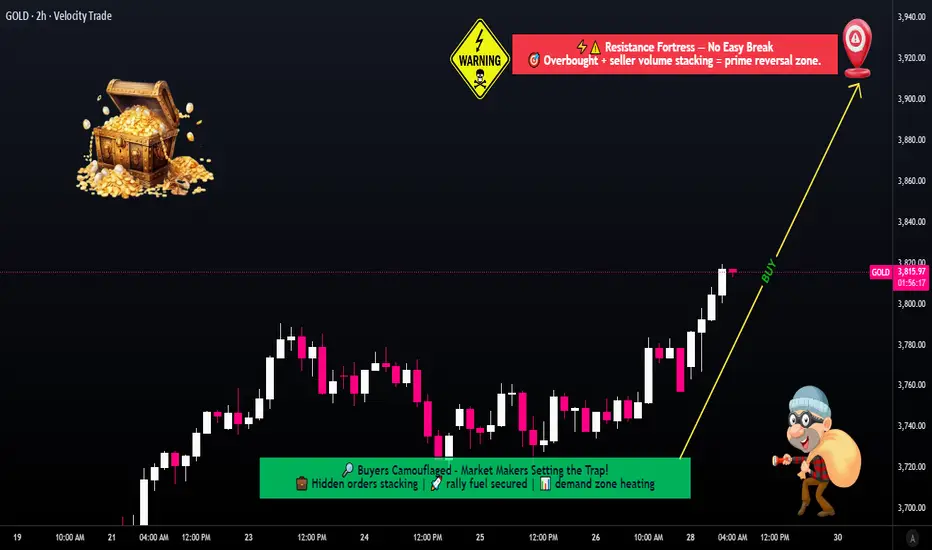
XAU/USD Metals Outlook: Bullish Path with Layered Buy Entry Plan🔥 XAU/USD: Thief’s Gold Heist Strategy Map (Swing/Day Trade) 💰
🎯 Asset: XAU/USD (Gold vs. U.S. Dollar) — The Shiny Metal’s Wealth Hunt!📈
Market: Metals Market
🏆 Strategy Vibe: Bullish Bandit Plan with a Thief-Style Layering Twist! 😎
🕵️♂️ The Thief’s Bullish Plan: Steal the Gold!
We’re diving into the XAU/USD market with a bullish swing/day trade setup using a slick Thief Layering Strategy. This involves stacking multiple buy limit orders to catch the price at key levels. No boring single entries here — we’re building a multi-layered trap to snag those pips! 🪤
📊 Key Setup Details
🎯 Entry Levels:
Deploy the Thief Layering Strategy with multiple buy limit orders at:
💰 3760
💰 3780
💰 3800
Pro Tip: Feel free to add more layers based on your risk appetite! Stack those limits like a master thief planning a heist. 😏
🛑 Stop Loss:
Thief’s SL set at 3720.
Note: Dear Ladies & Gentlemen (Thief OG’s), this SL is my take — you’re the boss of your trades! Set your stop loss based on your risk tolerance. Trade smart, steal smarter! 💡
🎉 Take Profit Target:
Aim for the Electric Shop High Voltage Trap at 3920. This zone screams strong resistance, overbought signals, and a potential trap for the unprepared. Escape with your profits before the market zaps you! ⚡️
Note: Thief OG’s, this TP is my suggestion. Grab your profits at your own pace and risk level — make it rain when you’re ready! 💸
🔗 Related Pairs to Watch (Dollar-Based Correlations)
Keep an eye on these USD-based pairs for market synergy and correlation:
FX:USDJPY : A stronger USD could pressure gold prices, so watch for inverse moves. If USD/JPY spikes, XAU/USD might dip. 📉
OANDA:USDCHF : Another safe-haven pair. If CHF strengthens, it could signal risk-off vibes impacting gold. 👀
TVC:DXY (U.S. Dollar Index): Gold often moves inversely to the dollar. A rising DXY could cap XAU/USD’s upside — stay sharp! 🧠
OANDA:XAGUSD (Silver): Gold’s shiny cousin often follows XAU/USD’s lead. Check for confirmation in silver’s price action. ✨
Why Watch These? Correlations help you spot market sentiment. If USD strengthens across pairs, gold’s bullish run might face resistance. Use these as your Thief’s Radar to time your entries! 🕵️♀️
🔑 Key Points of the Thief Strategy
Layering Entries: Multiple buy limits spread risk and increase chances of catching a favorable entry. Think of it as setting multiple traps for the price! 🪤
Risk Management: The suggested SL at 3720 keeps losses tight, but adjust based on your account size and risk tolerance.
Resistance Watch: The 3920 zone is a high-voltage trap with overbought signals. Secure profits early to avoid getting caught in a reversal. ⚡️
Market Context: Gold thrives in uncertainty, so keep an eye on global events, Fed news, or inflation data that could spark volatility. 📡
⚠️ Disclaimer
This is a Thief-Style Trading Strategy crafted for fun and educational purposes. Trading involves risks, and past performance doesn’t guarantee future results. Always conduct your own analysis and trade at your own risk. Stay sneaky, stay safe! 😎
✨ If you find value in my analysis, a 👍 and 🚀 boost is much appreciated — it helps me share more setups with the community!
#️⃣ #XAUUSD #GoldTrading #ThiefStrategy #SwingTrading #DayTrading #BullishSetup #ForexTrading #TradingView
Gold Retests All-Time Highs – Bulls Still in Full Control📊 Market Overview
Gold experienced a sharp intraday drop during the Asian session, testing the 4,280 – 4,279 USD zone before quickly recovering. Despite short-term volatility, it continues to close the week in green for the ninth consecutive time — confirming the strength of the ongoing bullish cycle.
The broader fundamentals remain supportive:
💥 Persistent geopolitical tensions keep safe-haven demand high.
⚖️ US–China trade uncertainty and the risk of a prolonged US government shutdown weaken risk appetite.
💵 Fed rate-cut expectations and USD softness continue to favor gold upside.
In short — Smart Money remains positioned long, and every dip still looks like a liquidity grab for re-accumulation.
🧠 Technical Structure (MMFLOW View)
On the M30 timeframe, gold continues to respect an ascending channel, currently forming a liquidity trap and breakout setup around 4,280 – 4,330.
Price action suggests gold may be completing a short-term corrective wave (B) before resuming the larger bullish impulse.
The structure remains technically bullish, with all pullbacks showing strong rejections from demand zones.
🔑 Key Levels to Watch
🟢 BUY ZONE (Primary Setup)
Zone: 4,230 – 4,228
SL: 4,220
TP: 4,240 – 4,250 – 4,260 – 4,270 – ???
🔵 CP ZONE BUY (Secondary Support)
Zone: 4,284 – 4,285
SL: 4,275
TP: 4,300 – 4,315 – 4,330 – 4,340 – ???
🔴 SCALP SELL (Liquidity Reaction Zone)
Zone: 4,438 – 4,440
SL: 4,448
TP: 4,420 – 4,410 – 4,390 – ???
⚙️ MMFLOW Scenarios
1️⃣ Primary Bullish Scenario:
If gold holds above 4,280 – 4,284, expect continuation toward 4,380 – 4,438 (Liquidity Sell Zone).
The 4,284 level is the key control point where Smart Money may look to re-enter long positions.
2️⃣ Alternative Correction Scenario:
A clean break below 4,280 could drive price toward 4,249 – 4,243 (CP Buy Zone) before another bullish push higher.
This structure still aligns with a Healthy Correction Pattern within a broader uptrend.
⚡ MMFLOW Insights
Gold remains in a mid-term expansion phase, with both macro and technical alignment favoring continued upside.
The 4,280 – 4,330 range acts as a Smart Money accumulation zone, preparing for a liquidity sweep higher.
Medium-term upside target: 4,438 – 4,445 USD/oz (Liquidity Sell Zone).
⚠️ Trading Notes
✅ Always use a protective Stop Loss — volatility can spike during liquidity hunts.
✅ Avoid chasing entries at highs; wait for reaction around BUY ZONES.
✅ Focus on liquidity confluence zones (Fibo + CP Zone + Order Block) for the highest-probability setups.
🧭 Quick Summary
Gold remains resilient despite early-session volatility.
Watch BUY ZONES at 4,230 – 4,228 and 4,284 – 4,285 for possible long re-entries.
Short-term target: 4,380 – 4,438 USD/oz.
Bias: Bullish – Buy the dips, not the breakouts.

Stop!Loss|Market View: NZDUSD🙌 Stop!Loss team welcomes you❗️
In this post, we're going to talk about the near-term outlook for the NZDUSD currency pair☝️
Potential trade setup:
🔔Entry level: 0.57168
💰TP: 0.56450
⛔️SL: 0.57780
"Market View" - a brief analysis of trading instruments, covering the most important aspects of the FOREX market.
👇 In the comments 👇 you can type the trading instrument you'd like to analyze, and we'll talk about it in our next posts.
💬 Description: The New Zealand dollar's situation is similar to that of the Australian dollar, with both short- and medium-term USD strengthening expected. The focus remains on the 0.57550 level, from which, following a recent downward breakout, a further decline to 0.56000 is expected in the near future. If the price retests 0.57550 or accumulates near this level again, potential sell trades will likely have to be postponed.
Thanks for your support 🚀
Profits for all ✅
❗️ Updates on this idea can be found below 👇

XAUUSD NEXT POSSIBLE MOVE Gold is holding firmly above a major support zone, showing strong signs of buyer dominance and renewed momentum after a corrective phase. Price action indicates clear accumulation, with multiple rejections from lower levels — confirming that buyers are actively defending this zone.
If the market continues to sustain above this support and breaks minor resistance levels, it could trigger a strong bullish continuation.
Volume and momentum indicators also align with a shift toward buying strength, suggesting that the next impulsive leg to the upside may already be building.
As long as Gold remains above this key support area, the structure and sentiment stay firmly bullish, and any dips toward support could present strong buying opportunities.

XAUUSD: $4,400 Target Next! Gold Bull Run ContinuesKey Observations:
Massive Uptrend: The chart clearly displays a strong, multi-day uptrend, marked by a series of high-momentum green (bullish) candlesticks.
Recent Price Action: Price has recently surged, followed by a minor retracement (the most recent red candle), but remains near the top of the move. This indicates the primary momentum is still firmly to the upside.
Key Support/Demand Zones:Immediate Demand (Yellow Box): A small yellow box is marked around the $\$4,250$ area. This represents a very recent, short-term support or 'flip' zone where price broke out and could potentially retest before moving higher.Deeper Demand (Blue Box): A larger blue box (around $\$4,130$ to $\$4,190$) represents a more significant, underlying demand zone.
Projected Price Action: The hand-drawn path suggests a direct continuation with potentially only a minor dip:
The path shows a small pullback toward the $\$4,300$ area (not explicitly marked by a zone) or a brief sideways move.
The black arrow points to an anticipated strong push up to the final target, resuming the dominant uptrend without necessarily hitting the marked yellow or blue zones.
Target: A dotted blue line at $\$4,400.69$ is the clear final target for this trade setup.

Gold Price Outlook – Trade Setup (XAU/USD)📊 Technical Structure
OANDA:XAUUSD Gold surged to a fresh record near $4,380 before retracing lower, now consolidating around $4,320–$4,330. The support zone sits at $4,301–$4,290, while the resistance zone is located at $4,368–$4,377. Price action shows a sharp pullback from highs, but bulls still hold ground above the key support. A rebound scenario could see a push back toward the resistance, while a decisive break below $4,285 would invalidate the bullish setup.
🎯 Trade Setup (Bullish Scenario)
Entry: $4,301–$4,290 (near consolidation & above support)
Stop Loss: $4,285
Take Profit 1: $4,350
Take Profit 2: $4,368
Take Profit 3: $4,377
Risk/Reward: ≈ 1 : 4.91
🗝️ Key Technical Levels
Resistance: $4,350 / $4,368 / $4,377
Support: $4,301 / $4,290
🌍 Macro Background
Gold remains supported by Fed rate cut bets, US-China trade frictions, and prolonged US government shutdown fears.
Fed Policy: Powell and Waller signalled two more cuts this year, reducing the opportunity cost of holding gold.
US-China Tensions: Additional port fees and tariff threats fuel safe-haven demand.
US Government Shutdown: Entering its third week, weighing on the USD and indirectly boosting gold.
Geopolitics: Some easing in Ukraine risks could cap upside, but macro drivers remain gold-positive.
📌 Trade Summary
Gold remains in a strong uptrend despite intraday corrections. A long setup near $4,301–$4,290 with stops under $4,285 offers a favourable risk-reward toward $4,368–$4,377. Safe-haven demand and dovish Fed expectations continue to support bullish momentum.
⚠️ Disclaimer
This analysis is for reference only and does not constitute trading advice. Trading involves significant risk, and proper risk management is essential.

GOLD Actual Bullish Trend Analysis WAVE ANALYSIS / Gold reached the final zone of the substructure in the 4.23 projection, with this the wave 3 (W3) is completed and we should see a correction in the price when the bearish breakout is confirmed.

Gold Bullish Continuation Toward 4,300 TargetTrend Direction: The overall structure is clearly bullish, with price continuing to rise after breaking previous resistance levels.
Price Action: After a strong impulsive move upward, a small corrective phase (pullback) is visible — represented by the zigzag arrow — suggesting a healthy retracement before continuation.
Key Zone: The highlighted blue-green box marks a demand or fair value gap (FVG) region where buyers previously entered strongly, likely acting as a support area for future pullbacks.
Current Price: Around $4,195.84, maintaining bullish momentum.
Target: The projection line points toward a target zone near $4,300, indicating the next resistance or profit-taking level.
Overall Sentiment: Bullish continuation toward the upper target, provided the price sustains above the previous support zone around $4,100–$4,000.

XAUUSD: Unstoppable Surge - Is Capital Leaving Bitcoin for Gold?XAUUSD: Unstoppable Surge - Is Capital Leaving Bitcoin for Gold?
Hello traders community,
XAUUSD (Gold) is showcasing extraordinary strength, continuously breaking records and reaching new heights. The upward momentum seems to have no end, despite technical indicators entering the "overbought" zone. While Gold shines, the Crypto market is witnessing selling pressure, indicating a clear shift of safe-haven capital.
This analysis will delve into the factors driving the market and outline a detailed trading strategy for this tidal wave.
📰 Macro Analysis & Capital Flow
The market is being driven by a very clear narrative: Capital is seeking the ultimate safe haven.
Gold Ascends, Bitcoin Challenges: The contrasting movements between the two assets considered "digital gold" and "physical gold" are the most notable highlights. While XAUUSD continuously peaks, Bitcoin has plummeted sharply after hitting a historical high, currently struggling at the critical support level of $107,000. If this level is breached, a new wave of selling could be triggered, further driving capital flow towards Gold.
"Doping Boost" from the US Economy: Gold's strength is bolstered by the weakening USD. Factors such as the US government facing a potential shutdown and particularly the market betting that the Fed will continue to cut interest rates to support the slowing economy have reduced the allure of the greenback and interest-bearing assets.
Global Uncertainty: Not to mention the trade uncertainties and escalating geopolitical tensions. In a risk-laden environment, Gold is always the top choice for institutional investors and central banks to preserve value.
📊 Technical Analysis
The M30 chart shows a perfect and sustainable bullish structure.
Ascending Channel: Price is moving very disciplined within a steep ascending channel. The lower support line of the channel is an extremely important dynamic support area.
Main Support Zone - "Buy Zone": The $4285 - $4287 area is a confluence of the lower channel line and old structural zone. This is an ideal area for Buyers to wait, watching for pullbacks to join the main trend.
Resistance and "Breakout": Price has formed a short-term sideways structure after forming a peak around $4380. A confirmed "breakout" through this area will open up further upside potential, aiming for higher liquidity zones.
Next Target - "Sell Liquidity": The liquidity zone for Sellers and also the expansion target of this bullish wave lies at $4468 - $4470, corresponding to the 1.618 Fibonacci Extension level. This is where profit-taking pressure and sellers may emerge.
🎯 Detailed Trading Plan
The main strategy is "Buy the Dip" - Watch for buying opportunities when price pulls back to key support zones. Selling should only be considered when there is a clear reversal signal at strong resistance areas.
Scenario 1: Buy the Trend (Priority) 📈
Entry Zone: $4285 - $4287.
Stop Loss: $4280.
Take Profit: $4310 - $4355 - $4377 - $4400.
Scenario 2: Sell the Rally (High Risk) 📉
Entry Zone: Watch for selling at the liquidity zone above $4468 - $4470.
Stop Loss: $4476.
Take Profit: $4453 - $4423 - $4410 - $4388.
Summary
Gold's rally is supported by both technical factors and solid macro narratives. Although prices are in the overbought zone, the saying "never fight a strong trend" is entirely accurate at this moment. Minor pullbacks, potentially to the EMA or lower channel line, should be seen as opportunities to increase Buy positions.
Trade with discipline and manage your capital tightly. Wishing everyone a successful trading day!
Follow me for the earliest strategies

Gold end points!?After a long journey i think we now need a rest Gold appears to be at a potential turning point where short positions may be closing and prices could move higher

XAU/USD 17 October 2025 Intraday AnalysisH4 Analysis:
-> Swing: Bullish.
-> Internal: Bullish.
Analysis and bias remains the same as yesterday's analysis, however CHoCH positioning has moved closer to more recent price action.
Price has printed a further bullish iBOS, however, I will apply discretion and not classify it as such due to the insignificant depth of pullback relative to recent price action.
At the time of this analysis price is continuing to print bullish without pause, which, as a result, I am unable to confirm a fractal high.
Current bearish CHoCH positioning is denoted with a blue horizontal dotted line.
Intraday expectation:
Price to print bearish CHoCH to indicate bearish pullback phase initiation.
Note:
The Federal Reserve’s sustained dovish stance, coupled with ongoing geopolitical uncertainties, is likely to prolong heightened volatility in the gold market. Given this elevated risk environment, traders should exercise caution and recalibrate risk management strategies to navigate potential price fluctuations effectively.
Additionally, gold pricing remains sensitive to broader macroeconomic developments, including policy decisions under President Trump. Shifts in geopolitical strategy and economic directives could further amplify uncertainty, contributing to market repricing dynamics.
H4 Chart:
M15 Analysis:
-> Swing: Bullish.
-> Internal: Bullish.
Price has continued bullish printing further ATH's.
Price has printed a further bullish iBOS and has again reacted from discount of 50% EQ.
Intraday expectation:
Price to target weak internal high, priced at 4,380.990.
Alternative scenario: As all higher timeframes are requiring a pullback, and we are seeing a narrowing of internal structure, price could target strong internal low.
Note:
Gold remains highly volatile amid the Federal Reserve's continued dovish stance, persistent and escalating geopolitical uncertainties. Traders should implement robust risk management strategies and remain vigilant, as price swings may become more pronounced in this elevated volatility environment.
Additionally, President Trump’s tariff announcements, particularly against China, are expected to further amplify market turbulence, potentially triggering sharp price fluctuations and whipsaws.
M15 Chart:

Gold sweeps SL, wait for BUY LIMIT at Demand Zone 4,223-4,225Timeframe analysis: H4/30M
Logic: Trend Continuation after liquidity sweep.
MARKET STRUCTURE ANALYSIS (SMC Analysis)
Main Trend: Bullish (Price is moving within a parallel channel).
Structure Confirmation (BOS): The chart has confirmed an upward Break of Structure (BOS), indicating that buyers are controlling the market.
Liquidity Sweep/Fake: The strong bearish candle (marked as "Fake") is a move to sweep Stop Losses of early buyers and gather liquidity before Smart Money pushes the price in the main direction. This is an Inducement action.
Key Demand Zone (POI/Demand Zone/Order Block): The TIMING BUY area (4,223.154 - 4,225.000) is a potential Demand Zone/Order Block identified by Smart Money. The price is expected to retest this area before continuing to rise.
MAIN TRADING SCENARIO (LONG SETUP)
SCENARIO: Wait for the price to Pullback to the POI area to enter a buy order, continuing the main bullish trend.
Parameter
Value
SMC Description
Action
BUY LIMIT
Place a pending buy order
Entry Zone (POI)
4,225.000 - 4,223.150
Demand Zone/Order Block after liquidity sweep.
Stop Loss (SL)
4,214.390
Place below the low of the liquidity sweep candle ("Fake Low"), ensuring safety.
Take Profit 1 (TP1)
4,240.000
Target the nearest Swing High.
Take Profit 2 (TP2)
4,250.000
Target psychological resistance and mid-channel.
Take Profit 3 (TP3)
4,260.000+
Target the upper boundary of the parallel channel.
R:R Ratio
Approximately 1:2.5 to 1:3.5 (Depending on TP)
Good R:R ratio for a trend-following trade.
RISK MANAGEMENT
Risk: Only risk a maximum of 1-2% of the account for this trade.
Breakeven: When the price hits TP1, move SL to the Entry point (Breakeven) to protect capital.
Invalidation: If the price closes the D1/H4 candle below the SL level (4,214.390), the buy plan will be invalidated.

Gold Buy - Support testedGold held strong at $4,100 support and is consolidating below $4,150–$4,180 resistance. A breakout targets $4,200+. Uptrend stays valid above $4,100; below it, momentum weakens.
