Gold Declines Until the End of the SessionHello everyone, what do you think about the trend of OANDA:XAUUSD ?
Gold continues its downward trend into the close of the session, currently settling at 3,335 USD and moving near the final support zone . The precious metal remains under pressure as the US Producer Price Index (PPI) rose by 0.9% in July.
From a technical perspective, the recent news continues to act as a barrier for XAUUSD, with the price moving below both the EMA 34 and EMA 89 and being limited by the trendline.
The price wedge is pushing gold down towards lower price zones, and as mentioned, gold is now testing the final support level (in the short term). If this level continues to break, the next target for sellers could be the round level of 3,300 USD.
What do you think about the trend of XAUUSD? Leave your thoughts in the comments!
Xauusd(w)

Gold is Ready For Bull After Forming a Strong SupportHello Traders
In This Chart GOLD HOURLY Forex Forecast By FOREX PLANET
today Gold analysis 👆
🟢This Chart includes_ (GOLD market update)
🟢What is The Next Opportunity on GOLD Market
🟢how to Enter to the Valid Entry With Assurance Profit
This CHART is For Trader's that Want to Improve Their Technical Analysis Skills and Their Trading By Understanding How To Analyze The Market Using Multiple Timeframes and Understanding The Bigger Picture on the Charts

XAUUSD Daily Sniper Plan 18.08.2025Good day traders! ✨
Gold is trading cautiously as markets weigh the U.S. dollar’s resilience. With last week’s strong retail sales still echoing, attention shifts to upcoming U.S. housing data and manufacturing prints that could reaffirm the Fed’s “higher for longer” stance. Meanwhile, geopolitical tensions in the Middle East continue to underpin safe-haven demand, leaving gold caught in a tactical battle between USD strength and risk-off flows.
🔸 HTF Bias (H1 Overview)
On H1, gold is consolidating after rejecting 3355, with EMA flow showing dynamic resistance above and RSI cooling from near overbought territory. Structure suggests sellers are defending premium while buyers protect the mid-discount shelves. Bias leans neutral-to-bearish unless price can reclaim above 3360 with conviction.
📌 Intraday Key Levels
🔺 Premium Side (Above Price – Resistance)
3360 → Major OB cap + imbalance lid
3355 → Nearest clean reaction level
3348 → Refined OB edge
3340 → Minor supply lid
3335 → M15 OB core
3330 → Internal premium trap
🔻 Discount Side (Below Price – Support)
3325 → Minor demand retest
3314 → Key liquidity pivot (H1)
3305 → Local OB defense
3295 → Small gap fill level
3287 → M30 demand edge
3278 → Liquidity shelf
3272 → Broken invalidated buy zone (to track)
3265 → H1 demand cluster
3258 → Deep intraday floor
🎯 Battle Plan
🔹 Sell Zone (Premium)
3355–3360 → Refined OB + imbalance cap.
Targeting 3335 then 3314 if rejection confirms.
🔹 Buy Zone (Discount)
3287–3295 → M30 demand edge + gap fill alignment.
Targeting 3314, stretch to 3340 if momentum builds.
⚔️ Decision Zone
3330–3335 (M15 OB + internal trap) → This is the tactical decision area. A clean rejection here could reopen premium shorts, while a reclaim with BOS may flip bias and expose 3348 → 3355.
✅ Action Plan
Watch 3355–3360 for premium rejection and sell confirmation.
Monitor 3287–3295 for refined buy setups with OB/FVG alignment.
Track 3330–3335 closely: this will likely dictate whether gold expands higher into premium or rotates back to discount.
✨ Stay sharp, trade with discipline, and remember: sniper patience always pays.
💬 Drop your thoughts in the comments — do you see gold holding premium resistance or diving into deeper discount?
👍 🚀🚀🚀Like this analysis if it helps your plan, and hit follow to never miss the next update!
📌 Analysis made on Trade Nation feed – official GoldFxMinds partner.

XAUUSD – H4 Structural OutlookHello traders 👋,
We’re navigating a tight structure on H4, with gold trading around the 3335 pivot area. Let’s map the main institutional footprints shaping the market.
🔸 Macro Context
Markets remain highly reactive to USD strength, yields, and Fed policy expectations. Gold has been caught between safe-haven demand and a resilient dollar. With FOMC minutes and inflation data ahead, volatility and decisive breakouts are likely.
🔸 Bias
The current H4 structure leaves no fixed bias.
Holding above 3348–3360 supply opens room toward deeper premium zones (3380–3405).
Slipping under 3300–3280 demand exposes broader discount territory.
Patience is key here: let structure confirm before leaning bullish or bearish.
📌 Structural Supply Zones (Premium Side)
“Upper Weekly Supply” – 3439 → 3350
Large untouched weekly OB, origin of the last bearish drive.
Holds liquidity above recent highs.
Role: macro ceiling, where bears could reinforce.
“Mid-Supply Trap” – 3405 → 3380
Defined H4 OB in premium.
Fresh, partially tapped.
Role: intermediate rejection zone, where sellers may step in early.
“Immediate Supply Cap” – 3360 → 3348
Nearest clean OB above price.
Backed by imbalance + inducement.
Role: short-term resistance lid – could cap retracements.
📌 Structural Demand Zones (Discount Side)
“Protective Demand Floor” – 3300 → 3280
Fresh untested OB right below spot.
Confluence with gap fill + early discount.
Role: first defensive layer for bulls.
“Swing Demand Base” – 3260 → 3240
Clean H4 OB, fully intact.
Supported by liquidity beneath.
Role: major buy zone for continuation.
“Deep Weekly Demand” – 3180 → 3160
Untouched weekly OB, extreme discount.
Role: ultimate liquidity magnet for long-term positioning.
🔸 Extended Context (secondary footprints)
3328–3312 → Micro demand (reactive but weak).
3295 → Minor continuation demand (aligned with EMA50).
3275–3240 → Historical demand block (already partially mitigated).
3235–3210 → Discount FVG (liquidity cluster).
3200–3150 → Wick-driven liquidity pool.
3135–3120 → Weekly higher-low demand.
These remain relevant as broader roadmap markers but are not as dominant as the six primary structural zones listed above.
🔸 Conclusion & Action Plan
Gold is currently boxed between Immediate Supply Cap (3360–3348) and Protective Demand Floor (3300–3280).
A clean break above 3360 reopens 3380–3405.
A slip under 3280 sharpens the path toward 3240 and potentially 3180 in deeper discount.
Sniper entries will need confirmation from lower timeframes (M30–M15) inside these macro footprints.
If this breakdown helps you map the field clearly, don’t forget to 🚀🚀🚀this post & follow GoldFxMinds for more sniper-precision updates 🔔✨
📌 Disclosure:
Outlook is based on Trade Nation data feed. Educational only – not financial advice.

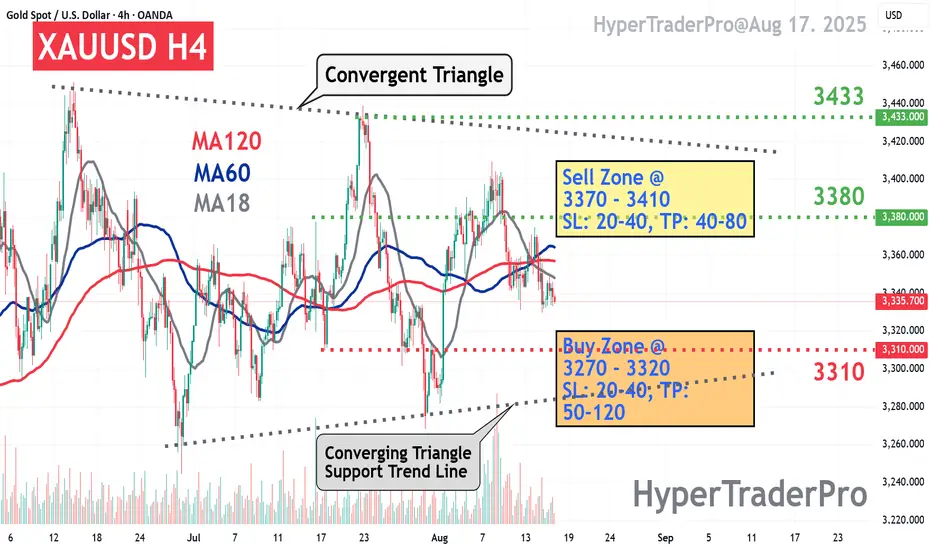
H4 shows a converging triangle patternAs shown in the chart, H4 shows a converging triangle pattern. It's recommended to trade within this converging triangle pattern: buy low and sell high. Consider buying low at the lower level of the support trend line, as a false fall breakout and rebound is possible.
Strategy:
Sell Zone @ 3370 - 3410
SL: 20-40, TP: 40-80
Buy Zone @ 3270 - 3320
SL: 20-40, TP: 50-120
GOLD 1H CHART ROUTE MAP UPDATE & TRADING PLAN FOR THE WEEKHey Everyone,
Please see our updated 1h chart levels and targets for the coming week.
We are seeing price play between two weighted levels with a gap above at 3352 and a gap below at 3327. We will need to see ema5 cross and lock on either weighted level to determine the next range.
We will see levels tested side by side until one of the weighted levels break and lock to confirm direction for the next range.
We will keep the above in mind when taking buys from dips. Our updated levels and weighted levels will allow us to track the movement down and then catch bounces up.
We will continue to buy dips using our support levels taking 20 to 40 pips. As stated before each of our level structures give 20 to 40 pip bounces, which is enough for a nice entry and exit. If you back test the levels we shared every week for the past 24 months, you can see how effectively they were used to trade with or against short/mid term swings and trends.
The swing range give bigger bounces then our weighted levels that's the difference between weighted levels and swing ranges.
BULLISH TARGET
3352
EMA5 CROSS AND LOCK ABOVE 3352 WILL OPEN THE FOLLOWING BULLISH TARGETS
3374
EMA5 CROSS AND LOCK ABOVE 3374 WILL OPEN THE FOLLOWING BULLISH TARGET
3398
EMA5 CROSS AND LOCK ABOVE 3398 WILL OPEN THE FOLLOWING BULLISH TARGET
3422
BEARISH TARGETS
3327
EMA5 CROSS AND LOCK BELOW 3327 WILL OPEN THE SWING RANGE
3304
3281
As always, we will keep you all updated with regular updates throughout the week and how we manage the active ideas and setups. Thank you all for your likes, comments and follows, we really appreciate it!
Mr Gold
GoldViewFX

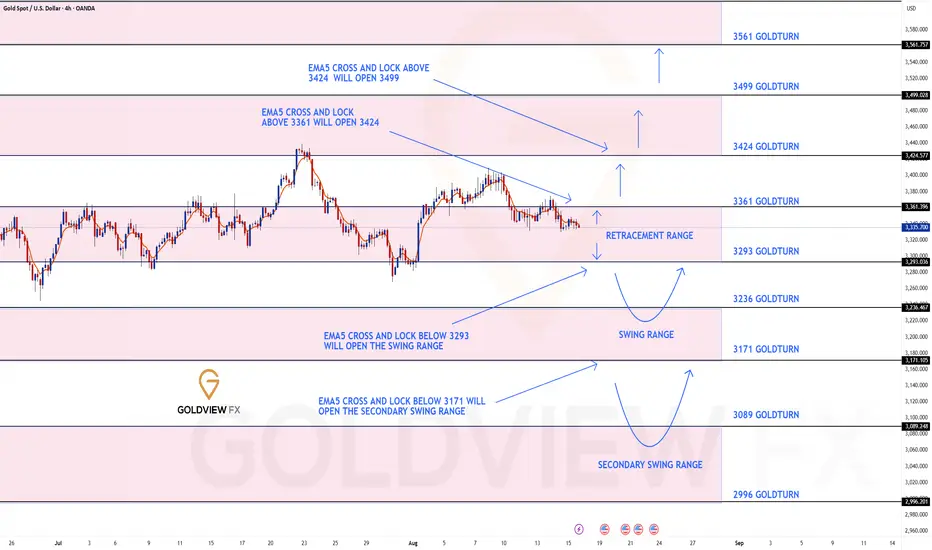
GOLD 4H CHART ROUTE MAP UPDATE & TRADING PLAN FOR THE WEEKHey Everyone,
Please see our updated 4h chart levels and targets for the coming week.
We are seeing price play between two weighted levels with a gap above at 3361 and a gap below at 3293. We will need to see ema5 cross and lock on either weighted level to determine the next range.
We will see levels tested side by side until one of the weighted levels break and lock to confirm direction for the next range.
We will keep the above in mind when taking buys from dips. Our updated levels and weighted levels will allow us to track the movement down and then catch bounces up.
We will continue to buy dips using our support levels taking 20 to 40 pips. As stated before each of our level structures give 20 to 40 pip bounces, which is enough for a nice entry and exit. If you back test the levels we shared every week for the past 24 months, you can see how effectively they were used to trade with or against short/mid term swings and trends.
The swing range give bigger bounces then our weighted levels that's the difference between weighted levels and swing ranges.
BULLISH TARGET
3361
EMA5 CROSS AND LOCK ABOVE 3361 WILL OPEN THE FOLLOWING BULLISH TARGETS
3424
EMA5 CROSS AND LOCK ABOVE 3424 WILL OPEN THE FOLLOWING BULLISH TARGET
3499
BEARISH TARGETS
3293
EMA5 CROSS AND LOCK BELOW 3293 WILL OPEN THE SWING RANGE
3236
3171
EMA5 CROSS AND LOCK BELOW 3171 WILL OPEN THE SECONDARY SWING RANGE
3089
2996
As always, we will keep you all updated with regular updates throughout the week and how we manage the active ideas and setups. Thank you all for your likes, comments and follows, we really appreciate it!
Mr Gold
GoldViewFX
GOLD DAILY CHART ROUTE MAPDaily Chart Update
Range Still in Control: Same Boundaries, Same Play
Not much has changed since last week. Price continues to rotate within the 3272–3433 range, respecting the structure with precision. The week’s action stayed contained inside this 170+ pip zone, reinforcing the dominance of the range.
As we head into the new week, the outlook remains the same: watching 3433 as upside resistance, while 3272 continues to anchor support. Until one side breaks and holds, range trading strategies remain the focus.
Current Outlook
🔹 Range Still Active
Price is firmly contained between 3272 and 3433. A decisive break outside this box is still required for a trend shift.
🔹 Same Rejections
The market has yet to sustain above 3433. Resistance stands firm.
🔹 Support Holding
As long as 3272 holds, bias stays neutral-to-bullish within the range, with eyes on another potential 3433 retest.
Updated Key Levels
📉 Support – 3272
Still the key pivot and buy zone unless a confirmed breakdown occurs.
📈 Resistance – 3433
Unchanged as the main ceiling. A break and hold above would shift dynamics, but until then, sellers remain in control at this level.
Thanks as always for your support,
Mr Gold
GoldViewFX

GOLD WEEKLY CHART MID/LONG TERM ROUTE MAPHey Everyone,
Please see our weekly chart update.
3387 Rejected, 3482 Gap Still Open
Following up on last week’s close above 3387, price has since shown rejection at that same level, leaving the 3482 gap still unfilled from the previous candle body. This pullback now highlights the 3281 gap below as support, keeping the broader structure intact but tempering the immediate upside momentum.
We’re watching for a potential re-challenge of 3387 before the path toward 3482 can resume. Until then, the market remains range-bound within these structural pivots.
Current Outlook
🔹 3387 Rejection
Despite previous week’s close above, price could not sustain higher, confirming 3387 as a tough barrier in the short term.
🔹 3281 as Key Support
The gap below sits at 3281, which remains the anchor pivot. As long as it holds, buyers have the chance to reload.
🔹 3482 Still Open
The unfilled gap to 3482 remains the long-term upside target. A re-test and hold above 3387 is needed before momentum can extend toward that objective.
Updated Levels to Watch
📉 Support – 3281
Critical base. A breakdown here would shift structure bearish.
📈 Resistance – 3387
Now the immediate barrier. Expect this to be re-challenged before further upside can develop.
📈 Upside Gap Target – 3482
Still open from previous structure. Comes into play only if 3387 can be cleared decisively.
Plan:
Price is consolidating between 3281 and 3387, with 3482 waiting above. Until 3387 is reclaimed on a closing basis, range trading remains the play. A clean break above flips bias bullish toward 3482, while failure at 3281 risks a deeper rotation.
Thanks as always for your support,
Mr Gold
GoldViewFX

XAUUSD Daily Outlook – 18 August👋 Hello traders,
We start the new day with gold sitting near 3335, right under heavy resistance. Markets remain sensitive to this week’s Retail Sales, FOMC minutes, and PMI releases, which could inject volatility into dollar flows and gold’s momentum.
📊 Macro & News Context
The market is waiting on US CPI and FOMC minutes this week – both can set the tone for USD strength/weakness.
Geopolitical tensions (BRICS currency talks + Middle East headlines) keep safe-haven flows alive, giving gold extra volatility.
Dollar index is holding firm, but yields are softening, which adds fuel to gold’s upside pullbacks.
📈 Daily Bias & Trend
Trend: Still bullish on HTF, but daily is showing signs of exhaustion near supply zones.
EMA Flow: EMA 5 & 21 locked bullish above 3310; EMA 50 around 3280 is the deeper support.
RSI: Cooling off from overbought, but still above midline – showing room for retracement before another push.
🔑 Daily Key Zones
Resistance
3350–3370 → Immediate daily supply, strong reaction area above price.
3420–3450 → Extension resistance zone (OB + FVG confluence).
3480–3500 → Extreme long-term resistance cap.
Support
3300–3280 → First daily demand, aligned with EMA21 support.
3275–3240 → Stronger demand, deeper structure level.
3200–3150 → Refined zone:
Top (3200–3150) = OB-based support.
Bottom wick (3150–3120) = Liquidity pool / magnet, not an entry zone.
🎯 Outlook & Action Plan
If gold rejects 3350–3370, we could see a retracement first into 3300–3280, then deeper towards 3275–3240 if macro flows align.
A clean break above 3370 opens the door to 3420–3450. Watch for liquidity sweeps and OB reactions before committing.
Below 3240, gold risks tapping the 3200–3150 liquidity pool, which may attract buyers again for a long-term swing.
✨ This Daily map gives us a full range: immediate reactions near 3350–3370, supports at 3300 & 3275, and a long-term magnet around 3150.
💡 What’s your outlook? Do you expect gold to revisit deeper supports before extending higher, or push directly into fresh highs?
👉 If you find this helpful, boost this idea🚀🚀🚀 & hit follow to stay updated with every sniper-level outlook. Let’s grow this community together ❤️📝🌍
Stay sharp,
GoldFxMinds
📌 Disclosure: Outlook based on Trade Nation charts. Educational purpose only — not financial advice.

XAUUSD Weekly Outlook – August 18–22, 2025👋 Hello traders, we’re heading into a new week with gold sitting right at a decisive point. Let’s break down the weekly structure step by step.
🌍 Macro & Calendar
This week brings Retail Sales, FOMC minutes, and PMI prints, alongside Fed speakers.
Geopolitical tensions continue to fuel gold’s safe-haven flow, keeping volatility alive.
📈 Weekly Bias
Gold remains in a bullish weekly structure, with price currently at 3335, pressing into heavy resistance.
EMAs (5/21/50/100/200) → stacked bullish, confirming long-term trend.
RSI → stretched in premium, hinting at potential exhaustion if resistance holds.
🧭 Key Weekly Structural Zones
Resistance / Supply
3350–3439 → Full wick-to-body Weekly Supply OB, institutional resistance zone.
3335 → Immediate overlap resistance, decision point for rejection or inducement.
Support / Demand
3275–3240 → Weekly Demand OB with EMA21 confluence, strong accumulation base.
3200–3120 → Liquidity magnet & potential deep support. Historical wick cluster that could trigger liquidity sweep before new demand builds.
🔢 Fibonacci Context
Swing 3200 → 3400 projection:
1.272 → 3445
1.618 → 3520
→ Extensions valid only if 3439 breaks and holds.
✅ Weekly Outlook Conclusion
Gold stands at a make-or-break level:
Rejection from 3335 → retracement into 3275–3240, with deeper liquidity risk into 3200–3120.
Break and hold above 3350 → bullish continuation to 3439, opening doors toward 3445–3520 Fibonacci extensions.
✨ If you found this analysis helpful, drop a comment and let me know your bias for the week! Don’t forget to follow GoldFxMinds for daily sniper plans and refined market updates.
⚠️ Disclosure: This outlook is for educational purposes only, not financial advice. Analysis is made on Trade Nation TradingView feed.
— GoldFxMinds

The weekly, D1 and H1 timeframes all currently favor the sellersHi traders and investors!
This analysis is based on the Initiative Analysis concept (IA).
Weekly timeframe
On the weekly timeframe, we see a buyer’s initiative, but at the same time, the seller absorbed a strong buyer candle — with the highest volume in recent months — and formed a seller zone (marked with a red rectangle). That’s a negative sign for long entries and a potential setup for short entries from the seller’s zone.
Below, the weekly chart shows three important levels: 3268, 3244, and 3201. I expect the price to move down toward 3244, where there is likely more liquidity (possibly with a touch of 3201). That’s where we can start looking for buy patterns.
Daily timeframe
On the daily timeframe, we have a sideways market and a seller’s initiative now, with a target at 3154. The buyer tried to start a move from the buyer zone (blue rectangle), but both candles had declining volume, and the second candle failed to close above the first one. That’s a negative sign for long entries.
Friday’s buyer candle also had low volume and showed no result — That’s a negative sign for long entries too.
With a seller’s initiative in place and no real buying signals, we’re focusing on short opportunities.
Hourly timeframe
On the 1H chart, the price has formed a sideways range with a buyer’s initiative. The lower boundary of this range is at 3331, where we saw price interaction on declining volume — a negative sign for long setups.
I expect price to interact with 3329, after which a buyer move is possible (unlikely, but possible). The target is 3358.
Wishing you profitable trades!

GOLD (XAUUSD): Support & Resistance Analysis For Next Week
Here is my latest structure analysis for Gold.
Support 1: 3327 - 3334 area
Support 2: 3245 - 3276 area
Support 3: 3121 - 3177 area
Resistance 1: 3357 - 3374 area
Resistance 2: 3402 - 3409 area
Resistance 3: 3431 - 3452 area
Consider these structures for pullback/breakout trading.
❤️Please, support my work with like, thank you!❤️
I am part of Trade Nation's Influencer program and receive a monthly fee for using their TradingView charts in my analysis.

Technical Analysis for XAUUSD (Gold) Closing Price: $3335.94 (16th Aug 2025, 2:05 AM UTC+4)
Analysis Methods: Japanese Candlesticks, Harmonic Patterns (ABCD, M/W), Elliott Wave, Wyckoff, Gann Theory (Time/Square of 9/Angles), Ichimoku, RSI, Bollinger Bands, VWAP, Moving Averages (MA/EMA/SMA/WMA).
1. Long-Term Trend (Weekly/Monthly)
Elliott Wave:
Gold is likely in Wave 5 of a broader bull cycle (Wave 3 peak at $3200, Wave 4 dip to $2950).
Target: $3450–$3500 if Wave 5 extends.
Gann Price Forecasting:
Square of 9:
√3335.94 ≈ 57.76 → Key resistance at 58² = $3364, support at 57² = $3249.
Break above $3364 opens path to $3400 (psychological level).
Ichimoku (Weekly):
Tenkan/Kijun: Bullish crossover (Tenkan > Kijun).
Cloud: Price above Senkou Span (bullish).
Moving Averages:
Weekly EMA(50): $3200 (strong support).
Swing Outlook: Bullish. Hold longs with trailing stops. Target $3450–$3500.
2. Medium-Term Swing (4H/Daily)
Harmonic Patterns:
ABCD Bearish pattern forming on 4H:
A: $3300 → B: $3350 → C: $3325 → D: $3360–$3370 (potential reversal zone).
Bullish Gartley (M Pattern) on daily chart near $3300 support.
Wyckoff Phase:
Distribution signs above $3330:
Upthrust (false breakout) at $3340 (16th Aug).
Volume fading near highs.
Gann Time Forecasting:
Aug 20–22 (geometric time window) for potential trend reversal.
RSI + Bollinger Bands (Daily):
RSI(14): 68 (approaching overbought).
Price hugging upper BB(20,2), suggesting consolidation.
Swing Trade Setup:
Short near $3360–$3370 (ABCD target) with stop-loss at $3385.
Long near $3300 (Gartley support) with stop-loss at $3280.
3. Intraday Outlook (5M–1H)
Key Levels:
Resistance: $3345 (Gann 1x1 angle), $3360 (Square of 9).
Support: $3320 (VWAP), $3300 (psychological).
Indicators:
Ichimoku (1H):
Tenkan: $3330, Kijun: $3320 → Price above both (short-term bullish).
Cloud: Thin and bullish (no major barriers until $3340).
RSI + Bollinger Bands (1H):
RSI(14): 62 (neutral).
Price testing mid-BB ($3330) → Break below signals pullback.
VWAP + MAs:
VWAP: $3325 (intraday support).
EMA(20): $3332 (dynamic support).
Candlestick Patterns:
16th Aug 4H Candle: Shooting star at $3340 → Bearish reversal signal.
1H Chart: Bearish engulfing below $3335.
Gann Squaring of Price-Time:
Time Cycle: 10:00–11:00 AM UTC+4 (volatility spike).
Price Harmony: $3335 = pivot → Close below $3330 targets $3315.
Intraday Trade Plan:
Sell below $3330 (target $3320 → $3310).
Buy above $3340 (target $3350) if RSI <70.
Stop-Loss: $15–$20 from entry.
Critical Events Ahead:
Gann Reversal Window: Aug 20–22 (watch for profit-taking).
Daily Close above $3350 invalidates bearish ABCD pattern.
Risk Note: Monitor USD strength and Fed policy hints. Use tight stops intraday.
For those interested in further developing their trading skills based on these types of analyses, consider exploring the mentoring program offered by Shunya dot Trade. (world wide web shunya dot trade)
I welcome your feedback on this analysis, as it will inform and enhance my future work.
Regards,
Shunya.Trade
world wide web shunya dot trade
⚠️ Disclaimer: This post is educational content and does not constitute investment advice, financial advice, or trading recommendations. The views expressed here are based on technical analysis and are shared solely for informational purposes. The stock market is subject to risks, including capital loss, and readers should exercise due diligence before investing. We do not take responsibility for decisions made based on this content. Consult a certified financial advisor for personalized guidance.

XAUUSDHello Traders! 👋
What are your thoughts on GOLD?
Gold failed to break through the key resistance zone near the recent highs and got rejected. Additionally, the ascending trendline has been broken, with price now trading below it.
While the long-term outlook remains bullish, the short-term bias has shifted to bearish, and we expect further downside toward the next support levels.
Don’t forget to like and share your thoughts in the comments! ❤️

GOLD Risky Long! Buy!
Hello,Traders!
GOLD is making a retest
Of the horizontal support
Of 3330$ and this is a
Strong level from where
We will expecting a local
Bullish rebound on Monday
Buy!
Comment and subscribe to help us grow!
Check out other forecasts below too!
Disclosure: I am part of Trade Nation's Influencer program and receive a monthly fee for using their TradingView charts in my analysis.

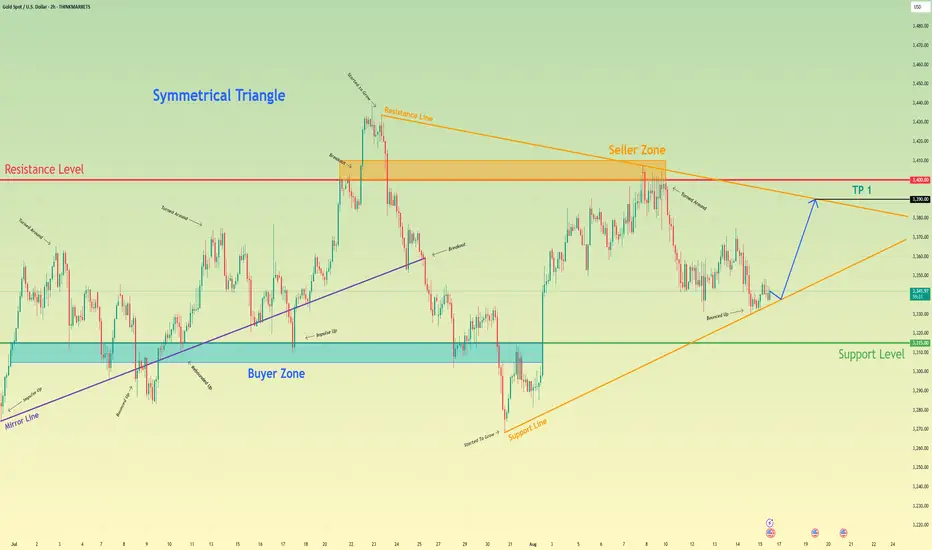
Gold can make correction and then rebound up of support lineHello traders, I want share with you my opinion about Gold. The Gold market has transitioned from a clear directional trend into a phase of price discovery and consolidation, following a significant breakdown of a prior ascending mirror line. This shift in market dynamics has led to the formation of a large symmetrical triangle, a pattern that signifies a period of equilibrium and contracting volatility as the price coils between a descending resistance line and an ascending support line. The boundaries of this pattern are well-established, with the buyer zone around the 3315 support level providing a floor and the seller zone near 3400 acting as a ceiling. Currently, the price is navigating the lower half of this triangle, having recently rebounded from the support line. The primary working hypothesis is a long scenario, based on the expectation of another successful test of the ascending support line. A confirmed and strong rebound up from this dynamic support would validate the integrity of the triangle and suggest that another full rotation to the upside is likely. Therefore, the tp for this rotational move is logically placed at the 3390 level. This target aligns perfectly with the triangle's upper resistance line and sits just below the major seller zone, representing the most probable destination for a bullish swing originating from the pattern's support. Please share this idea with your friends and click Boost 🚀
Disclaimer: As part of ThinkMarkets’ Influencer Program, I am sponsored to share and publish their charts in my analysis.
Should we wait for gold to rise? Yes.
Hello everyone
as shown in the figure, 4 channels have been drawn, and in each of the previous 3 channels, the price of gold has successfully broken the channel and entered the next channel. I believe that in the coming years we should see an increase in the price of gold. If you are looking for a safe investment, gold can help you.
What do you think?

Gold balances on a fine line: growth or correction?Following the release of soft US inflation data, gold is consolidating in the $3,250–$3,450 range, holding above key support. A weak dollar and expectations of a Fed rate cut are supporting bulls, but locally the price has hit a resistance zone.
Bullish:
Fixing above $3450 → target $3500, then $3550–$3600.
Breakthrough of $3500 will increase momentum to $3650+.
Bearish:
Breakthrough below $3250 → decline to $3200, with increasing pressure — to $3100.
📊 Indicators (D1)
RSI (14): ~43 — neutral, not overbought
MACD: in the negative zone — signal of a possible correction
SMA50/100/200: price slightly below average, indicating a pause in growth

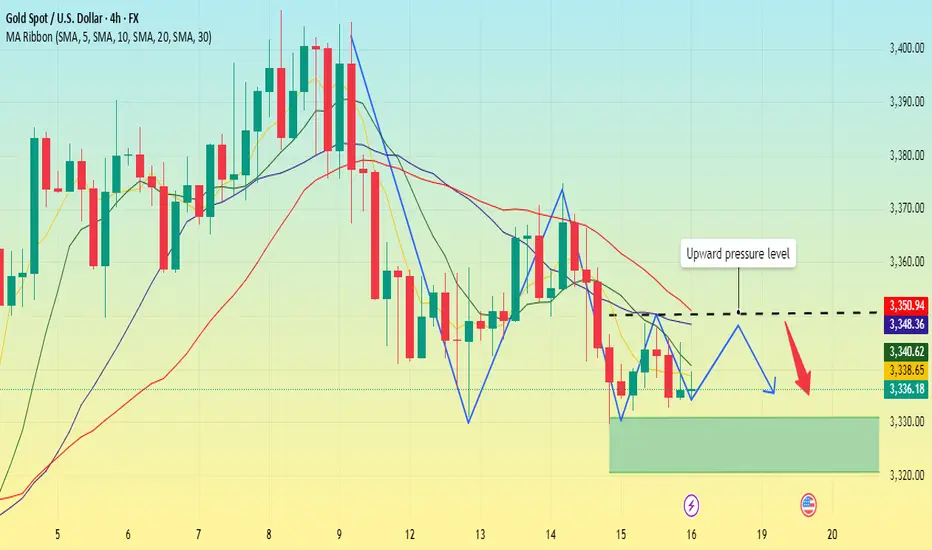
Gold's weakness is likely to continue next week.Gold fell immediately after the Asian market opened on Monday, dropping 64 points. After a minor mid-term pullback, it continued its decline, hitting a low near 3329 before stabilizing. It rebounded slightly on Friday, fluctuating slightly before weakening near the close. Meanwhile, it is under pressure below its short- and medium-term moving averages, a pattern that signals a continued decline.
At present, although the price remains in a large range of fluctuations, it is still expected to continue to decline in search of support, and the primary support below is maintained at 3300. This position is also the key point for a band-like rebound in the later period, and it is also the position that may be touched next week. The upper pressure continues to remain around 3350, which is also the previous top and bottom conversion position. If the market is still in a bearish trend next week, the rebound will most likely not break through this position.
On the whole, if gold rebounds first in the early Asian session next week, the main strategy is to short it when it touches around 3345, with the profit range around 3330-3320; if the European session continues to be weak, then the US session will continue to rebound and short it.
A happy weekend has begun. I wish you all a happy weekend.
GOLD RAID ON – Bullish Limit Orders Are LIVE! XAU/USD💰GOLD HEIST IN PROGRESS! XAU/USD BULLISH RAID BEGINS! 🏴☠️📈
Asset: XAU/USD – Gold vs U.S Dollar
📊 Plan: BULLISH ROBBERY
🎯 Target: 3460.00
🛑 Stop Loss: 3330.00
📥 Entry: ANY level – vault is wide open!
👑 THIEF MODE ACTIVATED – Time to raid GOLD like a pro. We’re stacking multiple limit orders (layering entries) just like setting traps for those greedy bears 🐻💥
🚪💼 Entry strategy:
“The vault is unlocked – grab your bag and go!”
Place buy limits at recent swing lows (15m/30m) or jump in live with your bullish crew. Use alerts to catch price at key pullback zones.
🛑 SL placed at: 3330 – Just below thief territory. Adjust based on your lot size + number of entries 🔐
🎯 Target: 3460 – Hit and run, or trail that SL and let the gold rain! ☔💸
🧠 Thief Tactics for GOLD:
Only trade Long-side – scalpers, swing traders, all aboard 🚂
Use trailing SL to protect your loot
Avoid trading during high-impact news (CPI, NFP, Fed, etc) ⚠️
Stay alert for manipulations + fake-outs at key levels – it's a trap game out here 🎭
📰 Before the Heist:
🧾 Read Fundamentals • COT Report • Sentiment • Macro Outlook
📌 Always stay updated, news can flip the market faster than a backstab 🗡️
🗣️ Boost this idea if you’re robbing with us!
💥 Smash that LIKE if you believe in the heist
🚨 Follow for more high-voltage thief trades
💎 Daily playbooks. Clean getaways. All signals, no noise.
Join the crew. Trade like a THIEF. Get rich or get smarter.
🕵️♂️💰🚀🔥🐱👤📈

XAUUSD – Double Tap or Deeper Correction?Idea Breakdown:
Gold just gave us a textbook double-tap at the key 1,910–1,912 demand zone. This level aligns with the 61.8% retracement from the most recent bullish impulse. The long wicks on the daily suggest strong rejection by buyers.
As long as price holds above 1,910, this looks like a potential launch pad for another leg up. Next resistance sits around 1,943, and above that, we’re eyeing 1,966 and 1,984.
Plan:
• Look for bullish price action on the lower timeframes (1H–4H) confirming the double tap
• Conservative entry: on a retest of 1,912
• Aggressive entry: break and hold above 1,943
• Invalidation: Clean daily close below 1,898
Structure:
• Daily double tap at the 1,910–1,912 level
• Strong bullish wick rejection
• Reaction from 61.8% Fibonacci retracement
• In line with overall bullish market structure
Key Zones:
• Support: 1,910–1,912 (wick rejections + Fib confluence)
• Resistance: 1,943
• Breakout target: 1,966 and 1,984
• Invalid if we break below: 1,898

Gold sell opportunity Gold price broke through trend line. This is clear breakout opportunity to the down side
