Critical Retest: Can the Uptrend HoldMarket Overview
The broader price structure clearly remains in an uptrend. However, a short-term bearish formation recently developed but was quickly invalidated as the market reversed into bullish momentum again on Friday.
Before the market closed, price retraced to retest the breakout level. If it can hold above this area and establish a higher structure, the uptrend is likely to continue until the trend shows signs of exhaustion. Conversely, if the retest fails and price breaks back below the ascending trendline, the market may enter a sideways consolidation phase, potentially forming a corrective pattern before the next decisive move.
Xauusd(w)

Gold Trade Setup - 27/Sep/2025Hi Traders,
I am biased for further upside in Gold.
The first trade that I will be looking for is from the highlighted zone and the price is already testing it.
If price corrects here , then I will expect it to drop further to the next marked POI.
Please follow me and like if you agree or this idea helps you out in your trading plan.
Disclaimer : This is just an idea. Please do your own analysis before opening a position. Always use SL & proper risk management.
Market can evolve anytime, hence, always do your analysis and learn trade management before following any idea.

XAUUSD | First Line of DefenseXAUUSD | Watching the First Support
On XAUUSD, I see the first major support around the blue box. That’s where I’ll be paying attention as price drifts lower.
When we get there, I’ll be watching the 1-hour CDV closely. A positive divergence would suggest buyers are absorbing and could set up a tactical bounce.
My track record speaks for itself: the win rate of my trades is listed below. Trading with me costs nothing. You can check my profile.
I keep my charts clean and simple because I believe clarity leads to better decisions.
My approach is built on years of experience and a solid track record. I don’t claim to know it all, but I’m confident in my ability to spot high-probability setups.
If you would like to learn how to use the heatmap, cumulative volume delta and volume footprint techniques that I use below to determine very accurate demand regions, you can send me a private message. I help anyone who wants it completely free of charge.
I have a long list of my proven technique below:
🎯 ZENUSDT.P: Patience & Profitability | %230 Reaction from the Sniper Entry
🐶 DOGEUSDT.P: Next Move
🎨 RENDERUSDT.P: Opportunity of the Month
💎 ETHUSDT.P: Where to Retrace
🟢 BNBUSDT.P: Potential Surge
📊 BTC Dominance: Reaction Zone
🌊 WAVESUSDT.P: Demand Zone Potential
🟣 UNIUSDT.P: Long-Term Trade
🔵 XRPUSDT.P: Entry Zones
🔗 LINKUSDT.P: Follow The River
📈 BTCUSDT.P: Two Key Demand Zones
🟩 POLUSDT: Bullish Momentum
🌟 PENDLEUSDT.P: Where Opportunity Meets Precision
🔥 BTCUSDT.P: Liquidation of Highly Leveraged Longs
🌊 SOLUSDT.P: SOL's Dip - Your Opportunity
🐸 1000PEPEUSDT.P: Prime Bounce Zone Unlocked
🚀 ETHUSDT.P: Set to Explode - Don't Miss This Game Changer
🤖 IQUSDT: Smart Plan
⚡️ PONDUSDT: A Trade Not Taken Is Better Than a Losing One
💼 STMXUSDT: 2 Buying Areas
🐢 TURBOUSDT: Buy Zones and Buyer Presence
🌍 ICPUSDT.P: Massive Upside Potential | Check the Trade Update For Seeing Results
🟠 IDEXUSDT: Spot Buy Area | %26 Profit if You Trade with MSB
📌 USUALUSDT: Buyers Are Active + %70 Profit in Total
🌟 FORTHUSDT: Sniper Entry +%26 Reaction
🐳 QKCUSDT: Sniper Entry +%57 Reaction
📊 BTC.D: Retest of Key Area Highly Likely

Back to 4H Frame – Fed & Inflation Shape Gold PathGold on the 4H timeframe is consolidating near premium supply after multiple liquidity sweeps. Recent U.S. inflation data kept the dollar resilient, while traders anticipate upcoming Fed commentary for clearer policy direction. Price rejected from the 3,795 supply pocket and is now retracing toward discount demand zones. Market structure suggests engineered sweeps below support before bullish continuation into Q4.
________________________________________
📌 Key Structure & Liquidity Zones (4H):
• 🔼 Buy Zone 3,692 – 3,694 (SL 3,685): Discount demand aligned with liquidity grab, ideal for continuation longs.
• 🔽 Sell Zone 3,795 – 3,797 (SL 3,804): Premium supply pocket where liquidity sweeps may trigger short-term rejections.
________________________________________
📊 Trading Ideas (Scenario-Based):
🔺 Buy Setup – Discount Demand Reaction
• Entry: 3,692 – 3,694
• Stop Loss: 3,685
• Take Profits:
TP1: 3,715
TP2: 3,740
TP3: 3,760+
👉 Smart money may engineer a sweep below 3,694 before reversing higher. Watch for bullish rejection patterns at demand.
🔻 Sell Setup – Premium Supply Reaction
• Entry: 3,795 – 3,797
• Stop Loss: 3,804
• Take Profits:
TP1: 3,780
TP2: 3,765
TP3: 3,750
👉 Short-term liquidity scalp opportunity against trend. Valid if price fails to break above breakout point.
________________________________________
🔑 Strategy Note
Bias remains bullish medium-term, but intraday sweeps into demand zones are expected as Fed officials continue to push cautious monetary guidance. Liquidity hunts around 3,795 supply and 3,694 demand will likely define the week’s volatility before a decisive breakout.

Gold Near $3,800 & Preparing for a Major Move🔥 XAUUSD – FiboMatrix Trading Plan
📊 Market Overview
Gold extended its bullish momentum on Thursday, pushing closer to the record high near $3,800/oz on Friday. The rally is fueled by a weaker USD as Treasury yields continue to slide, while expectations of further Fed rate cuts support non-yielding assets.
However, the market is not without risk. As we move into the end of September, gold could face a sharp correction wave, setting up liquidity sweeps and a technical pullback in early October before the next major bullish leg.
📍 Key Technical Levels (H4–H2 Chart)
🔴 SELL Reaction Zones
3,750 – 3,752 → First intraday rejection area.
3,735 – 3,736 → Secondary resistance zone.
3,719 – 3,720 → Short-term rejection level.
🟢 BUY Support Zones
3,693 – 3,695 (Fibo 0.618 confluence) → Strong liquidity zone for bullish setups.
Breakdowns may provide a high-RR BUY opportunity for swing traders.
🎯 Trading Plan
1️⃣ Short-Term SELL Setup
Entry: 3,750
Targets: 3,720 → 3,695.
SL: Above 3,760.
2️⃣ Major BUY Opportunity
Entry: 3,693 – 3,695 zone with bullish confirmation.
Targets: 3,735 → 3,780 → Break above 3,800.
SL: Below 3,685.
⚡ Pro Insights
Expect end-of-month volatility with potential liquidity grabs.
Best R:R comes from waiting for pullbacks into Fibo confluence zones.
If gold holds above 3,695, the bullish structure remains intact heading into October.
💬 Community Discussion
Will gold break $3,800 this week, or will we see a deeper pullback to 3,695 first before the next big rally? Drop your charts & setups 👇

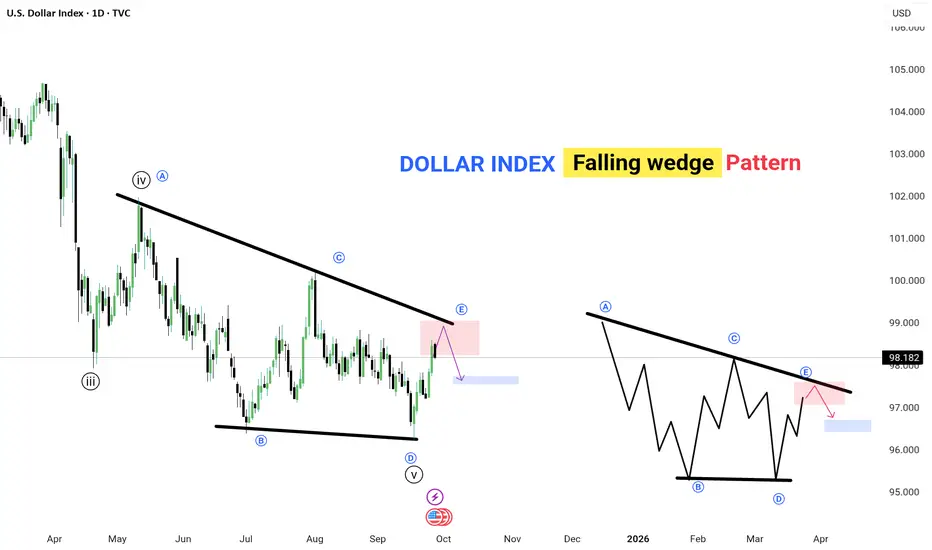
DOLLAR INDEX – Falling Wedge Pattern📉 The Dollar Index is forming a falling wedge, a classic reversal pattern.
🔹 Price is approaching the upper trendline resistance (point E).
🔹 Expect a potential pullback toward the support zone (highlighted in blue).
🔹 Pattern repeats: After E, a corrective dip is likely before the next move.
✅ Key Points:
Falling wedge usually signals trend reversal or continuation.
Watch for breakout confirmation above resistance for bullish continuation.
Current focus: resistance zone near 98–98.2, then potential drop to 96–97 support.
💡 Lesson: Patience pays — wait for clear rejection or breakout before trading this setup.
---
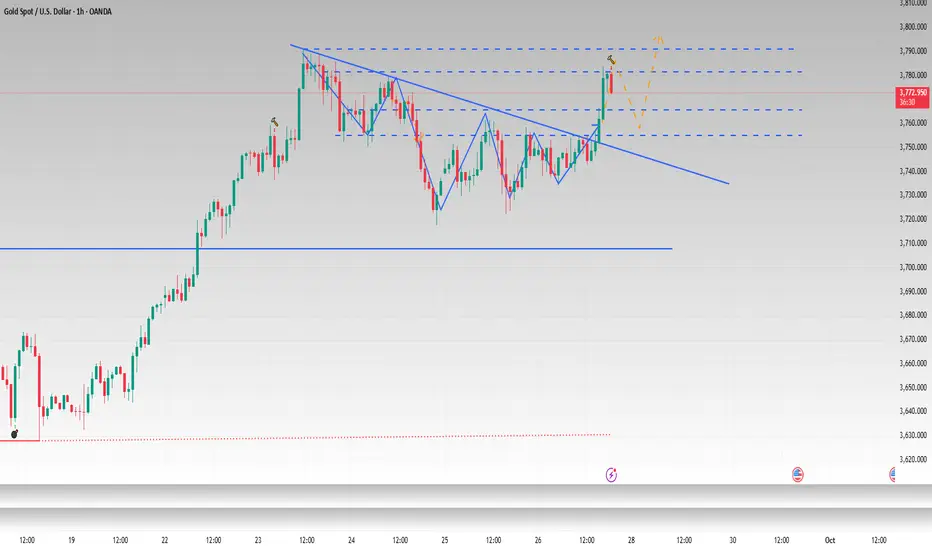
Gold–Consolidation Before Next Move | Breakout or Retest?Gold is trading around 3,773 after a strong rally, now moving in a consolidation range.
Immediate resistance sits in the 3,790–3,800 zone, where bulls need a breakout for further upside momentum.
On the downside, key supports are marked at 3,763 and 3,747.
If price holds above these supports, we could see another bullish leg higher.
A clean break below 3,747 may open the way toward deeper support at 3,720.
Currently, the market is in a decision zone — the next breakout will confirm the short-term direction.
👉 Do you expect Gold to break higher, or retest deeper supports first? Share your view in the comments.

XAUUSD 1 HR
- *Entry*: $3,750
- *Target*: Potential target at TP1 ($3,780.59) as per chart markings.
- *Considerations*:
- Recent upward movement.
- *Note*: Trading involves risk. Always consider market conditions and use proper risk management.

XAU/USD: Gold Pauses Ahead of Inflation ReportHello everyone, let’s take a look at gold (XAU/USD) price action during the 25th of September session!
Following a surprise drop in US jobless claims, gold has stalled around $3,740 per ounce while investors await the PCE inflation report – a key release that could shape the Fed’s next move on interest rates.
From a technical perspective, gold is currently facing important resistance at $3,750, an area where multiple Fair Value Gaps (FVGs) have appeared. If the price fails to break higher, a pullback towards $3,720 is likely – a level also marked by several FVGs that could provide solid support. As long as gold remains above this zone, the broader uptrend remains intact. Signals from the Ichimoku Cloud further confirm the strength of the bullish structure.
On the news front, stronger-than-expected US labour data has lowered expectations of early Fed easing, shifting the market’s focus to the PCE release. A higher reading could strengthen the USD and put pressure on gold, while a weaker outcome would bolster the case for an October rate cut, potentially giving gold new momentum.
In the short term, gold is likely to retest the $3,720 support area. If this level holds, the price may rebound towards $3,750 and even $3,800. In a more negative scenario, a break below $3,720 could see gold retreat to $3,700 before buyers return.
What do you think – will this PCE report be strong enough to push gold above $3,750?

Gold Prepares for a New Breakout👋Hello everyone, what do you think about the trend of OANDA:XAUUSD ?
XAUUSD has been consolidating in a narrow range, forming a bullish flag pattern with clear support at 3,730. Additionally, the Bollinger Bands are showing that the market is preparing for a potential breakout.
If the price continues to hold above the support line, the bullish trend may continue, with the immediate target at the resistance level around 3,785. The Core PCE Price Index m/m, set to be released today, will serve as a short-term catalyst for this trend.
Keep an eye on these key levels to confirm the breakout!
And you, what do you think about gold's price today💬? Feel free to share your thoughts in the comments below!
Good luck!

XAU/USD: Strong Rebound After Testing $3,720 SupportHello everyone, let’s take a closer look at gold (XAU/USD) after the latest market moves.
At present, gold is undergoing a mild pullback from $3,748, though the primary trend remains bullish after testing the key support area at $3,720. Following the strong upward rally, profit-taking emerged as price touched resistance around $3,750, making this a natural correction.
The $3,720 support zone, reinforced by a Fair Value Gap (FVG), strengthens the likelihood of a rebound. Price action remains above the Ichimoku Cloud (Kumo), confirming that the main bullish trend is intact and the cloud continues to act as a dynamic support in case of further corrections.
On the macro side, persistent economic and geopolitical uncertainty supports safe-haven demand, which could drive gold prices higher if volatility increases.
After testing $3,720, gold is expected to recover strongly towards $3,750 and $3,800. A decisive break above these levels may open the path to $3,850.
Do you think gold will be able to break $3,800 in the coming sessions?

Gold Week Sep 22 - Sep 26 - Fibonacci Circles Breakout?🎢 Last Friday was a rollercoaster, and not the fun kind for me. 😅 My trading plan went completely haywire, and I'm pretty sure everyone reading was like, "What is this noob doing? 😂" But hey, we learn from our mistakes, right? So let's break down what happened.
FX_IDC:XAUUSD Crazy Friday 💥
I usually trade during the European session, and everything was going smoothly. Gold was behaving just as I expected, dropping to $3643. Then, chaos! 😱
First, it shot up to $3659, and just when I thought it was done, it decided to fall back down to $3643. But wait, there's more! At the start of the US session 🇺🇸, it went on a bullish rampage, soaring to $3685, the high of the day. 🚀 I was totally caught off guard! My bias was short because of the recent highs after the FOMC and rate cut news. That was a big lesson learned. 😩
What's Up Next? A Big Week Ahead! 🔮
Get ready, because this week is going to be HUGE! 🎉 My analysis shows that Gold is in a **super important spot** right now. It's in the perfect position to try and make a big move higher! 📈
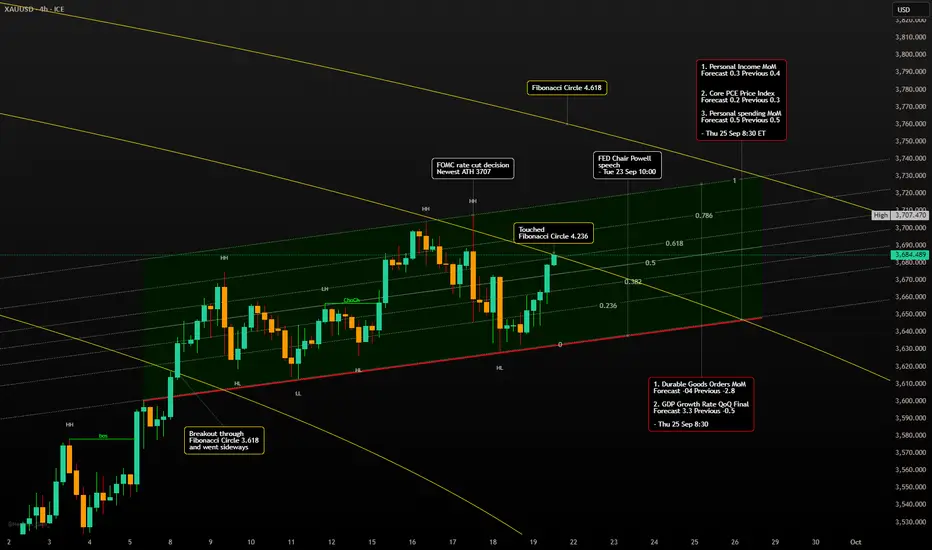
You might not believe me, but my Fibonacci circle analysis is screaming "breakout!" 📢 If you draw a Fibonacci circle on the daily chart from **$3500.200 (April 21, 2025)** to **$3246.550 (June 29, 2025)**, you'll see a pattern of breakouts. And guess what? We're on one of those circles right now! It's no joke, you should totally try it yourself. 🤯
As long as Gold holds this level, it's primed for a surge. 🌊 I even drew an image showing that Gold is sitting right on the 4.236 Fibonacci circle level from Friday's close. This is serious stuff! 🧐
I'm expecting a sideways "ping pong" 🏓 kind of week until Thursday, bouncing around the 0.382 and 1 Fibonacci levels. The ascending parallel channel gives us a clue on where it might go in the short term.
Heads Up: This Week's Economic Events 📅
Keep an eye on these key events, as they can really shake things up! 🔔
Thursday, September 25th, 8:30 AM EST
- Durable Goods Orders MoM: Forecast -0.4% (Previous -2.8%)
- GDP Growth Rate QoQ Final: Forecast 3.3% (Previous -0.5%)
Friday, September 26th, 8:30 AM EST
- Personal Income MoM - Forecast 0.3 Previous 0.4
- Core PCE Price Index - Forecast 0.2 Previous 0.3
- Personal spending MoM - Forecast 0.5 Previous 0.5
My Two Cents: A Word of Caution 🙏
Things can change in the blink of an eye, so be careful! I don't know what the next Asian and EU session will bring, but I have a feeling the US session is gearing up to buy Gold again. 💰
Remember, different trading sessions (Asia 🌏, Europe, and the US) have different biases. Don't make the same mistake I did last Friday! 😔 Stay sharp and happy trading! 🚀
-------------------------------------------------------------------------
This is just my personal market idea and not financial advice! 📢 Trading gold and other financial instruments carries risks – only invest what you can afford to lose. Always do your own analysis, use solid risk management, and trade responsibly.
Good luck and safe trading! 🚀📊
Deep correctionGold is likely to face a deep correction ahead. After breaking down from the red support zone, I’ll be watching for a potential breakdown of the blue trend line. This could signal further bearish momentum. Keeping an eye on key levels will be crucial for future movements.

Keep up with the trends and you'll make a profit—dare to try it?#XAUUSD OANDA:XAUUSD
I still hold the same view and should be wary of the main force pushing up prices to sell. In addition, today is Friday, and the market is most likely to go sideways or change direction. If you don’t want to trade, you can take a rest and enjoy the weekend. If you want to continue trading, you can refer to my last order layout of the day. Pay attention to the pressure of 3780-3790 on the top and the support of 3760-3750 on the bottom. The aggressive ones can try short selling, but they must set a stop loss. The conservative ones can wait for the support to arrange long positions. If you have any questions, please contact me. No other trading signals will be released in the evening.
GOLD → Consolidation ahead of the news. Rise or fall?FX:XAUUSD is consolidating in the range of 3738-3759 in anticipation of US PCE inflation data, a key indicator for forecasting further Fed policy. Pressure on the metal is intensifying amid a strengthening dollar.
The revision of GDP growth in Q2 to 3.8%, a decline in jobless claims, and an increase in durable goods orders have lowered expectations for aggressive Fed easing.
The new tariffs imposed by Trump have supported demand for defensive assets, but have not been able to offset the pressure from the rise of the USD.
The overall fundamental backdrop is stagnant amid Powell's uncertain stance and the start of a rate cut cycle. The market reaction is mixed...
Gold is in wait-and-see mode. Strong PCE data could send the price to support at $3700, while weak data could bring back interest in record highs.
Resistance levels: 3754, 3759, 3776
Support levels: 3738, 3728, 3703
Technically, the price is storming the resistance of the downward correction and the resistance of the “triangle” consolidation. A breakout and close above 3754-3759 will confirm the bullish sentiment, which could trigger growth towards the ATH. Otherwise, we can expect a retest of 3738-3728 before a possible rise.
Best regards, R. Linda!

GOLD Free Signal! Sell!
Hello,Traders!
GOLD rejects a horizontal supply area with clear SMC reaction. Liquidity engineered above 3,790$ suggests downside continuation toward 3,770$ imbalance. Time Frame 30M.
-------------------
Stop Loss: 3,791$
Take Profit: 3,769$
Entry: 3,782$
Time Frame: 30M
-------------------
Sell!
Comment and subscribe to help us grow!
Check out other forecasts below too!
Disclosure: I am part of Trade Nation's Influencer program and receive a monthly fee for using their TradingView charts in my analysis.

Holding on to 3755, there will be new highsAfter gold broke through the triangle boundary, it meant that the short-term downward adjustment was over. After falling back to 3755, it rebounded again. Everything was in line with our expectations. The morning trend chart also confirmed our advanced trading vision.
In the short term, gold will rise rapidly. Don't chase the rise easily at high levels. It is possible that the main funds want to push up the price to sell. On the upside, pay attention to the suppression brought by the previous highs of 3780-3790. As gold prices rise, short-term resistance also turns into support. Judging from the hourly and 4H charts, the middle track support has also come to around 3755, and the MA5 moving average has also moved up to around 3755. Under multiple conditions, 3755 has become a solid short-term support level. If the support of 3765-3755 can be held, gold may hit a new high and reach 3800-3810. Therefore, if gold rises and reaches 3780-3790 in the evening, I may consider shorting gold with a light position. If gold retreats directly to the 3765-3755 range, we can consider going long on gold to target new highs.
XAUUSD: Rally will Continue after CorrectionHello everyone, here is my breakdown of the current Gold setup.
Market Analysis
The prior Upward Channel has been broken, and the price is now trading below a major Trend Line, indicating that the strong bullish momentum has paused and the market has entered a corrective phase.
Currently, this corrective phase has taken the form of a horizontal Range or consolidation above the Support 2 level. The price has been oscillating between local support and resistance, and is now making another move down towards the bottom of this Range for what I see as a critical test.
My Scenario & Strategy
I'm looking for the price to complete its correction down into Support zone. A confirmed bounce from this area would be the first signal that the pullback is over. The next key step would be a breakout from the top of the current Range.
Therefore, the strategy is to watch for this bounce. A successful breakout from the Range would validate the long scenario. The primary target for the subsequent rally is 3825, which aims for a retest of the major broken Trend Line from below.
That's the setup I'm tracking. Thank you for your attention, and always manage your risk.

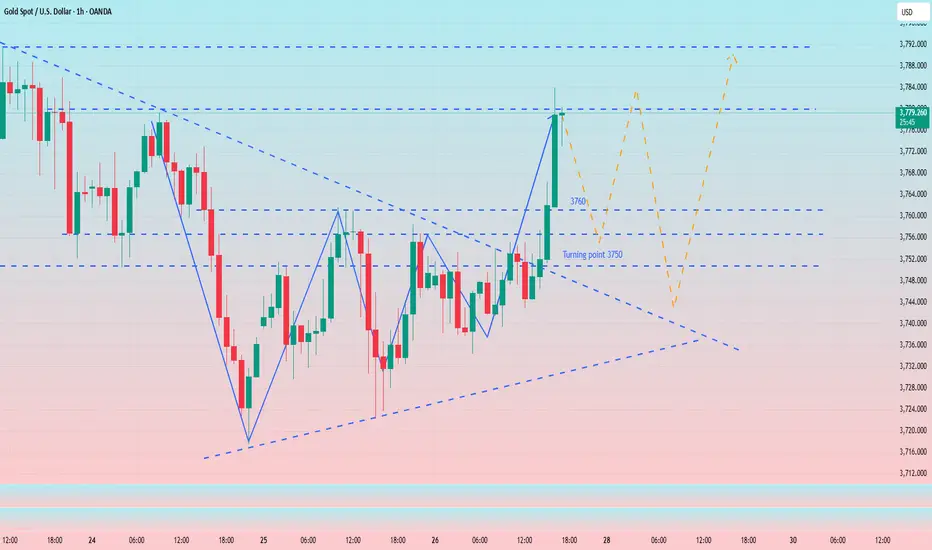
Gold (XAU/USD at Critical Decision Zone - Breakout or Rejection?📊 XAU/USD (Gold) Analysis - Decision Point at 3750–3760
Quick Summary:
Hello, traders! I've been watching the FX:XAUUSD chart for a while now, it clearly observed that TVC:GOLD has been climbing in a well-defined bullish channel, with every dip quickly absorbed by buyers. That larger structure is still intact, reinforced by a sequence of consolidations and breakouts, each pushing price higher and respecting the channel structure.
Right now, however, price action is stalling inside a short-term descending flag pattern just below the 3750–3760 resistance zone which is a textbook bullish continuation pattern.
This level is a true pivot. It has rejected price twice already and lines up with key Fib retracement levels. The market is hesitating here but also strongly rejecting lower prices, as seen in the multiple rejection around the 38.2% fib levels. I believe this is a clear tension building phase for the next major move.
There are two paths i see:
Path A: A confirmed breakout would fuel another impulsive wave higher✅.
Path B: A failure could drag price back toward Fibonacci supports❌.
My base case leans bullish: continuation toward 3790–3820 if resistance gives way. But if rejection holds, we could see a retracement back into 3728 or even 3709–3690 before buyers step back in.
1. Market Structure
Main Trend: Price is moving inside a well-defined ascending channel.
Pattern: Repeated cycle of descending consolidation → breakout → continuation.
Current price is again consolidating in a small descending channel within the bigger bullish structure.
2. Key Levels
Order Block: Around 3752–3760 zone (highlighted in red).
Fib Levels:
0.236 retrace → ~3752 (current resistance)
0.382 → ~3728
0.5 → ~3709
0.618 → ~3690 (stronger support)
Upside Targets: 3790 → 3820 🎯 aligns with Fib extension.
3. RSI & Momentum
RSI at 54.5 — mid-zone, neither overbought nor oversold.
RSI is forming a small wedge/triangle , suggesting potential breakout soon (momentum building).
4. Volume Context
Previous breakouts backed by strong volume surges.
Current consolidation is on reduced volume , which is typical before expansion.
5. Scenarios
🟢Bullish Case
If price clears 3752–3760 order block, breakout confirmation could push towards 3790–3820 (channel top + Fib extension).
🔴Bearish Case
If price rejects order block, we could see pullbacks to 3728 → 3709 → 3690 (layered Fib supports + mid-channel).
A deeper rejection could test the lower channel ~3660–3680.
Patience is the real edge here. Wait for confirmation-discipline and timing always outlast impulse.

XAU/USD | Gold at $3,740 – Demand Zone Decides the Next MoveBy analyzing the Gold chart on the 1-hour timeframe, we can see that yesterday the price finally started a correction, dropping to $3,717 . From this key psychological level, demand stepped in and pushed gold strongly up to $3,761 .
Currently, gold is trading around $3,740 , but it hasn’t fully stabilized yet. For that, the price needs to revisit the $3,711–$3,726 demand zone . If gold holds there, we could expect another powerful rally toward levels above $3,800 . Otherwise, we may soon see it dropping into the $3,600 range .
THE LATEST TA :
Please support me with your likes and comments to motivate me to share more analysis with you and share your opinion about the possible trend of this chart with me !
Best Regards , Arman Shaban

Traders Watch Gold Surge Ahead of Fed’s Next MoveGold 1H – Consolidation Before Fed Clarity
Gold on the 1H timeframe is currently trading around 3,746, moving within a well-defined consolidation range. Price action highlights a premium supply zone at 3,775–3,773 and a discount demand zone at 3,723–3,725. The market structure shows earlier signs of BOS and ChoCH, with engineered liquidity sweeps becoming evident. A potential Mitigation → Expansion sequence is in play, where a liquidity grab near discount demand could fuel a bullish leg toward premium supply.
From a macro perspective, today’s headlines underscore the cautious stance across financial markets as investors await the Federal Reserve’s upcoming guidance. Lingering inflationary concerns, coupled with speculation around the timing of future rate cuts, have kept volatility elevated. Meanwhile, geopolitical risks continue to underpin safe-haven demand for gold, adding an extra layer of support at discount levels.
This combination of technical liquidity zones and macro uncertainty sets the stage for tactical plays: fading moves into the supply zone while remaining prepared for dip-buying opportunities at defined demand areas.
________________________________________
📌 Key Structure & Liquidity Zones (1H):
• 🔴 SELL GOLD 3,775–3,773 (SL 3,782): Supply zone coinciding with a buy-side liquidity pool above 3,780, offering downside targets at 3,760 → 3,745 → 3,730.
• 🟢 BUY GOLD 3,723–3,725 (SL 3,718): Discount demand aligned with liquidity grab potential, with upside targets at 3,745 → 3,760 → 3,775+.
________________________________________
📊 Trading Ideas (Scenario-Based):
🔻 Sell Setup – Supply Rejection (3,775–3,773)
• Entry: 3,775–3,773
• Stop Loss: 3,782
• Take Profits:
TP1: 3,760
TP2: 3,745
TP3: 3,730
🔺 Buy Setup – Demand Mitigation (3,723–3,725)
• Entry: 3,723–3,725
• Stop Loss: 3,718
• Take Profits:
TP1: 3,745
TP2: 3,760
TP3: 3,775+
________________________________________
🔑 Strategy Note
With the Fed’s next move looming, traders should anticipate engineered sweeps into both premium and discount liquidity pools before the market establishes clearer direction. The tactical edge comes from aligning intraday setups with liquidity hunts:
• Fade supply at 3,775–3,773 if rejection confirms.
• Buy dips into 3,723–3,725 if liquidity is swept cleanly.
The broader narrative of inflation concerns, dollar sensitivity, and safe-haven flows reinforces the case for two-sided opportunities. Expect gold to remain volatile within this consolidation range, with sharp moves likely as liquidity is targeted ahead of Fed clarity.

XAG/USD | Silver Rally Continues – Bulls Eye $44.60 & $44.80! By analyzing the Silver chart on the 2-hour timeframe, we can see that after correcting down to $43.34, the price gained demand again and rallied more than 2.5%, reaching $44.47.
Currently, silver is trading around $44.16. If the price breaks above $44.49, we could see another push higher, first retesting $44.47, and then aiming for $44.60 and $44.80 as the next targets.
Please support me with your likes and comments to motivate me to share more analysis with you and share your opinion about the possible trend of this chart with me !
Best Regards , Arman Shaban

GOLD DAILY CHART ROUTE MAP UPDATEDaily Chart Update
3776 Target Achieved!!
A beautifully strong finish to the week, with our 1H and 4H chart ideas playing out, and now the daily chart projection completing perfectly.
Last week, we highlighted the importance of a candle body close above 3683, which opened the gap toward 3776. That target has now been hit with precision today – an awesome way to close the sequence.
With 3776 now achieved, the key focus shifts to the daily close:
A sustained close above this level would open the higher range above, confirming continued bullish strength.
A rejection here, however, would put support levels back into play at 3683 and the channel top.
Current Outlook
🔹 3683 Target Reached
Our breakout sequence played out with precision, starting from the EMA5 lock above 3564 and extending to complete the 3683 objective.
🔹 3776 Target Completed
Today’s price action delivered the full upside completion into 3776. Now, the daily close will decide whether the breakout extends further into new ranges.
🔹 Key Inflection – 3776
Close above = breakout range expansion.
Rejection = retest of 3683 and channel top support.
Updated Key Levels
📉 Support – 3683 & Channel Top
📉 Deeper Support – 3564 & 3433
📉 Pivotal Floor – 3272
📈 Resistance / Next Upside Objective – Sustained break above 3776 opens the range higher
🔥 What’s Next?
We’ll be back on Sunday with a fresh Daily chart idea, updated targets, and a full multi-timeframe analysis to guide the next leg of the journey. Stay tuned – momentum is only heating up from here!
Thank you for the continued support, and congratulations to everyone who rode this move with us.
Mr Gold
GoldViewFX
