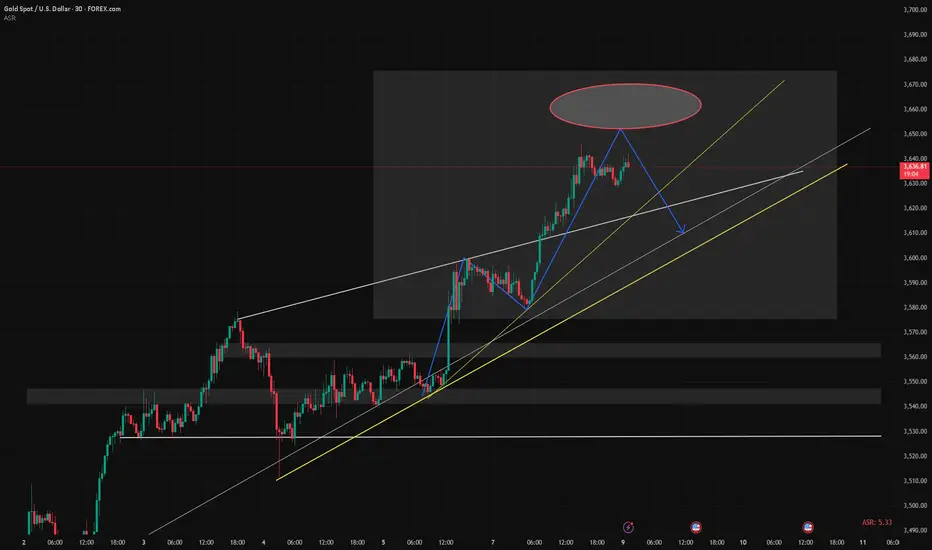
9/9: Expect a Main Pullback Today, Likely to Drop Below 3600🌅 Good morning everyone!
🔹 Key Support Levels
30M : 3632 / 3615–3598
1H : 3626 / 3614–3588
2H : 3608–3590 / 3560
4H : 3613–3598 / 3681–3664
1D : 3564 / 3507–3498
🔹 Key Resistance Levels
3650–3670
🔹 Intraday Trading Strategy
Sell on rallies, especially near 3650 and above
Buy on pullbacks at support, focus on the 1H support zones
Trade mainly in short-term swings, quick in and out, secure profits early
Yesterday, gold pulled back to around 3577 before rebounding strongly. Currently, the 30M chart shows a bullish alignment. In the short term, watch 3650 as a key resistance. If broken, price may extend to 3658–3670.
🎯 Overall Outlook: Buy the dips, sell the highs. Focus on key support and resistance levels, avoid holding positions too long.
Xauusd4h
9/8: Watch Resistance at 3594–3600, Support at 3560–3556Good morning everyone!
🔹 Key Support Levels
30M Chart: 3573–3562
1H Chart: 3571 / 3563–3556
2H Chart: 3573 / 3560–3556 / 3528
1D Chart: 3564 / 3507–3498
🔹 Key Resistance Levels
3594–3600 / 3608–3621
🔹 Intraday Trading Strategy
Sell on rallies; consider buying on pullbacks to support.
Last week, gold extended its upward trend, testing the 3600 area for the first time, supported by NFP data. Overall performance was moderate. The main reason was a conservative approach — focusing more on selling at resistance while cautiously buying on dips, which resulted in missing two major rallies. The profits captured from retracements were relatively small compared to the strong upward moves.
The current rally has been driven largely by expectations of a Fed rate cut. However, this bullish factor now appears to be largely priced in, with gold technically in overbought territory. In the short term, risk management is crucial: avoid chasing prices at historical highs. A safer strategy remains buying on pullbacks, which may be less aggressive but significantly reduces downside risks. Ultimately, the choice of strategy depends on individual trading styles.

XAUUSD HIGH PROBABILITY SETUPS SOON!!!🚨 XAUUSD HIGH PROBABILITY SETUPS 🚨
* Here We Can See Clearly The Next Potential Moves For GOLD Coming Hours/Days.
* Keep Your Eyes Close On Your Trading Positions.
* Happy PIP Hunting Traders.
£ FXKILLA £

Gold (XAU/USD) 3 September, 20251. Macro Outlook (Daily)
Gold continues to maintain a bullish macro structure, with consecutive higher highs (HH) and higher lows (HL) defining the trend. The most recent Break of Structure (BOS) above the $3500 handle confirms sustained upward momentum. Liquidity remains positioned above $3560 – $3575, where equal highs and untested buy-side liquidity are waiting to be taken.
The daily bias is therefore firmly bullish unless $3490 is broken, in which case deeper retracements may emerge.
2. Swing Structure (4H)
On the 4H chart, gold is respecting bullish order flow:
Liquidity below $3515 – $3505 remains vulnerable for inducement sweeps.
A fresh Fair Value Gap (FVG) $3518 – $3508 is unmitigated.
A bullish Order Block (OB) $3512 – $3500 serves as structural demand.
Together, these form a discount zone in alignment with the daily bias, offering high-probability continuation setups.
3. Execution Refinement (1H)
The 1H chart sharpens execution:
OTE retracement cluster $3520 – $3510 aligns with the 61.8–78.6% retracement of the last impulse.
Asia low at $3528 has been swept, providing inducement for London and NY session continuation.
Anchored VWAP from the weekly open sits at $3518, reinforcing institutional demand.
This confluence tightens the execution-ready buy zone for today.
4. Execution-Ready Zones
🔵 Primary Buy Zone (Golden Zone)
Entry: $3520 – $3510
Stop Loss: $3495
Rationale: Supported by daily bullish bias, fresh 4H OB, 4H FVG, 1H OTE, liquidity sweep, VWAP alignment, round number support, and resting liquidity.
Bias: High-probability long setup, >8 institutional confluences.
🔵 Secondary Buy Zone
Entry: $3505 – $3495
Stop Loss: $3480
Rationale: Deep discount, OB extreme, and structural inducement.
Bias: Backup long zone if deeper retracement occurs.
🔴 Primary Sell Zone
Entry: $3560 – $3575
Stop Loss: $3585
Rationale: Liquidity grab above equal highs, premium array, and supply confluence.
Bias: Countertrend fade, scalp only.
🔴 Secondary Sell Zone
Entry: $3595 – $3610
Stop Loss: $3625
Rationale: Weekly high liquidity, premium overextension, and 161.8% extension cluster.
Bias: Opportunistic fade; not suitable for swing shorts.
5. Risk Management & Profit-Taking Strategy
Instead of rigid pip targets, traders should adopt liquidity-based scaling:
Partial exits at session highs/lows (Asia, London, NY).
Major targets at daily/weekly liquidity pools (equal highs, equal lows, imbalance fills).
Leave runners open toward higher-timeframe liquidity magnets — notably $3800.
This approach ensures alignment with institutional order flow while capturing both intraday and swing opportunities.
🌟 Golden Zone of the Day
$3520 – $3510 (Buy Zone)
Backed by 8+ institutional confluences across Daily, 4H, and 1H.
Provides the highest-probability entry point for continuation of the prevailing bullish trend.
6. Strategic Conclusion
Gold’s current price action confirms institutional bullish order flow. Demand zones in the $3520 – $3510 region represent the most compelling setup for today, offering clean alignment across Daily, 4H, and 1H.
Countertrend shorts remain viable only at liquidity clusters near $3560 – $3575 and $3595 – $3610, but should be managed conservatively given the macro bullish context.
Professional traders should prioritize long exposure, scaling out at liquidity levels while leaving runners toward untested buy-side objectives higher up the curve.
📌 Institutional Note: Unless the $3490 level is breached, the path of least resistance remains higher, with liquidity objectives above $3560 – $3575 as the next upside magnet.

9/3: Chasing Highs Risks Traps, Selling Is SaferGood morning, everyone!
🔹 Key Support Levels:
30M chart: 3510 / 3498
1H chart: 3507 / 3480
1D chart: 3458
🔹 Key Resistance Levels:
3540–3550 / 3558–3562
🔹 Trading Outlook:
Focus primarily on short positions; avoid chasing the rally.
Light long entries may be considered near support, but profits should be taken quickly.
Yesterday, gold tested the 3500 level for the second time. After a brief pullback, bulls regained strength, pushing prices up to around 3540. Over the past week, gold has surged by nearly $200, with only minor retracements and no meaningful corrections.
At current levels, there are essentially no trapped long positions. Instead, the market is dominated by shorts under pressure and profit-taking from longs.
While prices might extend further toward 3550, I personally will not engage in such high-risk long trades. My overall strategy remains decisively bearish, with downside targets at 3460–3430.

Gold (XAU/USD) – 2 Sept 2025With spot gold anchored at $3493, today’s price action is unfolding within a well-defined technical framework. Institutional flows continue to dominate, and liquidity engineering in recent sessions has created precise execution zones. Below is the validated map of opportunity for the day, built upon a multi-timeframe confluence model.
🔹 Primary Buy Zone – $3472 to $3480
The most compelling area of interest sits between $3472 and $3480, an untouched 4H demand zone that aligns seamlessly with the Fibonacci golden pocket retracement of the prior bullish impulse. Liquidity was engineered below New York session lows, and this pocket now rests just above anchored VWAP support.
Stop Loss: $3466 (beneath order block invalidation)
Take Profits: 3493 / 3503 / 3513 / 3523 / Open trail
Zone Strength: 9/10 – Institutional Grade (Golden Zone)
This area represents today’s highest-probability setup. Should price hold above $3472, we anticipate continuation into $3520+ with strong order flow participation.
🔹 Secondary Buy Zone – $3450 to $3456
A deeper liquidity pocket exists around $3450–$3456, where Asia accumulation lows and equal-lows liquidity converge. This zone coincides with a 4H bullish order block and weekly anchored VWAP.
SL: $3442
TPs: same as above
Strength: 7/10 – Executable
This is a backup zone, valid only if the market aggressively hunts liquidity below the Golden Zone before resuming higher.
🔹 Primary Sell Zone – $3510 to $3518
On the upside, supply remains stacked at $3510–$3518, an unmitigated 4H supply block sitting above last week’s NY high. The zone also aligns with a 78.6% Fibonacci retracement and an ATR exhaustion band.
SL: $3525
TPs: 3500 / 3490 / 3480 / 3470 / Open
Strength: 8/10 – Strong Zone
If bulls overextend, this pocket offers a high-probability short back into mid-range liquidity.
🔹 Secondary Sell Zone – $3530 to $3538
A broader liquidity cluster rests higher at $3530–$3538, defined by a daily supply zone, weekly VAH/POC, and liquidity pools above equal highs at $3535. With speculative positioning heavily net-long in COT data, this area may serve as a distribution zone.
SL: $3544
TPs: same as Primary Sell Zone
Strength: 7/10 – Executable
⚜️ Executive Summary
Today’s Golden Zone is the Primary Buy Zone ($3472–$3480). With multi-timeframe demand, engineered liquidity sweeps, VWAP confluence, and Fibonacci overlap, this zone stands out as an institutional-grade opportunity (9/10).
Execution should remain patient and disciplined: wait for price to tap the Golden Zone, confirm via BOS/CHoCH on lower timeframes, and then scale profits progressively at each 100-pip interval.
In short: $3472–$3480 defines today’s battleground. If defended, bulls control toward $3520+. If breached, deeper liquidity hunts await at $3450 and $3530.

Gold (XAU/USD) 1st September 2025🔎 Market Context
Gold continues to trade within a high-liquidity environment, driven by ongoing flows between equity risk sentiment, real yields, and dollar positioning. With the $3500 psychological level acting as a liquidity magnet above, and demand clusters building in the $3440 region, today’s structure offers both sides of opportunity.
Our institutional framework layers multiple confluences across Daily → 4H → 1H, blending Smart Money Concepts (SMC), ICT, supply/demand, VWAP, and Fibonacci arrays. This ensures only the highest-probability zones are highlighted for execution.
🟢 Buy-Side Liquidity Zones
Primary Buy Zone – $3438 to $3446 (Golden Zone)
Why This Matters:
Daily demand + fresh 4H Order Block.
NY session low sweep + Asia accumulation base.
Fibonacci 61.8% retracement cluster.
Hidden RSI bullish divergence + anchored VWAP support.
Execution Plan:
Entry: $3440 – $3444
SL: $3432
TP1: $3476
TP2: $3490
Strength Score: 9/10 (A+ Institutional)
Secondary Buy Zone – $3410 to $3418
Why This Matters:
Deep daily demand retest.
Weekly VWAP lower band + 78.6% retracement.
Sweep of last week’s low + $3415 round magnet.
Execution Plan:
Entry: $3412 – $3416
SL: $3402
TP1: $3442
TP2: $3470
Strength Score: 6/10 (Medium Zone)
🔴 Sell-Side Liquidity Zones
Primary Sell Zone – $3488 to $3496
Why This Matters:
4H supply aligned with 1H bearish OB.
Daily swing high liquidity resting at $3492.
Volume Profile POC + $3490 magnet.
Overbought RSI with bearish divergence on 1H.
Execution Plan:
Entry: $3490 – $3494
SL: $3504
TP1: $3460
TP2: $3446
Strength Score: 8/10 (Strong Zone)
Secondary Sell Zone – $3518 to $3526
Why This Matters:
Higher-timeframe supply continuation.
Liquidity sweep of quarterly highs near $3520.
Options expiry gamma cluster in $3520s.
Execution Plan:
Entry: $3520 – $3524
SL: $3532
TP1: $3490
TP2: $3465
Strength Score: 5/10 (Medium Zone)
🏆 Golden Zone of the Day
👉 Primary Buy Zone ($3438 – $3446)
Best alignment across institutional confluences.
High conviction zone with clear liquidity sweep and macro alignment.
Execution favors long positioning with SL $3432 | TP1 $3476 | TP2 $3490.
📌 Final Bias
Longs favored on dips into $3440 Golden Zone.
Sells only valid if liquidity sweeps extend into $3490/$3520 zones.
Maintain disciplined risk with tight stops below liquidity pockets.

GOLD XAUUSD - Pullback Expected before the Next Leg UpGold (XAUUSD) has been on a solid bullish run, consistently pushing higher after each minor retracement. Now, we’re eyeing a potential pullback toward a key support zone at 3420–3400, where buying interest is likely to resurface.
If price action confirms a bounce from this zone, we could see a continuation of the uptrend toward 3450, and if momentum holds, possibly stretching to 3490–3500.
🔻 Trade Setup – Long Opportunity on Pullback
Entry: Buy Gold (XAUUSD) at 3420
Add-on Dip: 3400
Targets: 3450, then 3490–3500 (marked on chart)
Invalidation: Daily close below 3385
📌 Risk/Reward Outlook
This setup presents a tight risk with attractive upside potential. As always, stick to solid risk management and size your positions based on your personal trading plan.
👍 Agree with this view?
Drop a like, leave your comments, and let’s discuss this setup together!
Your feedback keeps the community sharp and growing. 🔥
Happy Trading,
– The InvestPro Team

Gold (XAU/USD) Technical Outlook - 29 August 2025Gold remains in a highly reactive zone, with price currently consolidating near the $3410 handle. Institutional order flow shows a battle between bulls defending discount demand zones and bears attempting to exploit premium supply levels. By combining Daily, 4H, and 1H confluences, today’s analysis outlines the most execution-ready buy and sell zones with defined entries, stop-loss levels, and profit targets.
🔹 Primary Buy Zone – $3388 to $3396
This is the highest-probability demand area for today. On the Daily timeframe, the zone sits within a deep discount region of the last bullish leg, aligning with the broader macro bias. The 4H chart reveals a fresh, unmitigated bullish order block, while the 1H structure confirms a BOS (Break of Structure) and liquidity sweep beneath equal lows.
Momentum indicators support this view — RSI is approaching oversold levels, and MACD momentum is shifting bullish. Volume also highlights absorption, suggesting institutional accumulation.
Entry: $3392
SL: $3384
TP1: $3415
TP2: $3428
🔹 Secondary Buy Zone – $3365 to $3372
If the primary demand fails, the next strong support sits around $3365–$3372. This zone overlaps with a Daily breaker block and coincides with the 50% retracement of the previous swing leg. On 4H, liquidity is pooled just below $3370, while 1H imbalance (FVG) aligns with demand.
RSI divergence also strengthens the bullish probability here.
Entry: $3368
SL: $3358
TP1: $3390
TP2: $3410
🔹 Primary Sell Zone – $3425 to $3435
This is the strongest intraday supply zone. On the Daily timeframe, price approaches a premium level of the current retracement, while 4H charts show a fresh supply zone formed from institutional distribution. The 1H chart reveals liquidity buildup above $3428, creating an engineered high.
RSI is flashing bearish divergence at this level, with volume showing prior rejection and imbalance — confirming potential sell-side pressure.
Entry: $3430
SL: $3438
TP1: $3410
TP2: $3395
🔹 Secondary Sell Zone – $3448 to $3458
This zone sits higher, acting as a fallback supply level. It overlaps with a Weekly supply zone, while 4H structure confirms old consolidation highs resting here. If tapped, price is likely to engineer liquidity before displacement. ATR also shows exhaustion at this level, making it a potential reversal point.
Entry: $3453
SL: $3463
TP1: $3430
TP2: $3410
🏆 Executive Summary – Golden Zone
The Primary Buy Zone ($3388–$3396) is nominated as today’s Golden Zone. This area aligns with Daily discount, 4H unmitigated demand, and 1H structural confirmation. With multiple confluences (order block, BOS, liquidity sweep, RSI, MACD), it presents the highest reward-to-risk opportunity.
Golden Execution Idea:
Buy $3392 → SL $3384 → TP $3428 (≈1:4 RR)
Final Thoughts
Gold is currently positioned at a critical juncture, with well-defined buy and sell zones framing today’s opportunities. Traders should stay disciplined, execute only on confirmed setups, and remain aware of liquidity manipulation around key levels. The $3388–$3396 Golden Zone offers the most institutionally aligned trade for today, but alternative supply and demand levels provide structured backup scenarios.

GOLD Resistance Ahead!
HI,Traders !
#GOLD is trading in an
Uptrend and Silver shot
Up sharply today and it
Is now locally overbought
So after the retest of the
Horizontal resistance above
At 3436.05 from where we
Will be expecting a local
Bearish move down !
Comment and subscribe to help us grow !

Gold (XAU/USD) 28 August 2025Gold continues to consolidate within a high-volatility environment, with price testing key liquidity pools and approaching unmitigated supply/demand levels. Today’s analysis blends Daily macro bias, 4H swing structure, and 1H execution refinement to identify the most reliable zones for institutional-grade entries.
🔵 Demand Zones (Buy Setups)
Primary Buy Zone: $3360 – $3370
This is today’s highest-probability demand area.
Daily: Bullish structure intact with higher-highs and higher-lows.
4H: Fresh bullish Order Block formed after a strong BOS (Break of Structure).
1H: Liquidity sweep below recent lows at 3372, providing a refined entry trigger.
Indicators: RSI recovery from oversold divergence; MACD showing momentum reversal.
Volume: Absorption at 3365 confirms buyer presence.
Execution Plan:
SL: 3350 (structure invalidation)
TP1: 3405
TP2: 3425
Secondary Buy Zone: $3325 – $3335
Daily: Nested demand block aligning with prior bullish BOS.
4H: Deep discount zone of previous swing.
1H: ICT displacement candle originated at 3330, unmitigated.
Execution Plan:
SL: 3310
TP1: 3365
TP2: 3400
🔴 Supply Zones (Sell Setups)
Primary Sell Zone: $3420 – $3430
This is the nearest high-probability supply area.
Daily: Strong resistance shelf; unmitigated supply.
4H: Bearish OB after displacement down from 3428.
1H: Liquidity pool resting above 3415 equal highs.
Indicators: Bearish RSI divergence; MACD momentum fading.
Execution Plan:
SL: 3440
TP1: 3390
TP2: 3365
Secondary Sell Zone: $3455 – $3465
Daily: Weekly supply nested in premium pricing.
4H: Swing-high liquidity at 3460 remains untested.
1H: Inefficient wick zone above equilibrium.
Indicators: RSI extreme overbought; ATR volatility ceiling.
Execution Plan:
SL: 3475
TP1: 3430
TP2: 3400
⭐ Executive Summary – Golden Zone
The Primary Buy Zone at $3360 – $3370 stands out as today’s Golden Zone:
Backed by 6 institutional confluences across Daily, 4H, and 1H.
Well-defined risk with SL at 3350.
Reward asymmetry toward TP1 at 3405 and TP2 at 3425.
This zone offers the cleanest risk-to-reward profile, aligning macro structure with intraday liquidity positioning.
⚖️ Final Note
As always, zones are execution frameworks, not blind signals. Wait for confirmation on 1H/15M displacement and liquidity sweeps before entering. Managing risk with precision is crucial given Gold’s current volatility and ATR expansion.

Gold (XAU/USD) 27 August 2025Gold continues to trade in a well-defined structure, with buyers defending higher-lows while sellers attempt to cap upside momentum near the $3400 handle. Today’s analysis blends the Daily → 4H → 1H confluences to outline execution-ready trading zones with clear invalidation and profit objectives.
🔵 Demand Zones – Where Buyers Are Positioned
📍 Primary Buy Zone: $3368 – $3373
This zone carries the strongest institutional weight for the day:
Daily higher-low structure remains intact above $3365.
4H bullish order block + fresh BOS confirmation.
ICT’s Optimal Trade Entry discount (0.618–0.705 retracement).
RSI bullish divergence on 1H; MACD slope turning positive.
Strong absorption wick confirmed at $3370 on the last sweep.
📌 Trade Plan:
Entry: $3368 – $3373
SL: Below $3360
Targets: $3395 → $3410
📍 Secondary Buy Zone: $3350 – $3355
A deeper liquidity-driven fallback demand level:
Untested 4H demand block from breakout leg.
Daily demand base aligning with sell-side liquidity resting below $3355.
MACD crossover and ATR volatility expansion on 1H support demand.
📌 Trade Plan:
Entry: $3350 – $3355
SL: Below $3345
Targets: $3380 → $3400
🔴 Supply Zones – Where Sellers Are Positioned
📍 Primary Sell Zone: $3402 – $3408
The first line of resistance for intraday traders:
4H lower-high structure aligning with Daily resistance.
Fresh bearish order block and FVG imbalance inside zone.
RSI divergence (bearish) on both 4H & 1H timeframes.
Thin volume node above $3400 → prone to rejection.
📌 Trade Plan:
Entry: $3402 – $3408
SL: Above $3415
Targets: $3388 → $3370
📍 Secondary Sell Zone: $3420 – $3426
A liquidity sweep zone with higher timeframe supply:
Daily supply block remains unmitigated.
Buy-side liquidity pool resting above $3420.
ATR extension = capped intraday volatility.
VWAP overextension favors mean reversion.
📌 Trade Plan:
Entry: $3420 – $3426
SL: Above $3435
Targets: $3400 → $3385
🟡 Executive Summary – The Golden Zone
Today’s Golden Zone is the Primary Buy Zone ($3368 – $3373).
It aligns across Daily (higher-low support), 4H (fresh bullish OB), and 1H (execution refinement). Backed by 6+ confluences, this zone offers the highest-probability continuation trade, targeting the $3410 region.
✅ Bias: Maintain bullish stance above $3365. Look for dip buys around $3368–$3373, while fading exhaustion only at defined sell zones above $3402.

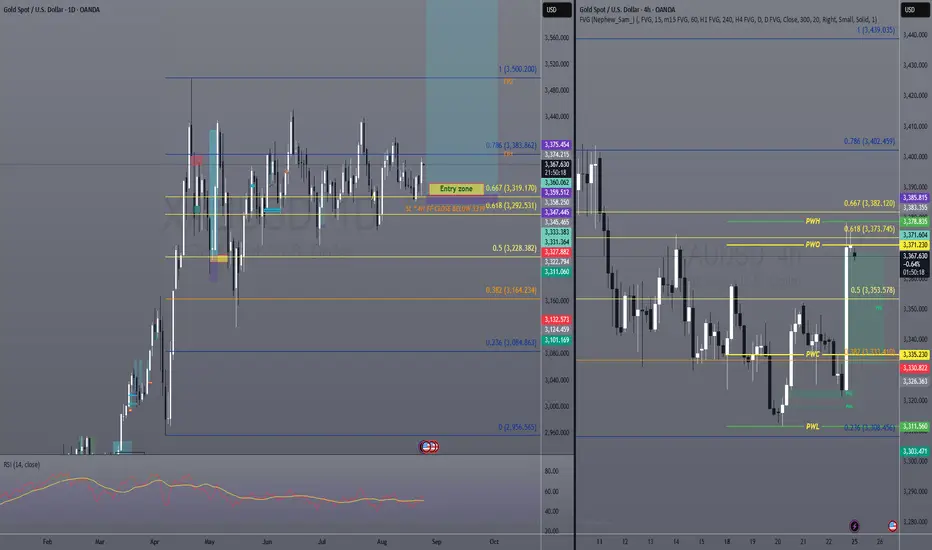
Unlocking Gold’s $3,600 Rally Before the Crowd /Best Entry Point1️⃣ General Overview
Gold remains in a corrective phase. Unless we see a clear 4H close above 372, bearish corrective pressure will stay stronger. However, certain zones may trigger bullish reactions if respected.
2️⃣ Key Levels
353 → First potential reversal area.
364 – 373 → Upside targets if 353 closes above this price on the 4H timeframe.
378 → Breakout level; above it price opens the way to higher targets.
382 – 392 – 402 → Next resistance levels if price closes above 378 on 4H timeframe.
335 → Strongest potential weekly buy zone if tested.
329 – 335 (ideal 35–29 range) → Ideal buy zone, though less likely to be visited this week.
3️⃣ Trade Scenarios & Setups
🔹Bullish Setup:
4H close above 353 → look for a move toward 364 → 373 → swing/open target.
4H close above 378 → momentum extends to 382 → 392 → 402.
Above 402 → new analysis will be required.
🔺 Bearish Setup:
4H close below 353 → decline toward 335 (strong weekly buy zone).
An extended drop into the 35–29 range = an ideal buy setup, but the probability is low.
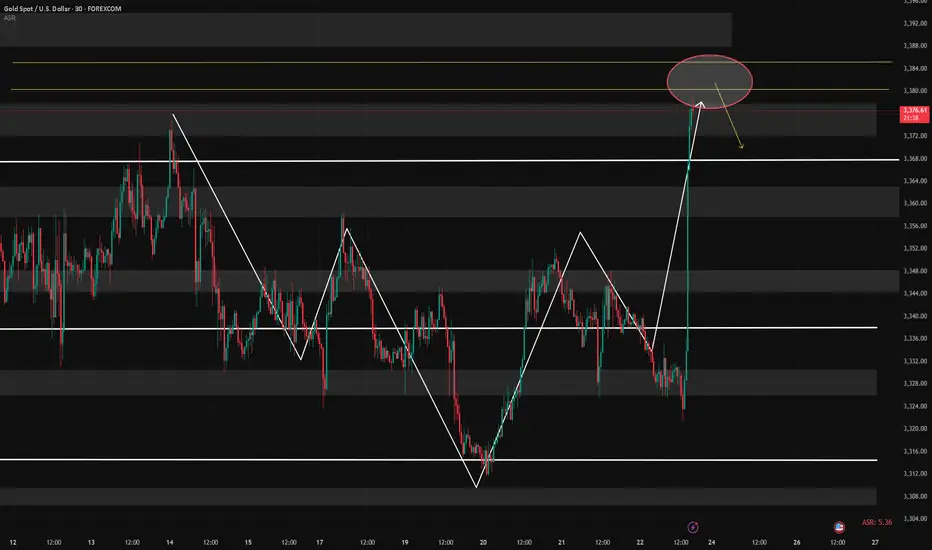
8/25: Watch Support at 3358–3352, Resistance at 3386–3391Good morning, everyone!
Gold surged strongly last Friday on news headlines. But as I mentioned earlier, such sharp rallies are usually followed by pullbacks. While further upside is possible, without fresh catalysts, the higher it climbs, the greater the risk and scope of a correction. Thus, my bias remains bearish for now.
📌 Support: Watch 3358–3352 first, then 3343–3337. A direct drop to the secondary support is less likely, so if the first support holds, small long attempts may be considered.
📌 Resistance: Initial resistance at 3378–3386, with stronger barriers at 3391–3400. Near 3400, the probability of profitable short trades increases significantly.
Remember: consistent profits don’t come from a single lucky trade but from managing trade frequency, avoiding a gambler’s mindset, and adjusting both strategy and mindset when mistakes occur. Master these, and long-term steady gains become achievable. Stay focused, and learn to truly be in control of your trading.

GOLD Short From Falling Resistance!
HI,Traders !
#GOLD is rising and will soon reach a falling
Resistance line. After retesting it, we expect
a decline and a move down toward the target!
Comment and subscribe to help us grow !

Rate Cut Expectations Boost Gold — Caution on HighsFed Chair Powell noted that shifting economic risks strengthen the case for rate cuts, signaling potential support for a 25bp cut at the September meeting. In response, gold bulls surged, breaking through the 3358–3366 resistance and reaching around 3378.
⚠️ Caution: After sharp rallies, pullbacks are common. Avoid blind chasing — if you do, keep positions light and be ready to close quickly.
📌 My outlook: I’ve started entering sell positions, with key supports to watch at 3366–3358–3352 during pullbacks.
Importantly, this rally has shifted the 1D structure; holding above 3350 could open the door for a bullish move toward the 3400 level.

Gold (XAU/USD) Analysis - 22 August 2025Gold continues to trade within a high-volatility range, and today’s structure provides us with very clear execution zones validated across the Daily, 4H, and 1H timeframes. By blending price action, order flow, and institutional concepts, we can refine both the buy and sell areas that carry the highest probability of delivering asymmetric returns.
Macro Context (Daily)
The daily chart maintains a bullish undertone as higher-lows remain intact, and price continues to defend key demand blocks. That said, the upper range resistance around the $3360–$3380 area has capped recent rallies, leaving the market positioned between a strong daily demand base and significant supply overhead.
Swing Structure (4H)
On the 4H, gold is consolidating between a fresh demand block at $3318–$3324 and a supply block at $3356–$3362. This consolidation aligns perfectly with premium/discount zones of the current 4H range, giving us clarity on where institutional flows are likely to engage.
Execution Refinement (1H)
The 1H chart adds precision:
A bullish FVG and demand overlap sit at $3320, creating inducement for long entries.
Above, clear liquidity is resting just beyond $3355 and again near $3380, prime zones for potential stop-runs and reversals.
Momentum indicators (RSI/MACD) show hidden bullish divergence at demand and early exhaustion at supply — adding weight to both sides of the range.
Execution Zones
Primary Buy Zone (Golden Zone) → $3318 – $3324
Entry: $3322 | SL: $3312 | TP1: $3345 | TP2: $3360
Confluence: Daily demand OB + 4H discount zone + 1H FVG + RSI divergence.
Secondary Buy Zone → $3302 – $3308
Entry: $3306 | SL: $3296 | TP1: $3328 | TP2: $3340
Confluence: Deep retracement into 61.8% Fib + untapped 4H OB + liquidity sweep potential.
Primary Sell Zone → $3356 – $3362
Entry: $3359 | SL: $3369 | TP1: $3342 | TP2: $3325
Confluence: Daily resistance + 4H supply OB + premium zone + liquidity inducement above $3355.
Secondary Sell Zone → $3378 – $3384
Entry: $3381 | SL: $3391 | TP1: $3360 | TP2: $3335
Confluence: Major untested daily supply + 4H imbalance + stop-run liquidity.
Executive Summary
The clearest asymmetric opportunity lies in the Primary Buy Zone at $3318–$3324, which aligns across Daily, 4H, and 1H with multiple layers of confluence. This zone provides tight risk control with substantial upside toward $3360.
Until we see a decisive break of either the $3300 handle or the $3380 resistance, expect gold to remain range-bound with sharp liquidity grabs at both extremes. Institutional order flow favors a buy-the-dip bias within demand zones, while rallies into supply should be approached with tactical shorts.
Golden Zone = Buy $3318 – $3324
(best confluence: demand OB + FVG + RSI divergence + structural HL defense)

8/21: Sell High and Buy Low Within the 3358–3332 RangeGood morning, everyone!
Gold rallied strongly yesterday. On the 4H chart, bulls still show upward momentum, but price has now entered the key 3352–3358 resistance zone. On the 30M chart, divergence signals are emerging, suggesting that the higher gold climbs, the greater the risk of a pullback.
During a retracement, watch support at 3343–3337–3332. In the short term, consider trading within the 3358–3332 range by selling near resistance and buying near support, while closely monitoring support/resistance flips. If bulls sustain momentum and break above 3358, the 3363–3378 zone offers a relatively safer area to look for short setups.

XAUUSD Safe-Haven Flows Could Trigger Bullish Move in GoldI’m currently analyzing XAUUSD (Gold) 🪙✨, which appears to be significantly oversold 📉 and now trading into a prior bullish imbalance zone ⚖️ — an area where price could begin to rebalance. This level is particularly important, as it has acted as a key reaction point multiple times in the past 📊. With gold being overextended and signs of weakness emerging in the stock markets 📉📉, my view is that capital could rotate into safe-haven assets 🛡️, potentially fueling a gold rally 🚀. I’ll be watching for a bullish break of structure 🔍 as a signal to enter long. (Not financial advice.)

XAUUSD: Rebound Resistance & Short SetupAugust 18th: Gold closed at a daily low on Friday and gapped down slightly at the open on Monday. After dipping to a low of 3323, it staged a rebound. The wedge pattern is gradually converging, and the overall price action remains in a top-side consolidation phase.
On the 4-hour chart, consecutive strong bullish candles have broken through and held above the middle Bollinger Band, with the short-term trend shifting from weak to strong. That said, as the 3358-3360 resistance zone remains unbreached for now, the price is still stuck in a downward correction channel.
Trading strategy: Consider shorting on a rebound around the aforementioned resistance zone. A confirmed break above this level would open the door to 3370-3380. For support, keep an eye on 3332 and 3320 below
⚡️⚡️⚡️ XAUUSD ⚡️⚡️⚡️
🚀 Sell@ 3360 - 3355
🚀 TP 3345 - 3340 - 3335
Daily updates bring you precise trading signals 📊 When you hit a snag in trading, these signals stand as your trustworthy compass 🧭 Don’t hesitate to take a look—sincerely hoping they’ll be a huge help to you 🌟 👇

Institutional Gold Analysis (XAU/USD) – 19 August 2025Gold prices are consolidating in a narrow range near $3,331, reflecting a transitional market phase as traders await fresh direction from the Federal Reserve’s upcoming Jackson Hole summit. The prevailing bias leans mildly bearish in the short term, with USD strength and higher yields capping upside momentum, while underlying safe-haven demand continues to provide structural support.
From a 4-Hour institutional perspective, price action currently sits at the midpoint of an internal range, offering clearly defined liquidity pools both above and below. This creates an environment where institutional flows are likely to engineer sweeps into key supply and demand zones before a decisive expansion phase begins.
Primary Institutional Zones
Primary Buy Zone ($3,320–$3,325)
The dominant area of interest for buyers lies within $3,320–$3,325, a well-defined discount zone that combines multiple layers of institutional confluence. This level is supported by a Rally-Base-Rally (RBR) demand zone, a fresh unmitigated order block, and a fair value gap formed during recent displacement. The retracement aligns perfectly with the Optimal Trade Entry (OTE) Fibonacci band (0.705–0.79), while liquidity pools at equal lows (EQL) provide the setup for a sweep before reversal. From here, upside targets extend first to the structural resistance at $3,348, and further towards $3,372 — the 1.272 Fibonacci extension of the last impulsive leg.
Primary Sell Zone ($3,345–$3,350)
On the supply side, the clearest short opportunity emerges between $3,345–$3,350, which has been validated as a Drop-Base-Drop (DBD) supply zone. This area overlaps with a fresh order block and fair value gap, while resting in the premium half of the internal swing. Equal highs (EQH) clustered at this level signal an ideal liquidity grab, with displacement likely to follow during London/New York Kill Zone overlap. Downside targets from this zone first revisit $3,331, with extended projections toward $3,295 (Fib 1.272 extension).
Fallback Levels
Should the primary zones be invalidated through manipulative displacement or deeper liquidity hunts, fallback areas are defined:
Fallback Buy Zone ($3,310–$3,315): This deeper demand pocket provides secondary positioning if the primary buy zone fails, offering a structural base for recovery back into $3,325–$3,348.
Fallback Sell Zone ($3,360–$3,365): If price sweeps beyond the primary sell zone, this extended premium region becomes the next institutional supply area, targeting retracements back to $3,350–$3,331.
Golden Zone Nomination
Of all identified zones, the Primary Sell Zone ($3,345–$3,350) emerges as the Golden Zone of the day. It represents the highest-probability, institution-grade setup due to its multi-layered confluence, liquidity alignment, and Kill Zone overlap. With the market capped below $3,350 in recent sessions, this level offers the most favorable balance of risk and reward for intraday execution.
Institutional Confirmation
Cross-validation with external institutional sources strengthens this bias. Reuters confirms gold’s range-bound behavior ahead of the Fed’s Jackson Hole summit, while FXStreet highlights fading bullish momentum near $3,330. TradingNews also reinforces the significance of the $3,348–$3,350 cap as resistance, perfectly aligning with our Sell Zone. Together, these insights support the transitional-to-bearish outlook, while acknowledging that long-term structural demand from central banks remains intact.
Conclusion
In summary, gold remains trapped between defined liquidity pools, awaiting a catalyst for directional expansion. For today, the Primary Sell Zone ($3,345–$3,350) stands out as the Golden Zone, offering the most institutionally aligned short opportunity with multiple confirmations. Meanwhile, the Primary Buy Zone ($3,320–$3,325) provides a structurally valid counterpoint should liquidity sweep lower. Until the Fed’s policy guidance becomes clear, traders should expect range-bound behavior with engineered liquidity grabs during London and New York sessions, best exploited by targeting the defined high-probability institutional zones.

GOLD Swing Short!
HI,Traders !
#GOLD made a bearish
Breakout of the key horizontal
Level of 3347.89while trading
In a downtrend so we are
Bearish biased and we will
Be expecting a further
Bearish continuation !
Comment and subscribe to help us grow !
